S.I.Sukhonos
THE NEW DIMENSION OF THE UNIVERSE
Our world is huge, and it is organized with astonishing grace and precision. The large-scale harmony of the Universe is a universal and important regularity of nature. Gathering together disparate facts, the author convincingly presents a holistic picture of the world order. He intersperses his conclusions and hypotheses based on scientific evidence with interesting philosophical arguments concerning different aspects of existence.
What is the foundation of all life on Earth? What place does man occupy in the hierarchical structure of the biosphere? How is Russia fundamentally different from the rest of the world? Why do all stars, ending their lives, “divide” into two parts? How do viruses and bacteria reproduce? What does the expansion of the Universe lead to? What does the level of power of mankind as a whole and each individual depend on?
Preface by Alexander Astafiev MD, Ph.D., MBA
The book of Sergey Ivanovich Sukhonos The new dimension of the Universe is based on the ideas of current-cosmism, still little known in the West. Within this doctrine, a special place is occupied by Russian cosmism, which stands out for its optimism and positive view of the future. Adherents consider cosmism to be a genuine fruit of Russian thought, a significant part of the “Russian idea,” which has its roots in the unique archetype of universality—the principle of the integrity of the world. Perhaps it is this view of the world that served as the basis for the fact that the first satellites and cosmonauts went into space precisely from Russia.
My name is Alexander Astafiev. I was born and received my medical education in the Soviet Union. After the collapse of the country, fate brought me to the United States, where I continued my career as a physician. Despite the distance, I have always kept in touch with my friends and family in the post-Soviet region, following the scientific and medical achievements of the region. The works of Sergey Ivanovich Sukhonos had a special influence on me, offering a key to understanding the universe. I saw in his approach not only a new way of looking at cosmology but also the potential for applying this method to other scientific and philosophical disciplines. Unfortunately, Sukhonos’ ideas are still unknown in the West, which inspired me to take the lead in translating them by gathering a team of like-minded people.
Philosophers with such a broad outlook and encyclopedic knowledge are rare, and cosmism, as a line of thought, presents a universal answer to the question of the future of humanity, which seeks to overcome natural limitations and go beyond the Earth. The new dimension of the Universe raises fundamental questions of cosmology and the order of the universe.
In this work, Sukhonos discovered and described the universal dimension of the Universe, which had not been realized and comprehended before him. The work became a cornerstone in the formation of the method of comprehension of the worldview developed by the author. In subsequent works, Sukhonos developed this method and applied it to other aspects of the world order and expanding the horizons of scientific and philosophical cognition.
Sergey Sukhonos deservedly ranks with the great Russian cosmists - Nikolai Fedorov, Konstantin Tsiolkovsky, Alexander Chizhevsky and Vladimir Vernadsky. Since the late 19th century, science has radically transformed human life, and this process continues to this day. The huge flow of data and narrow specialization make it difficult to make sense of modern science as a whole. Nevertheless, it is a global project that affects all of humanity. I am confident that Sukhonos’ book represents an intellectual bridge that connects the knowledge needed to address global issues.
Although the ideas of cosmism are not yet widespread in the West, I see them reflected in the modern endeavors of individuals such as Elon Musk. The same aspirations that drove the Russian cosmists who envisioned our future beyond Earth are embedded in them. All Russian cosmism is imbued with an extraordinary optimism that allows it to overcome the fear of death and the end of the world.
This book will raise before the reader eternal questions about the purpose of life in the Universe and the role of humanity in the cosmic order. The main task is to understand ourselves in a new cosmological context and create a new image of the Universe. And if we can act within this paradigm, perhaps we will find the key to solving the global problems of mankind.
P.S. With deep sorrow, I inform readers that Sergey Sukhonos tragically passed away in a car accident on January 30, 2025. My heartfelt condolences go out to his family, close friends, and like-minded colleagues.
Since Sergey Sukhonos tragically passed away and can no longer continue his work, I feel it is my duty to share with readers the discussions we had while working on the English edition.
The main challenge was that the meaning of words, especially the newly coined terms introduced by the author, was often lost in direct translation. As a result, we had to change the book’s title to ensure that its core idea was clearly conveyed to the reader. The introduction, refinement, and standardization of terminology within the framework of the S-Dimension concept greatly facilitated the development of a specialized conceptual set, making the English edition more accessible and comprehensible.
Sergey Sukhonos was known for his humility and deep respect for his fellow researchers. We had extensive discussions about the name of the Open Dimension. I suggested calling it the “Primordial” Dimension to emphasize that all subsequent dimensions unfold within it and that referring to it as the “Fourth” would diminish its significance.
Eventually, he accepted this proposal, and we began making the necessary revisions to the text. However, his tragic passing prevented us from completing this work. Without his final approval, I decided not to change the name of the dimension he had discovered.
I am completing my translation in full accordance with his wishes and instructions. I consider everything stated above essential, as readers and future researchers must know that Sergey Sukhonos fully understood the place of his dimension in the universe and agreed with its designation as the “Primordial” Dimension.
Introduction to the Scale Dimension (S-Dimension)
In the Middle Ages, man perceived himself as the center of the universe (Fig. 1), since, according to the Bible, God created the whole world for man’s sake and for his benefit.
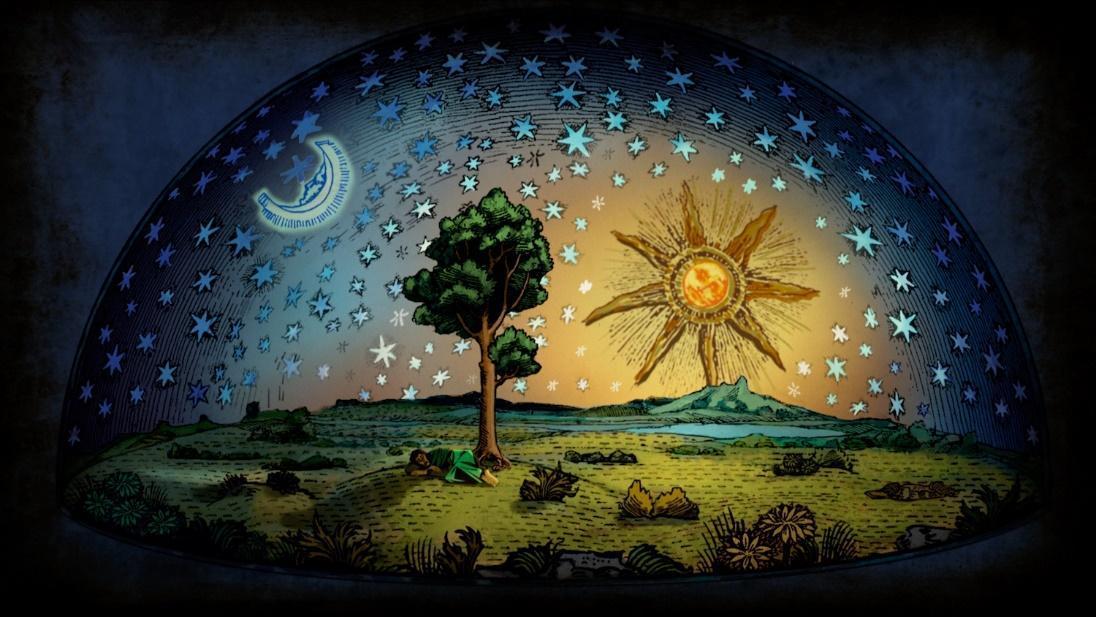 Fig. 1. Medieval idea of the Universe - flat earth and spherical starry dome above it
However, since the XVI century, thanks to the invention of the telescope, it became obvious that it is the Earth that revolves around the Sun, and not all planets and luminaries revolve around the Earth. And the medieval model of the “cozy cosmos” gradually began to collapse, and the stellar abyss opened before man (Fig. 2).
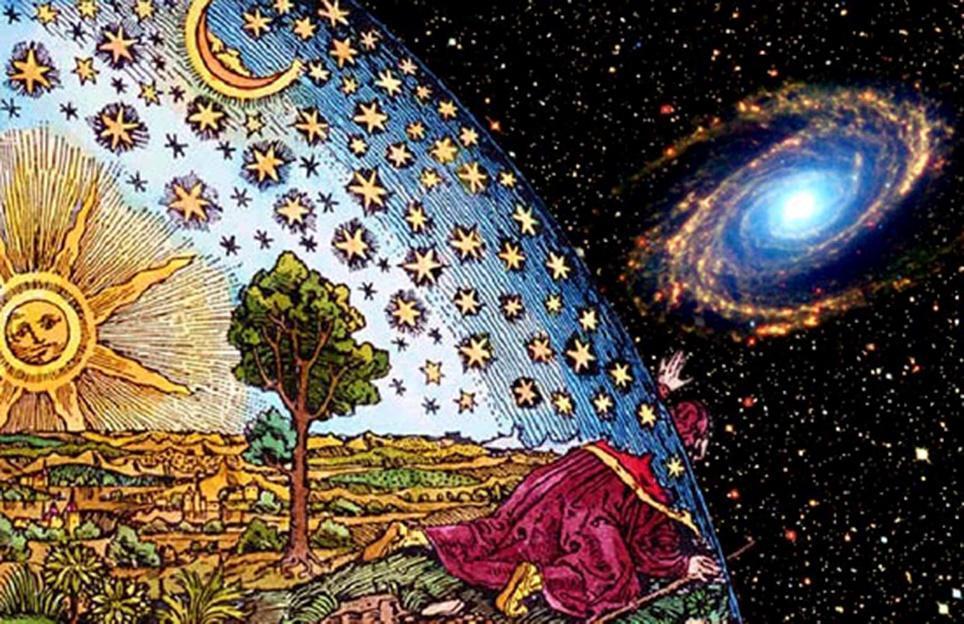 Fig. 2. When telescopes were opened, it became clear to everyone that there was no star dome but an infinite abyss of stellar space.
Since the sixteenth century, as telescopes were improved, astronomers have pushed the horizons of perception of the visible cosmos further and further. The human eye can distinguish only a thousand stars in the sky, but now more than a billion have been described and cataloged. But they are much more, because only in our Galaxy there are about 10 billion stars, and there are already more than 10 billion such galaxies in the Universe.
In addition to the growth of the number of stars and galaxies, the size of the visible world gradually grew. From planetary orbits and the scale of the Solar System (\(10^{15}\) cm) to the size of our Galaxy (\(10^{23}\) cm), from the size of our Galaxy to the size of the entire Metagalaxy (\(10^{28}\) cm). And gradually (but very rapidly by historical standards) man in self-perception moved from the center of the Universe to the backyard of the Universe (Fig. 3).
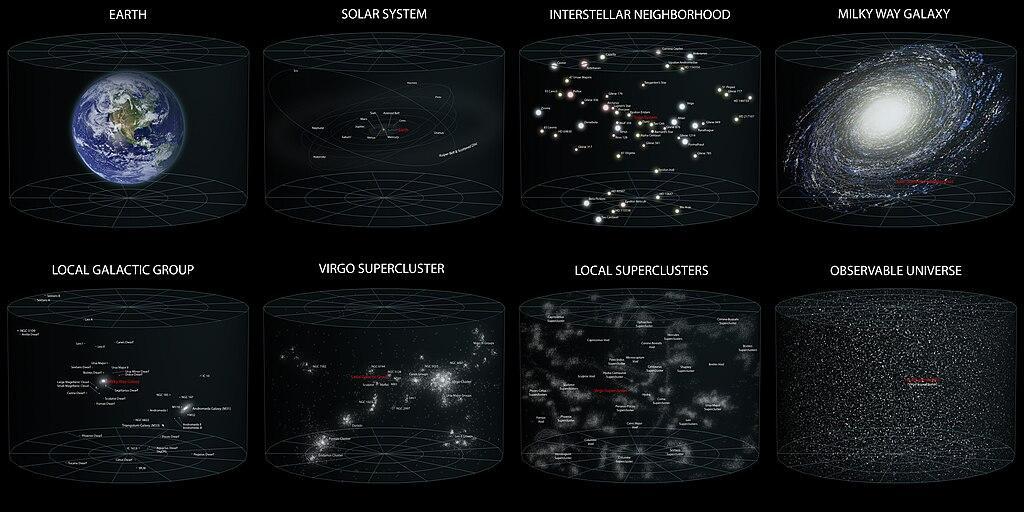 Fig. 3. Comparison of the scale of the Solar System with different systems in the Galaxy and Metagalaxy. Author Andrew Z. Colvin
The visible world of the cosmos has expanded to an incredible size, which must be overcome even at the speed of light in a time of more than 10 million years. And the human scale relative to the Metagalaxy turned out to be 26 orders of magnitude smaller, i.e. a billion billion billion people smaller than the visible Universe.
Nothing was left of the cozy medieval biblical picture. This caused the entire educated humanity a worldview shock, which was noted by V.I. Vernadsky:
While enlarging the world to extraordinary proportions, the new scientific worldview at the same time relegated man with all his interests and achievements - relegated all the phenomena of life - to the position of an insignificant detail in the cosmos.
and P. Davis:
Humanity has never fully recovered from the intellectual shock of losing its privileges on Earth.
The position of “an insignificant detail on the backside of the universe” humiliates our self-awareness, rooted in the biblical myth of human exceptionalism. After all, for thousands of years man has been convinced that all these stars and the Earth were created by God for him and for his benefit.
However, mankind will never be able to return to the “children’s room” under the starry dome to its “sandboxes” and “dolls.” Mankind has learned the true scale of the Universe and it is necessary either to come to terms with its “insignificant position in the cosmos” or to find a new meaning in these vast spaces and a new place for itself and all living things in the Universe.
Paradoxically, it was the accumulation of data on the large size of the Universe and the depths of matter that led at the end of the twentieth century to the discovery of an incredible fact that returns life, but now on a modern scientific basis, to the center of the universe forever.
But before we show this, consider the movement of cognition into the realm of the microcosm.
The invention of the telescope coincided with the invention of the microscope. And as the horizons of cognition expanded, mankind also moved in the opposite direction to the area of ever smaller sizes. First it was possible to see cells, then molecules, then atoms, and finally their nuclei and elementary particles. To date, the smallest particles visible in the instruments are protons and neutrons with sizes of \( 10^{-13}\) cm.
Further instrumental progress, however, for a long time stalled, because even at the Large Hadron Collider has not yet been able to look inside the protons and see their hypothetical quarks.
Despite the “instrumental deadlock”, theoretical physics managed to look 20 orders of magnitude deeper than the proton scale. In the 1900s Max Planck demonstrated to the scientific community his calculations of the so-called fundamental length (\( 10^{-13}\) cm) and proved that it is not possible to look deeper than this size at all because the uncertainty principle does not allow it. This size (its more precise value is \(1.6\times10^{-13}\) cm) has since been called Planck’s fundamental length in honor of its discoverer.
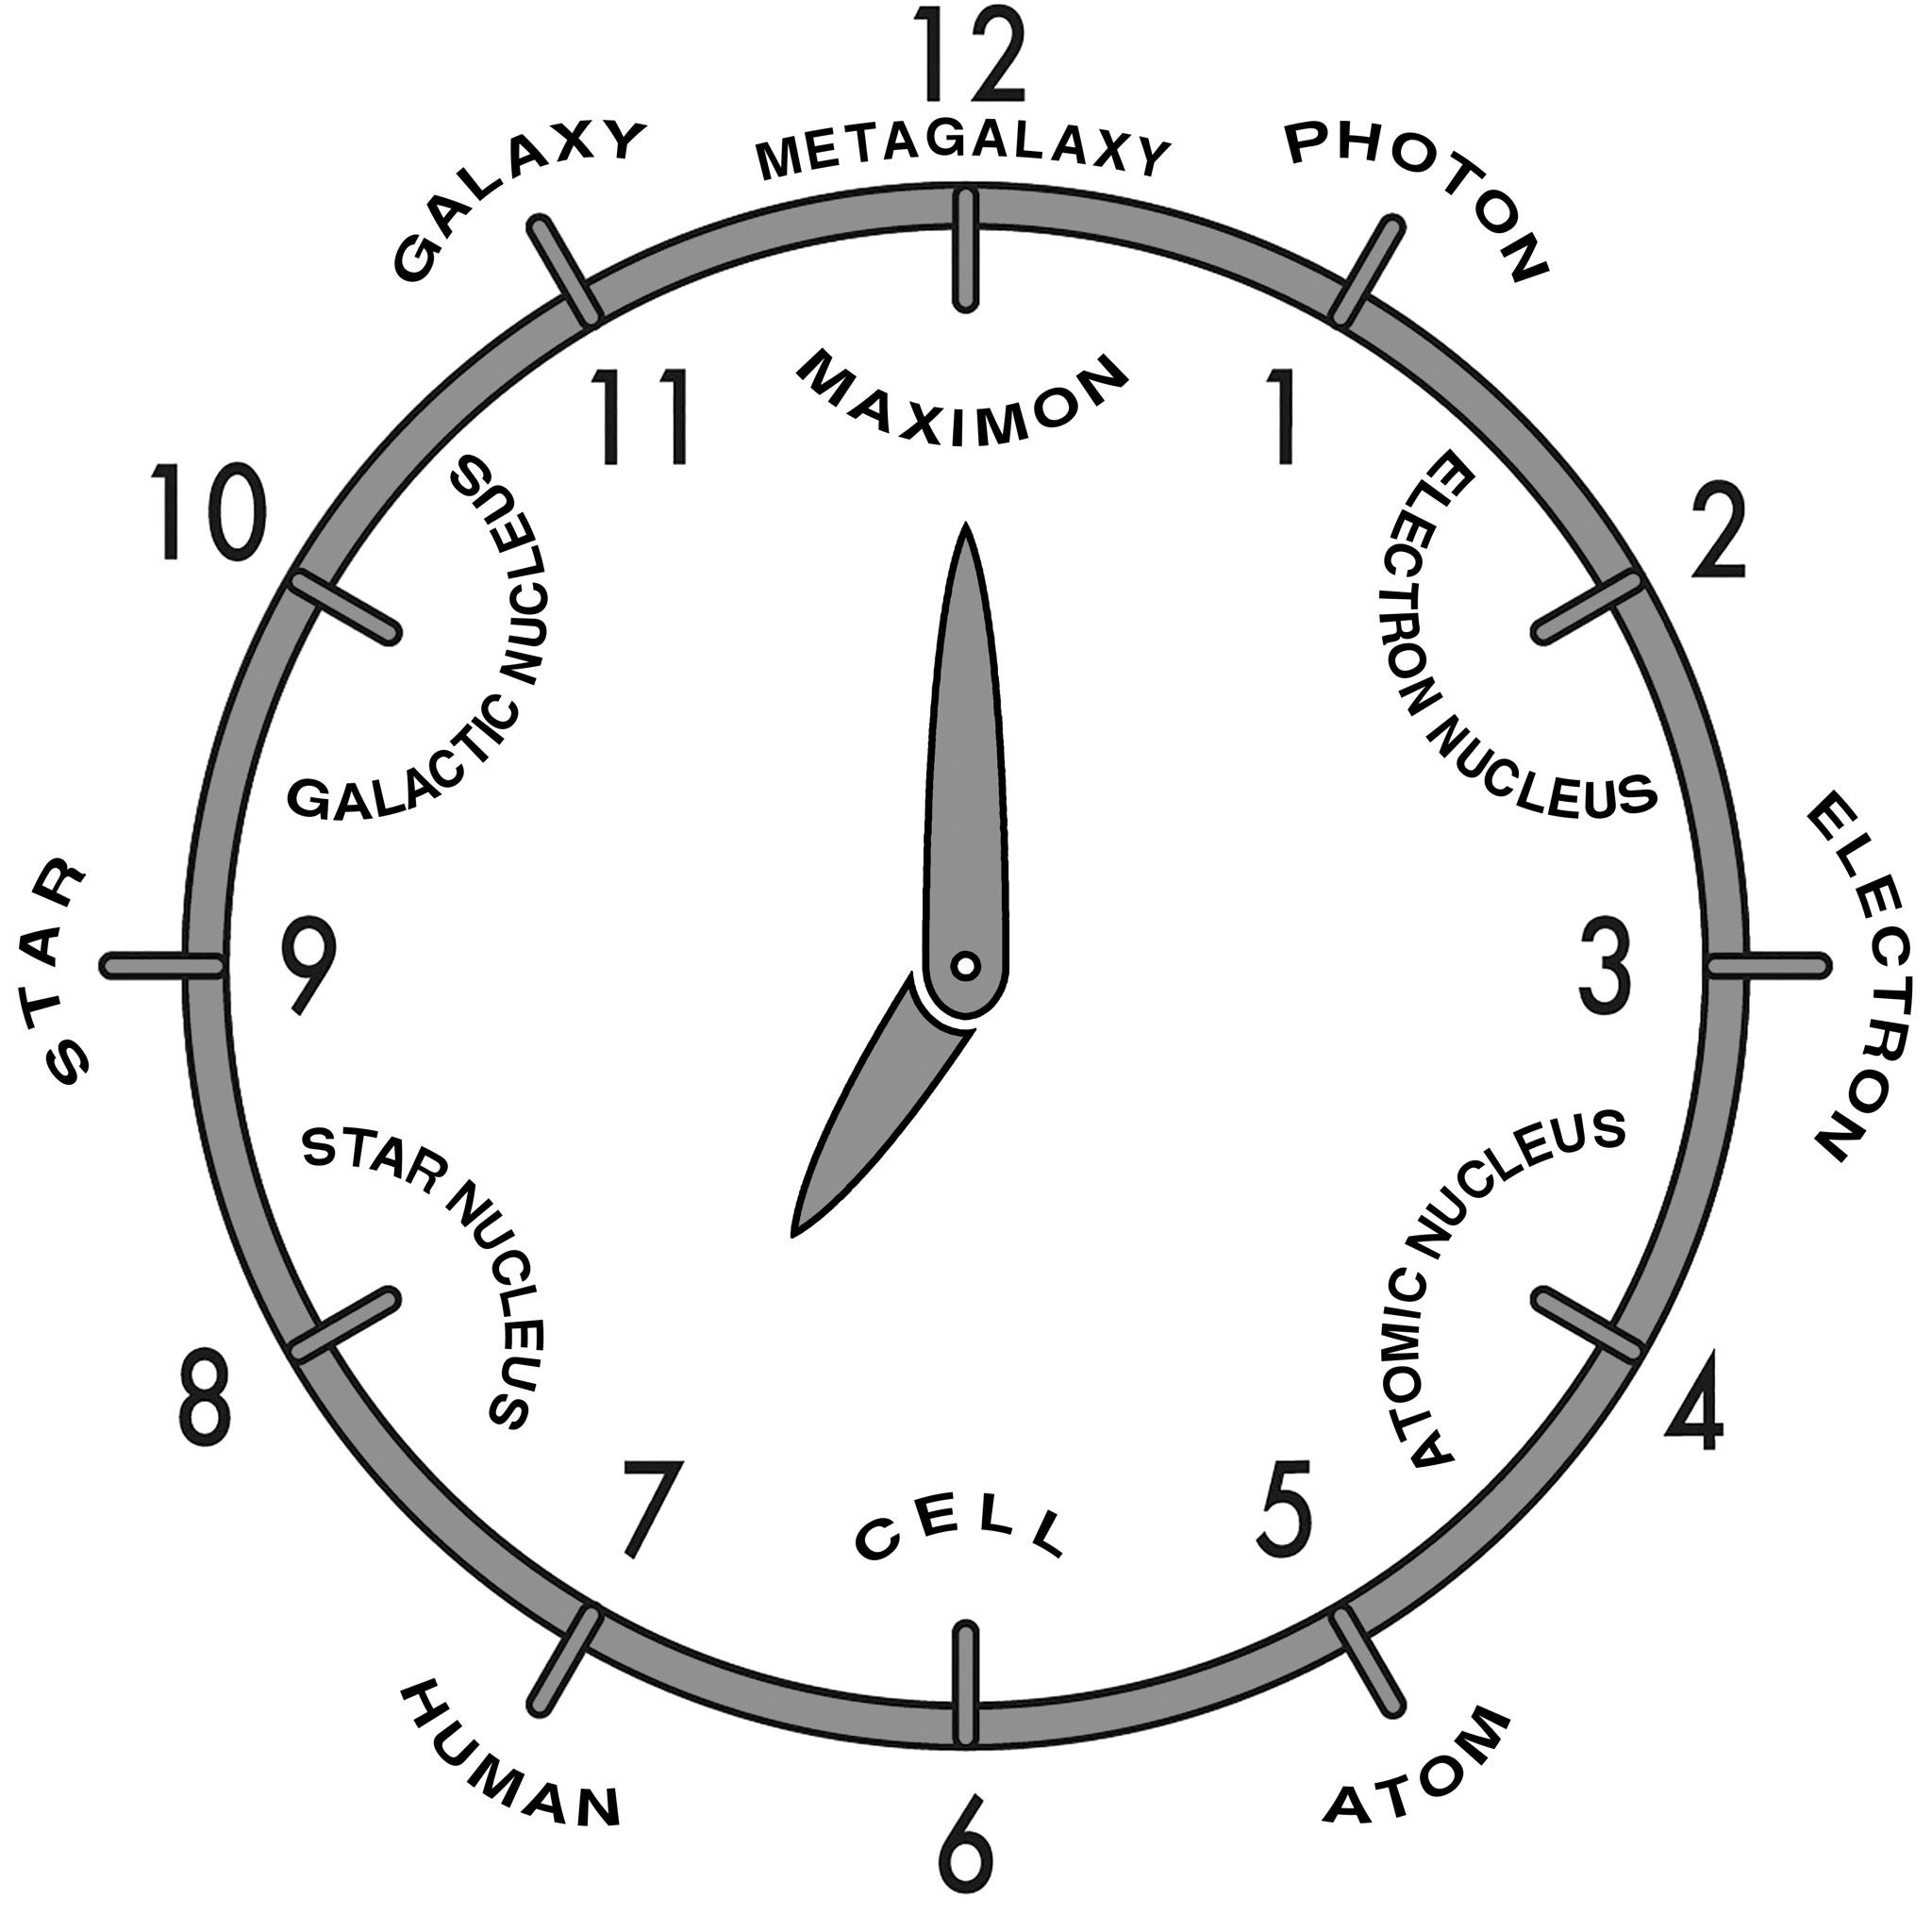
To place all particles, objects, and systems from atomic nuclei to the Metagalaxy studied by science on one diagram, we can use the scale of decimal logarithms (Fig. 4), which we will further abbreviate as the S-axis, and the whole interval from -33 to +28 as the S-interval.
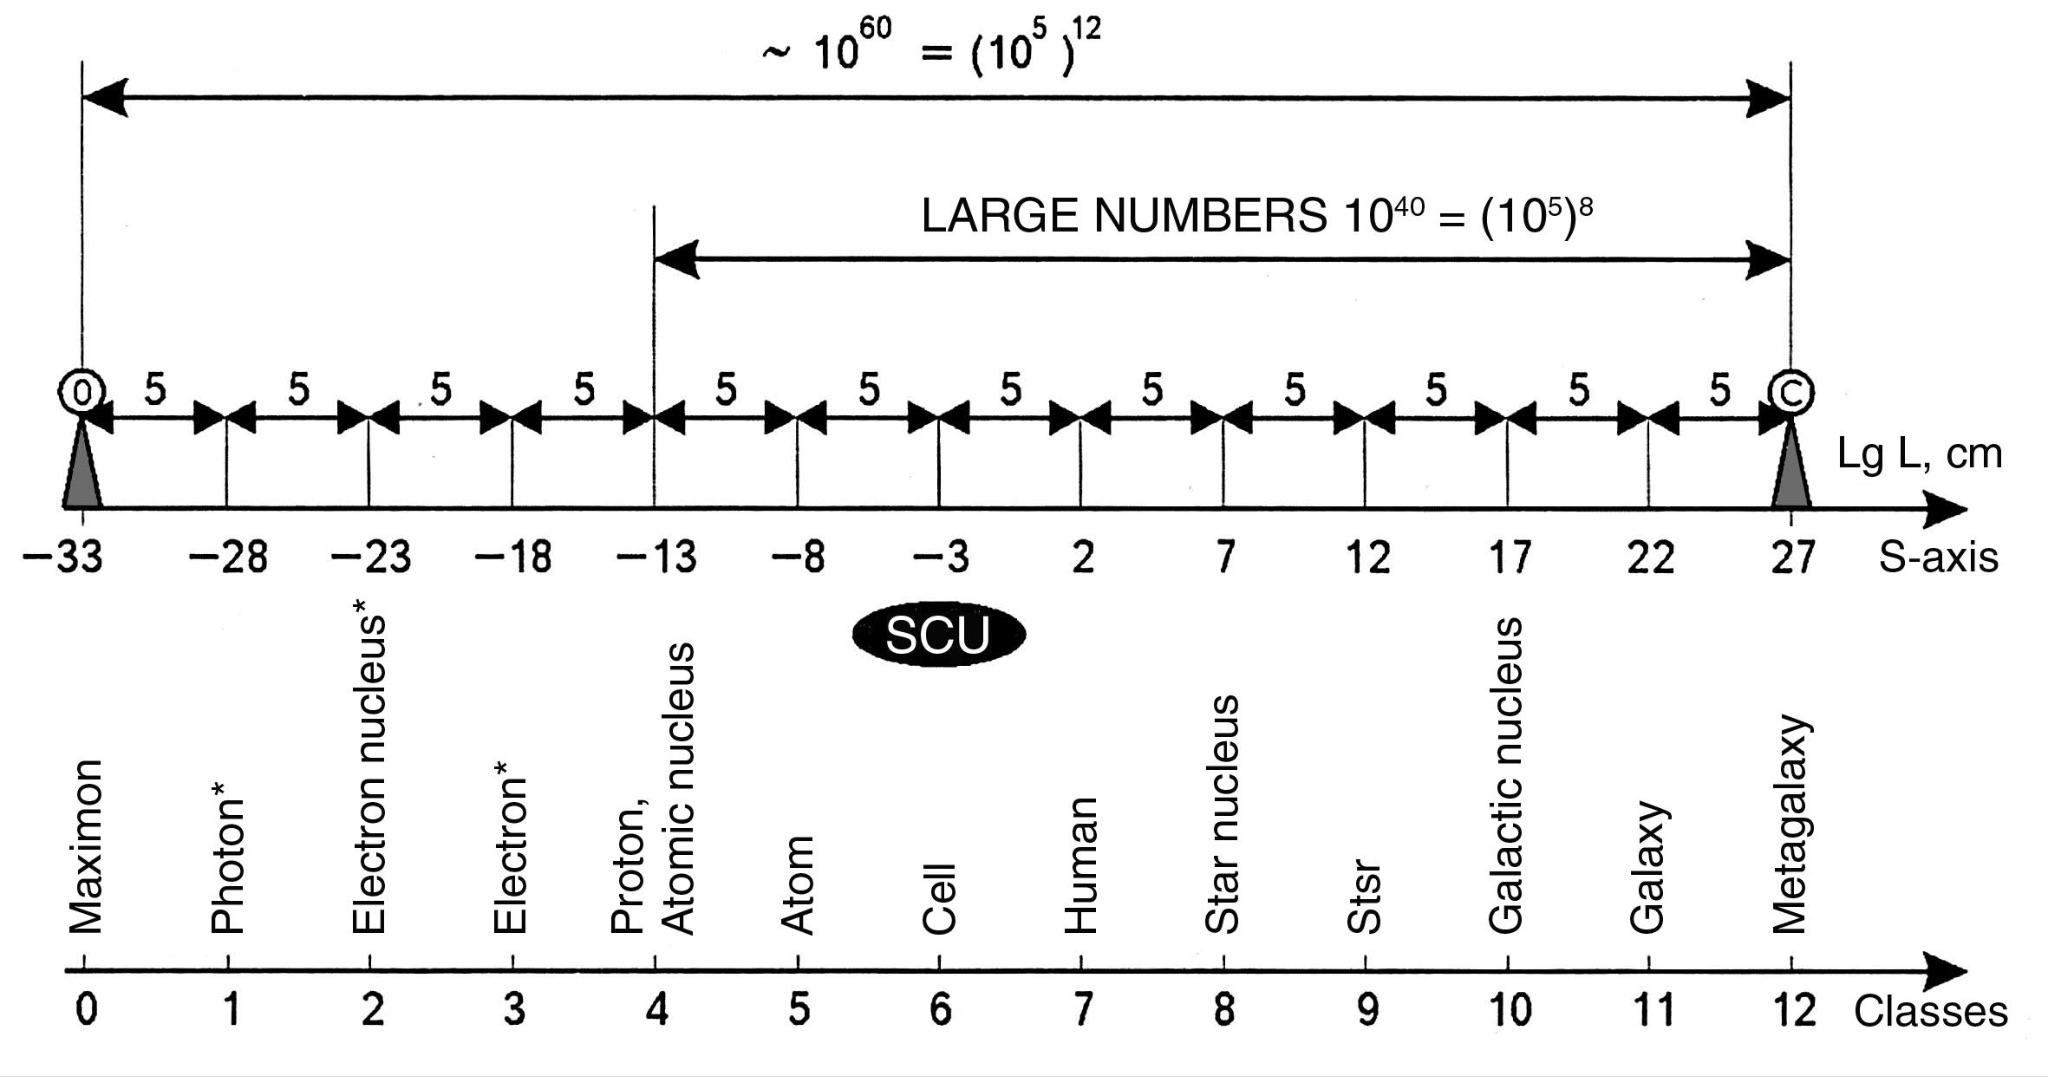 Fig. 4. The range of sizes of objects known to science on the scale of decimal logarithms for our Universe ranges from the fundamental Planck length of -33 (\( 10^{-13}\) cm) to the Metagalaxy of +28 (\(10^{28}\) cm)
Thus, everything that modern science can study in the Universe is contained within the dimensional range on the decimal logarithm axis from the fundamental Planck length (-33) to the Metagalaxy itself (+28). The total length of this logarithmic interval is exactly 61 orders of magnitude.
On this scale (see Fig. 4) to the left in the range from -33 to -13 is the sub-microcosm region, which is completely unexplored experimentally, so physicists call it Dirac’s basement. And it stretches from the Planck length (-33) to the size of atomic nuclei (-13) by 20 orders of magnitude. And to the right of the “Dirac basement,” with a step of 5 orders of magnitude are placed nucleons, atoms, cells, man, nuclei of stars, stars, nuclei of galaxies and galaxies themselves. This series of significant objects of our Universe is closed by the Metagalaxy proper - the visible part of the Universe, which consists of billions of galaxies forming the so-called “foam structure,” by the way, very similar to the neural network of the brain (Fig. 5).
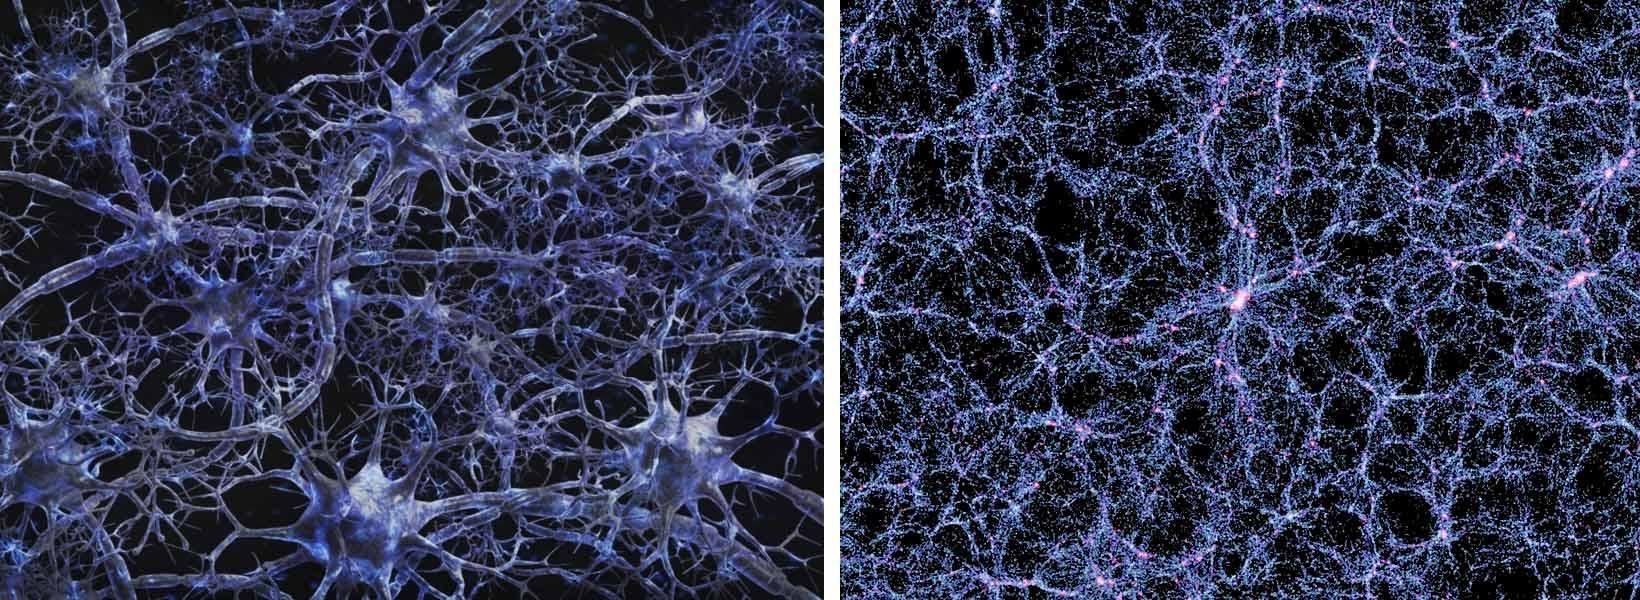 Fig. 5. Foam structure of the Metagalaxy (right), which is very similar in its structure to the neural structure of the brain (left)
And as studies have shown, all the most significant objects of the Universe are located on the logarithmic axis (S-axis) of the sizes of this interval from the proton diameter to the metagalaxy itself strictly periodically with a step of 5 orders of magnitude (Fig. 6).
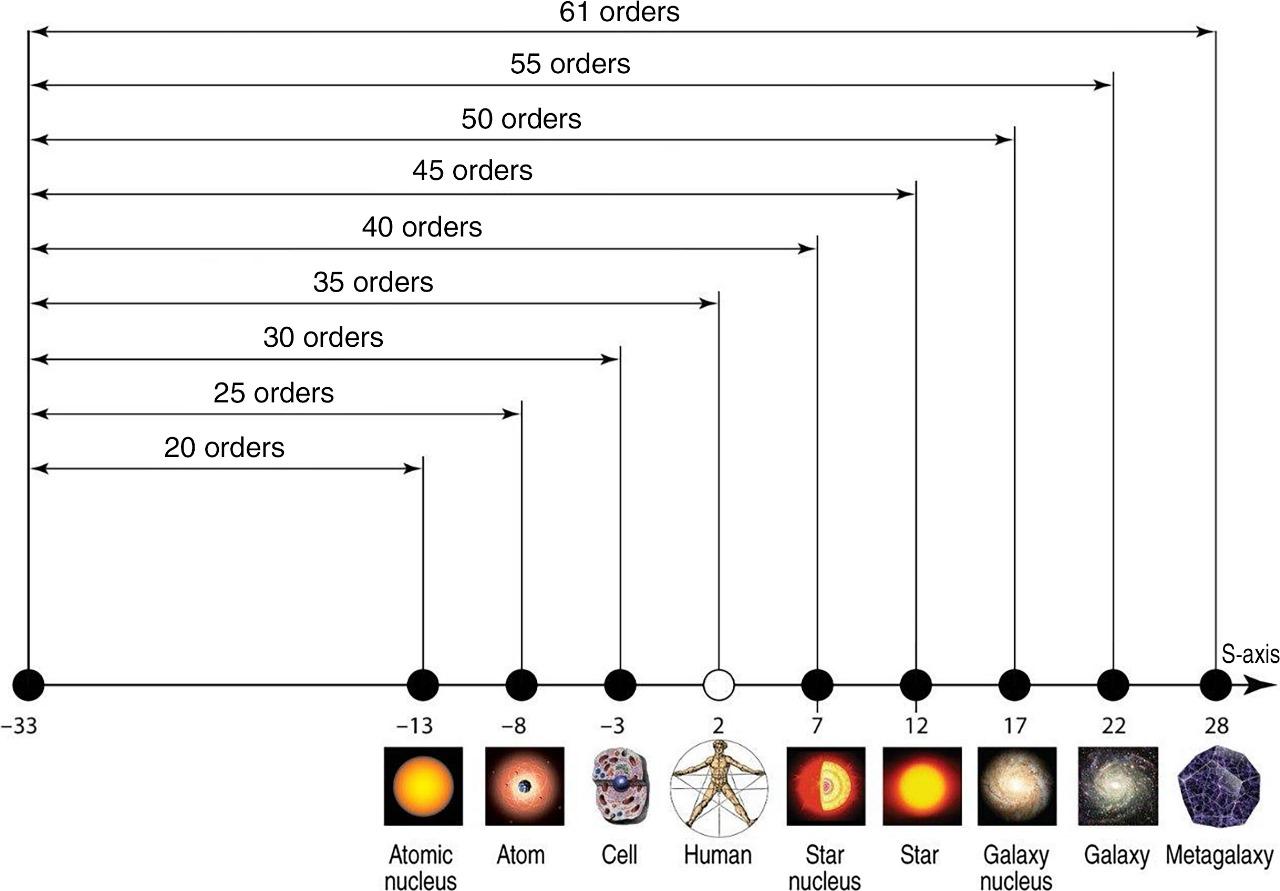 Fig. 6. All key elements, objects and systems of our Universe are located on the S-axis strictly through 5 orders of magnitude
The nature of this periodicity and many of its consequences are the subject of this book.
Taking into account the fact that naturally the human eye does not see objects smaller than a speck of dust (\( 10^{-3}\) cm), and real distances (not counting the mythological “dome of the sky”) for our vision are limited to a hundred kilometers (this is how far a person can see from the top of a mountain, because the “horizon line” hides more distances for us), then before the appearance of the microscope and telescope a person could see and study on the Earth about 5 orders up and down from his scales on the S-axis (Fig. 7). And for many centuries and millennia, the “dimensional corridor of perception” for man was limited to 10 orders of magnitude on the logarithmic axis - +5 from man’s sizes upwards and -5 from man’s sizes downwards. And only for a negligible by historical standards period of several decades in the beginning of the twentieth century, these 10 orders of perception on the dimensional axis turned into 61 orders.
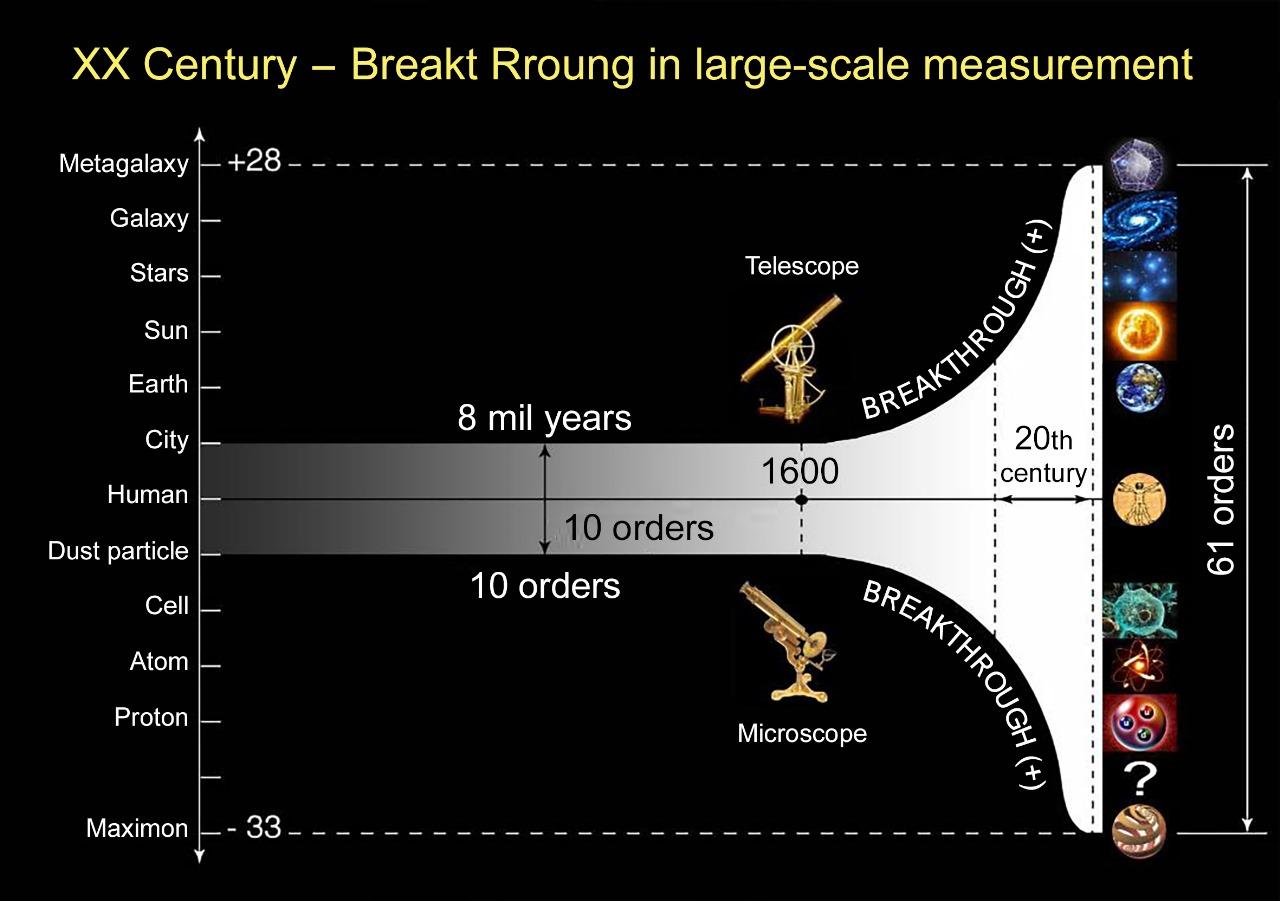 Fig. 7. Almost all of the history of mankind, have seen no smaller than a speck of dust and no further than the horizon from the top of a mountain - i.e. 10 orders of magnitude on the S-axis. Only the invention of the microscope and telescope gradually began to expand the scale boundaries of cognition. A sharp breakthrough occurred at the turn of the 19th and 20th centuries, when the S-range of perception expanded from 10 orders of magnitude to 61 orders of magnitude.
It can be allegorically described as follows - the dimensional curtains of horizons opened and a completely different world of dimensional depths and heights of the Universe collapsed on the collective consciousness of mankind. After that, mankind found itself in a completely different reality and until now (although more than a hundred years have passed), it has not yet had time to comprehend all these depths and heights of our world. And this reality is so unusual and mysterious that it will take decades, maybe even centuries, before the collective human mind will comprehend it. But this reality, besides the alleged humiliation of our self-consciousness, has brought to mankind all the benefits of modern civilization (Fig. 8), which have poured out of the horn of plenty on mankind in the last century from the depths of the microcosm (up to nuclear energy) and from the heights of outer space (e.g., satellite communications).
THE THREEFOLD FRACTALITY OF THE UNIVERSE
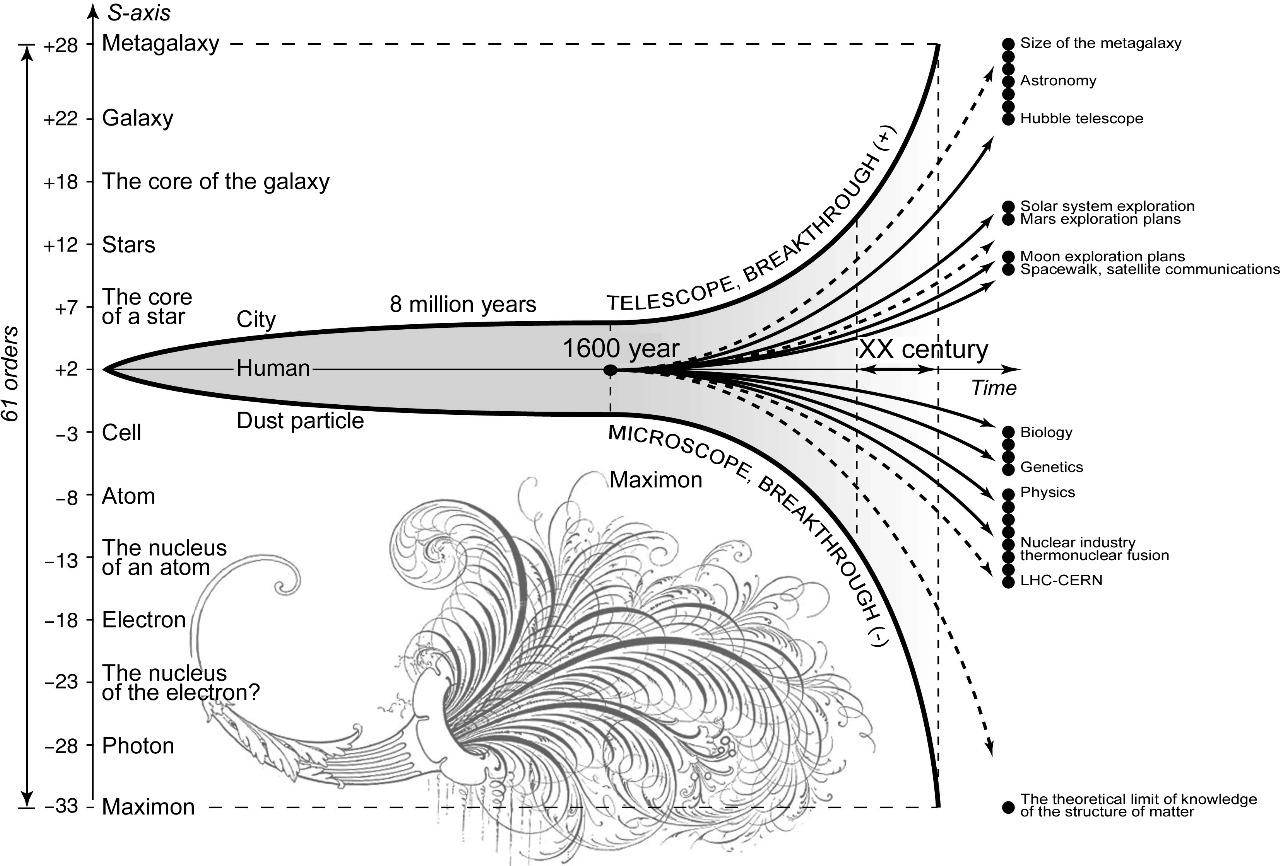 Fig. 8. “Horn of technological abundance,” which is based on the use of the structures of the microcosm and the grandiose spaces of the cosmos.
Studies of the regularities of this new reality, begun by the author in the 1970s, were reflected in numerous articles and in the final book, which is presented here for the reader’s judgment. The results of the studies of these parametric depths and heights turned out to be so unusual and surprising that they attracted the attention of journalists and scientists, up to academicians of the USSR Academy of Sciences, which made it possible, immediately after these results were made public at the All-Union School-Seminar on Classification Theory in Bork (October 1979), to publish them in the leading popular journals of the USSR, such as “Znanie sila”, “Nauka i zhizn”, “Khimiya i zhizn”, “Tehnika-molodezhi”… as well as in the collections of the Moscow State University and in the reports of the USSR Academy of Sciences.
The main result of this study was the discovery of wave periodicity along the S-axis (Fig. 9).
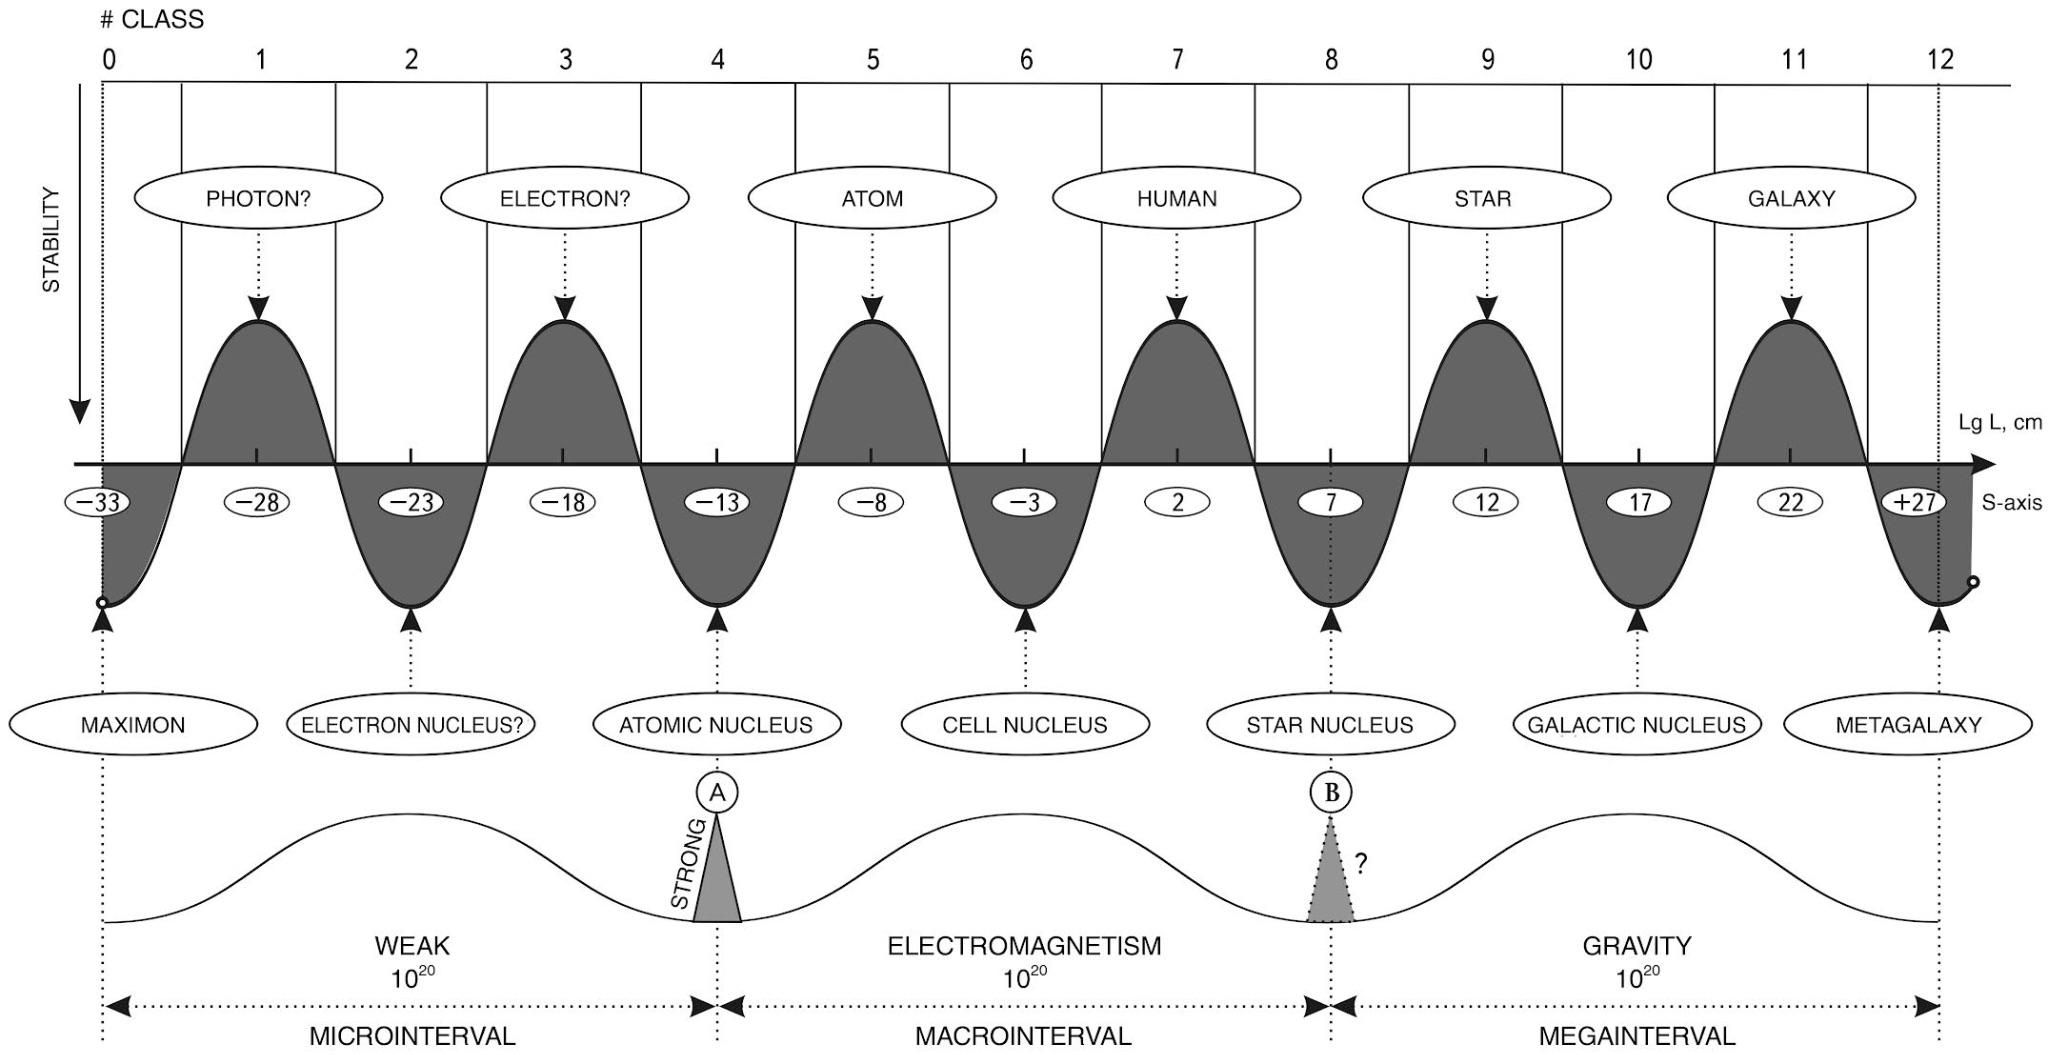 Fig.9. Scale periodicity with a step of 5 orders of magnitude can be represented as a “scale wave” with a period of 10 orders of magnitude. At the top are objects and structures at the bottom are their nuclei.
Another undoubtedly valuable discovery was the undeniable fact that the average size of a living cell of 50 microns is exactly at the proportional center of the Universe, which moves biological life from a planetary, terrestrial phenomenon to a universal one. A living cell is as many times larger than a maximon as it is smaller than the Metagalaxy (Fig. 10).
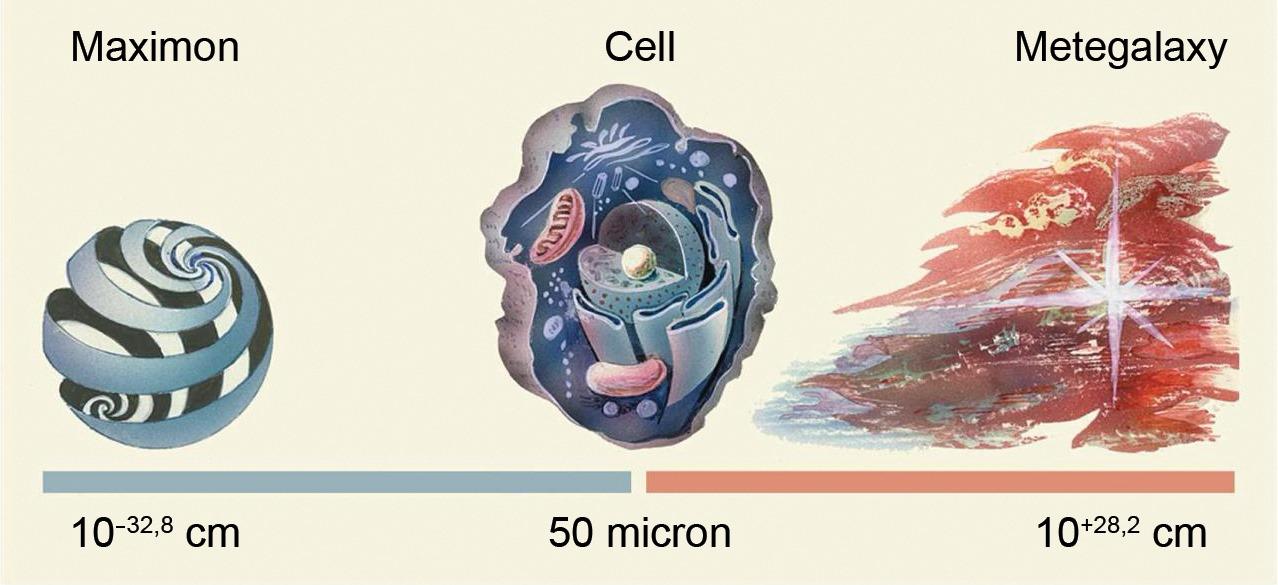 Fig. 10. A living cell is as many times larger than the smallest particle in the Universe, the maximon, as it
Is smaller than the entire Metagalaxy.
The new regularities of nature when considering the properties of the Universe along its S-axis are not exhausted by the periodicity and the central position of the living cell on the S-interval of our Universe.
In the 60s, of the twentieth century, Soviet academician M.A. Markov put forward a beautiful theory according to which our space consists of fundamental particles with sizes \(10^{-13}\) cm, which he named maximon in honor of Max Planck. Physicists accepted this theory, and since then these fundamental particles - maximon - appear in all reference books.
M.A. Markov went further and based on GR proved that inside such particles there can be a whole Universe with its galaxies and possibly inhabitants, and our Universe, having sizes \(10^{28}\) cm, can be one of the fundamental particles of the higher world Meta-Universe.
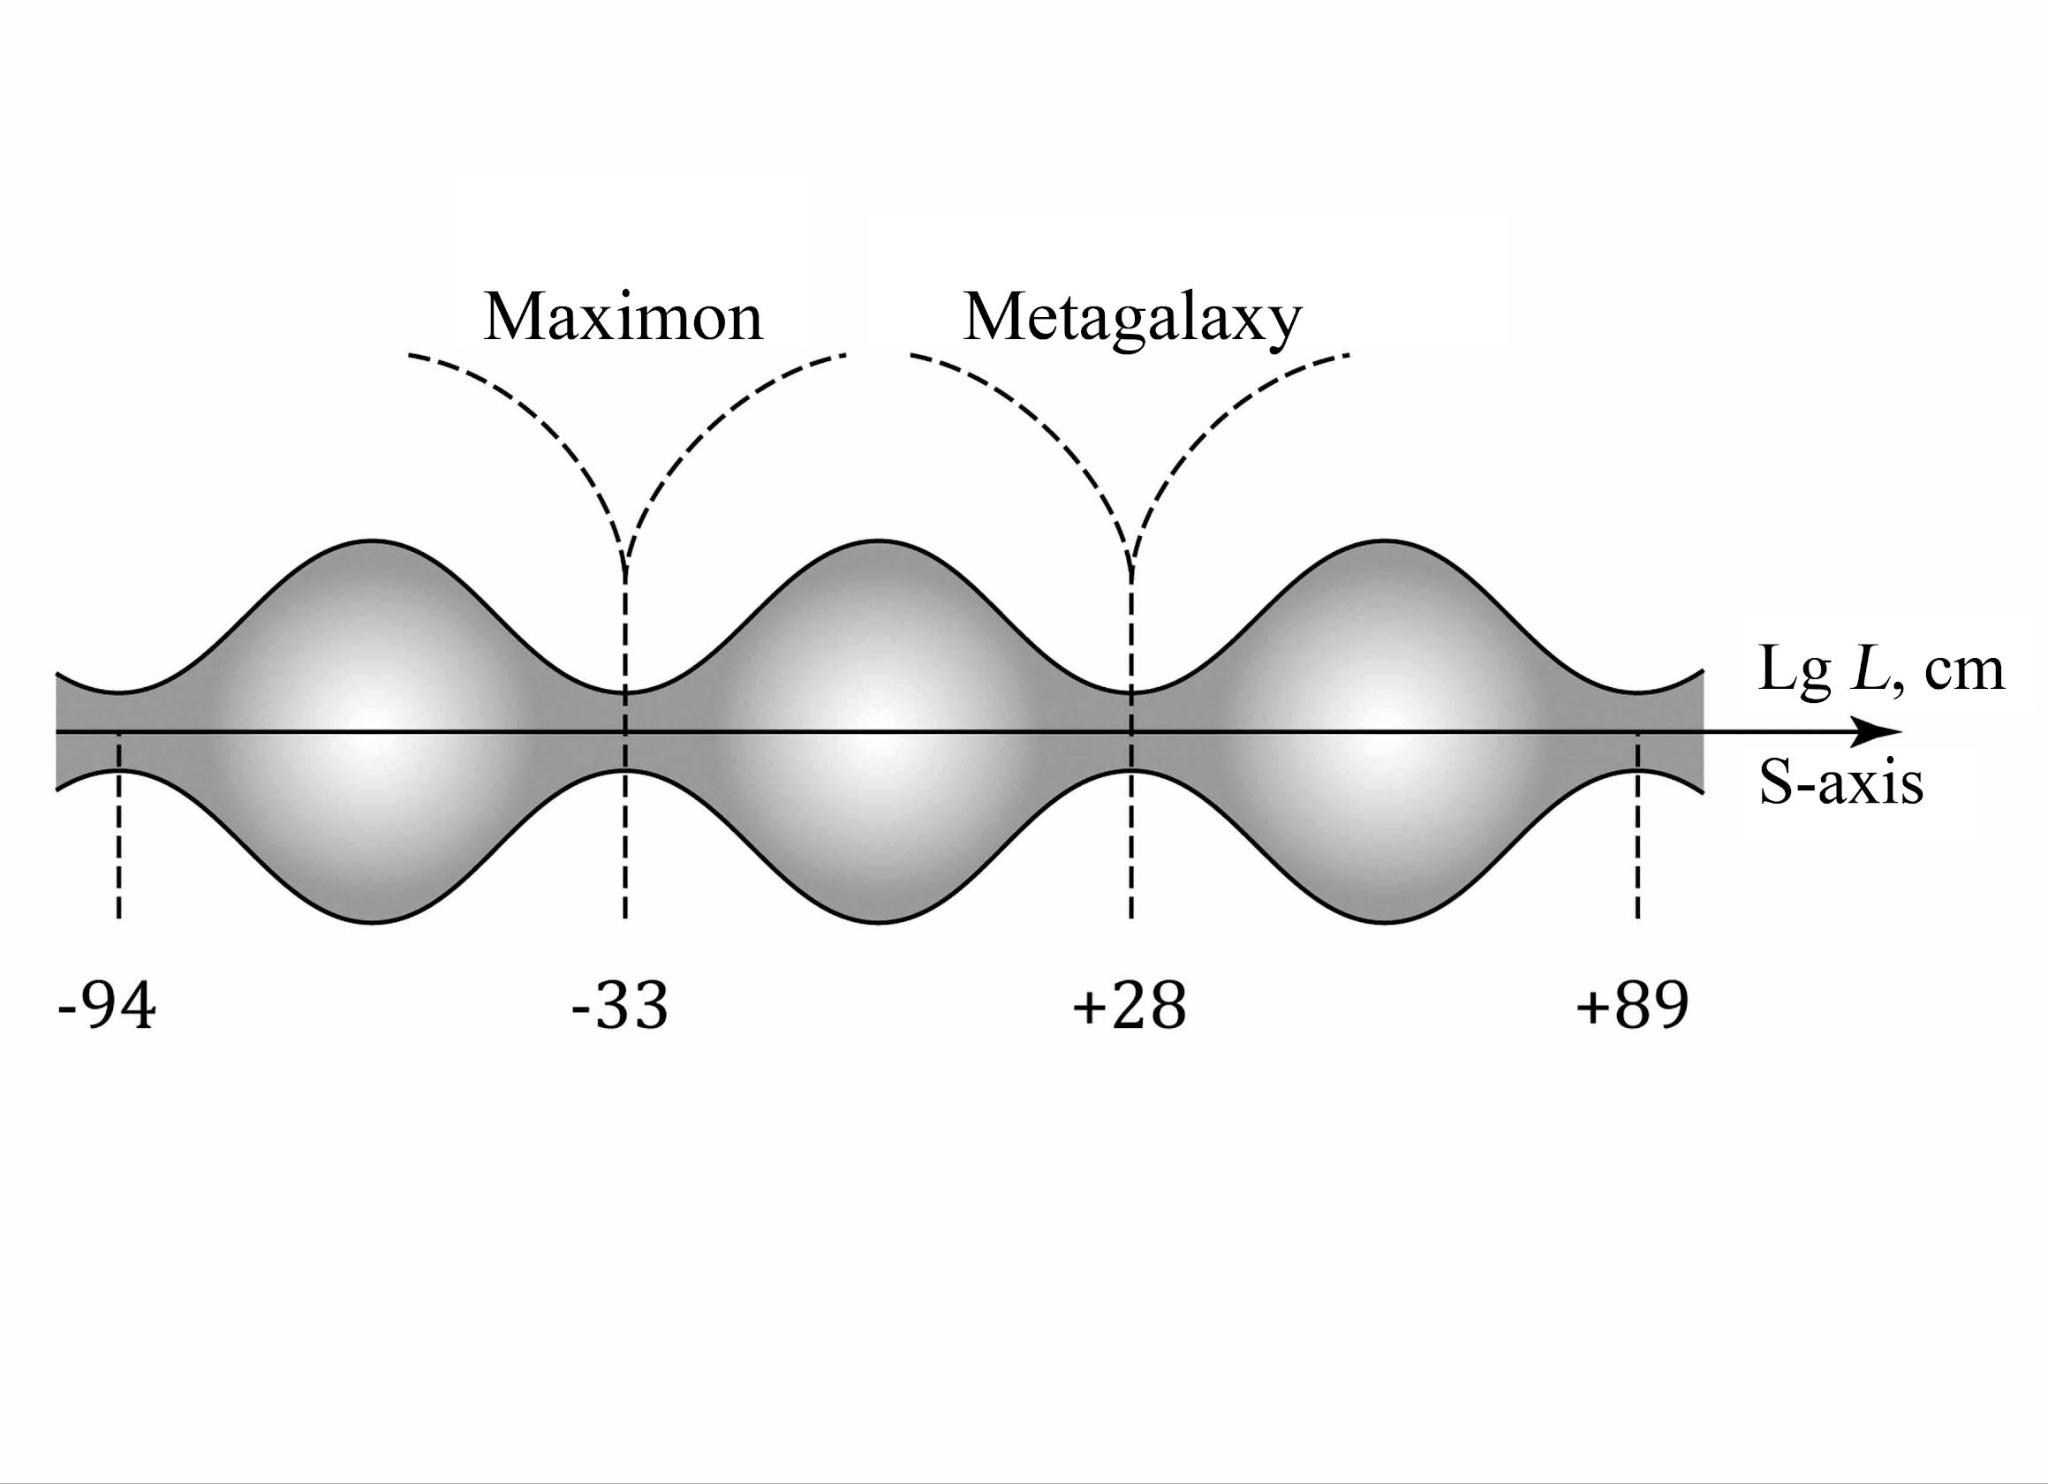 Fig. 11. The scale-cyclic model of the world according to M.A. Markov. According to this model, our Universe is just one link in a long (possibly infinite) scale chain of universes.
Since maximons can be lower-level universes, this makes the large Universe globally fractal at the level of “ordinary” universes. Moreover, it seems that our Universe can be self-similar and fractal within its size range as well (Fig. 12)
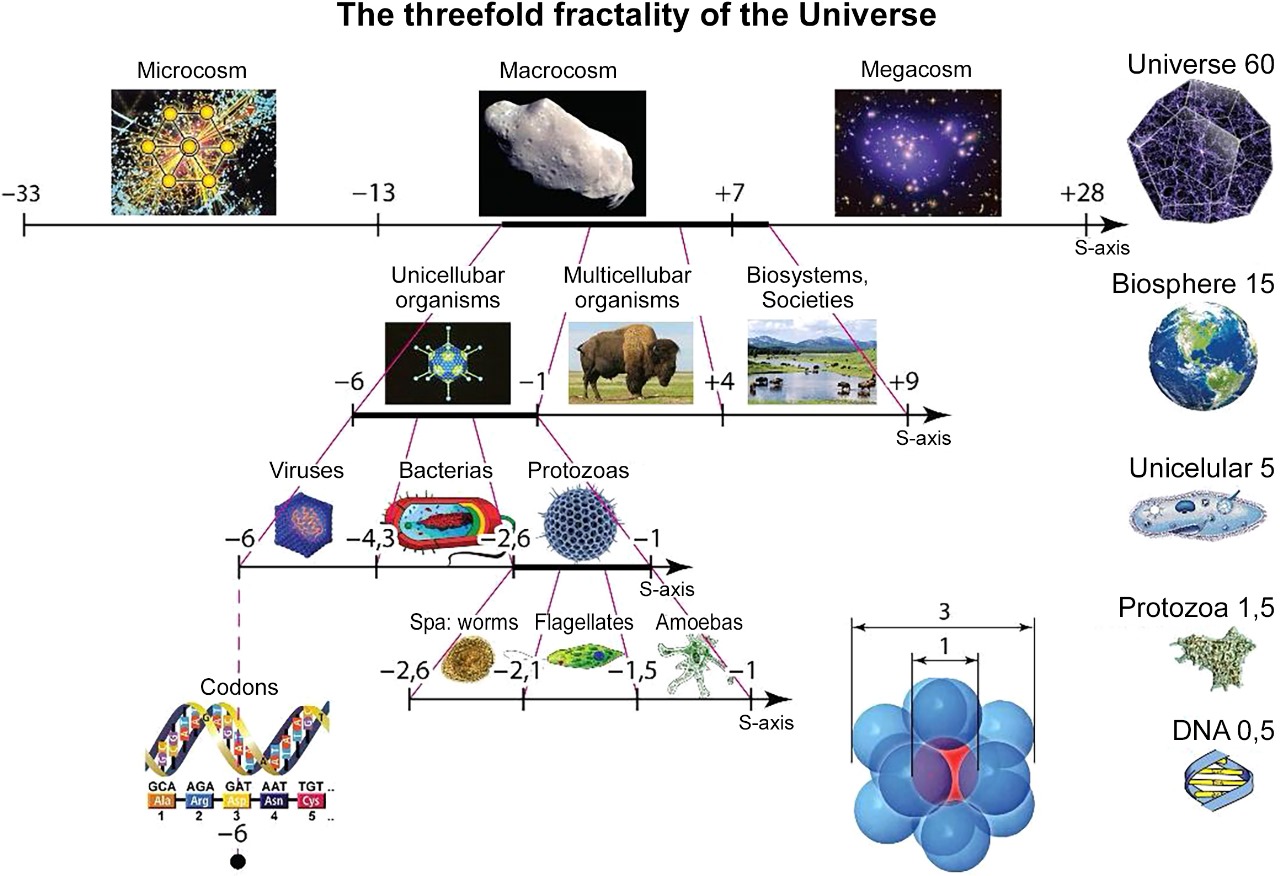 Fig. 12. Self-similar “fractality” of the structures of our Universe
So, if we stay within the dimensional limits of “our Universe,” then on the logarithmic axis it extends from -33 (Maximons) to +28 (Metagalaxy) by 61 orders of magnitude. And all these layers deep into matter and upward (into the heavens) were discovered and studied very quickly in a record time period from the late 19th century to the 1930s, when the true size of the Metagalaxy became clear.
Studies of the distribution of masses, symmetry, characteristic times, and other properties of objects along the axis of logarithms (S-axis) of the sizes of our Universe from the maximon to the Metagalaxy have shown that this size interval of 61 orders of magnitude is not just a mathematical abstraction, adopted for convenience of arrangement on one graph of all objects of the Universe, but a separate physical and spatial dimension of the Universe (the book is just devoted to the proof of this statement). And the author came to the conclusion that he discovered a previously unknown to science dimension of the Universe, which can be considered truly the fourth (then time can be conventionally considered the fifth dimension). In order not to be confused with time, the author decided to call it a “scale dimension”, although this term has a somewhat different meaning in the traditional sense. Here a dilemma arose. Either to come up with a completely different term for the new regularity of the Universe (this was the path followed by physicists, who called parts of the proton quarks - a fantastic term that had no scientific meaning before) or to tie this phenomenon to the closest concept to it. The author chose the second. And although the concept of scale (or Large-scale) traditionally carries a different semantic load - not physical, but mathematical, the author still settled on this option. And to avoid unnecessary mathematical associations in the future, the reader used a terminological technique, which at the same time left the connection to scale but carried some specific novelty. The author suggests that all properties of the new dimension, such as symmetry, periodicity, harmony, order, etc., should be accompanied by the prefix S-… For example, S-symmetry, S-axis, S-harmony…..
But moreover, some data on characteristic times (they are given in the book) suggest that the regularity discovered by the author has a wider character than just an additional spatial dimension. The S-dimension is most likely the main dimension of the Universe, which reflects the properties of both space (sizes and shapes) and time (periods and duration of existence). Thus S-dimension, from the author’s point of view, is complex, synergetic, and its projections on statics, dynamics, etc, various forms of matter are perceived by us as spatial and temporal dimensions.
In conclusion, we would like to note that this study is aimed primarily at expanding the worldview horizons of our existence. Practical results of studying S-dimension should be expected only later; they will come as this new parameter for mankind is mastered. To such consequences the author considers, among other things, mastering of etheric energy, the problems of mastering of which lie, in the author’s opinion, in misunderstanding of the connection between the structure of the maximon medium (matter) and material formations(from nucleons to stars).
What is philosophically very important about the fact that we are exploring the S-dimension with the thoroughness that modern science is capable of First of all, it is to rethink the place in the Universe of man and all biological life.
Above we mentioned the medieval worldview in which man, according to biblical texts, was at the center of the universe. After the Middle Ages, as our knowledge of the cosmic spaces expanded, science practically “threw” man from his privileged position to the periphery of the Universe, which gave rise to a global worldview of despondency.
However, immersion in the laws of the Universe related to the S-dimension paradoxically leads us to the opposite high state of mind and thought. Analyzing the structure of the S-dimension and the place of life in it leads us to a fundamental conclusion - we are not accidental in the Universe; we live all its life and every second perceive information and impulses to development from it.
The discovery of a new dimension of the Universe has led to the conclusion that life in its main form - in the form of a cell - is exactly in the focus of all information processes of the Universe. Let us remember that we all start from this very point on the S-axis, from a fertilized sex cell - zygote. Moreover, further calculations have shown that besides zygote exactly in the center of the S-space of the Universe, there is another much more interesting formation - the world memory grain (WMG), so that the zygote is just an “operational genetic memory” of a more fundamental phenomenon of the Universe, figuratively speaking - the tip of the iceberg of the world spirit grain, the world atman (Fig. 13).
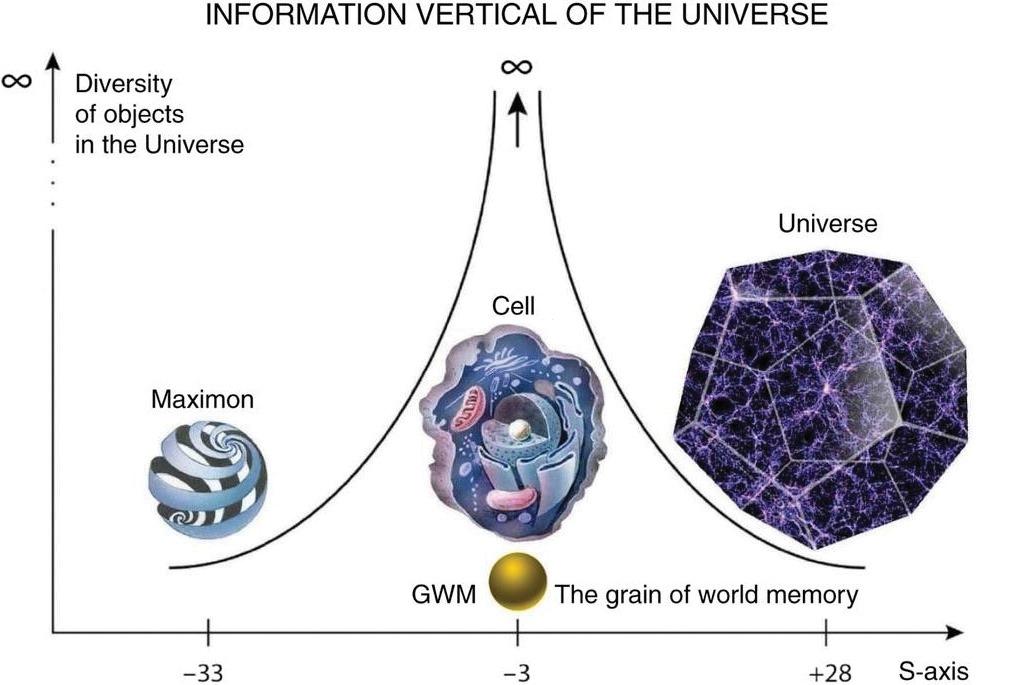
Fig. 13. In the large-scale center of the Universe there is not only a living cell, but also a “grain of the world memory”, which has an almost infinite memory that allows a person incarnating anew each time to use all the experience accumulated in previous incarnations
And man himself with his average height of 162 cm (+2 on the S-axis) in the S-dimension of life on the planet is exactly in its S-center (Fig. 14).
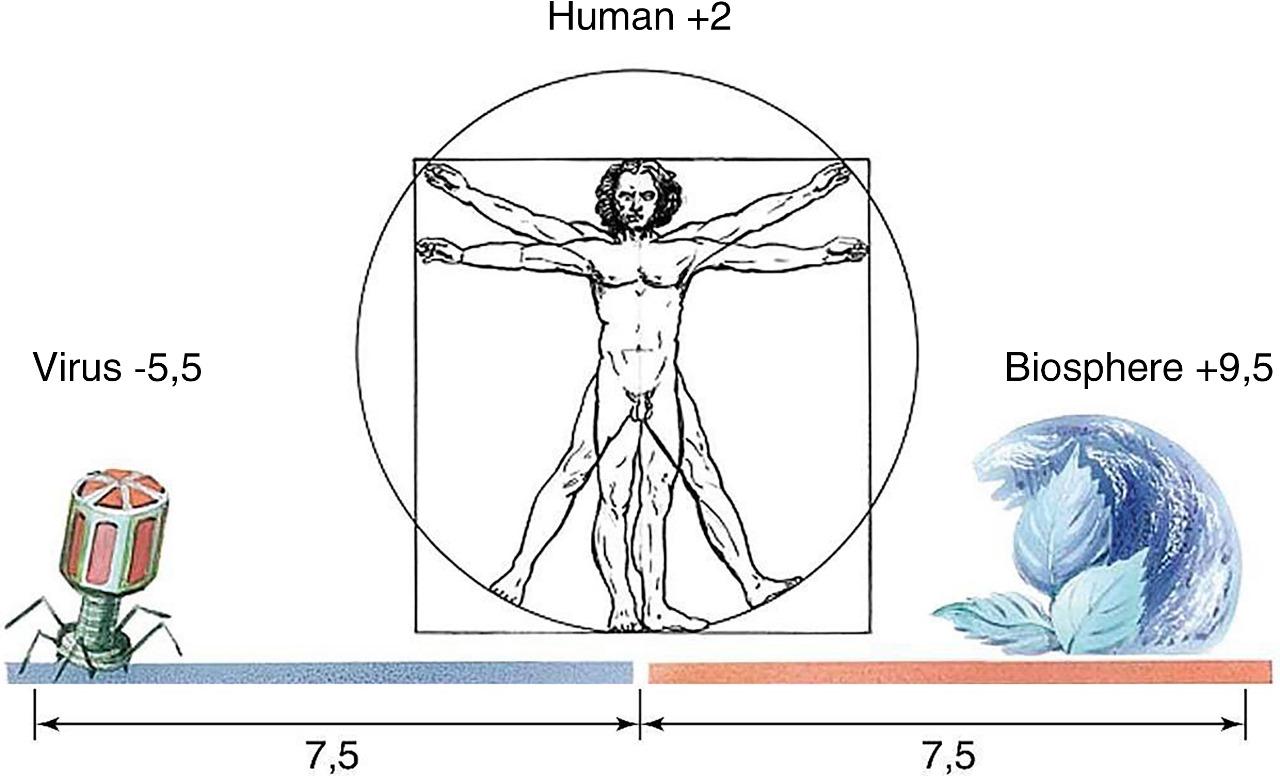
Fig. 14. Man is as many times larger than the smallest particle of life - a virus - as he is smaller than the entire Biosphere.
These results, obtained as a result of accurate mathematical calculations, complement religious and esoteric views about the place of life and man in it in the Universe. It becomes quite obvious that science, which is extremely cautious about such religious and esoteric views, thanks to the discovery and study of the properties of a dimension new for mankind (but basic for the Universe) comes to the same conclusions about the place of man in our world.
List of new terms and abbreviations
S - Harmony of the Universe - SHU
S - Analogy
S - Axis
S - Axis Dimensionless Constant - SADC
S - Basic Coefficient of Symmetry - SBCS
S - Biological Scale Diapason - SBSD
S - Evolution
S - Evolutionary Coefficient of Symmetry - SECS
S - Band of the Universe
S - Dynamics
S - Force
S - Frequency
S - Global Loop of the Universe - SGLU
S - Global Trough - SGT
S - Harmonic
S - Interaction
S - Interval of the Universe - SIU
S - Loop
S - Order
S - Order of the Universe
S - Resonance
S - Range - SR
S - Hierarchy
S - Hierarchy of the Universe
S - Pendulum
S - Overtone
S - Structure
S - Structure of the Universe
S - Space
S - Similarity
S - Similarity of the Universe
S - Symmetry
S - Symmetry Coefficient - SSC
S - Symmetry Evolutionary Coefficient - SSEC
S - Dynamics
S - Dynamics of the Universe
S - Trough
S - Trough of Potential stability - STPS
S - Vector
S - Vibrations in the Universe - SVU
S - Center
S - Center of the Universe - SCU
S - Stability
S - Wave of stability - SWS
S - Standing Wave of the Universe - SSWU
S - Universal Force - SUF
S - Basic Wave of stability - SBWS
S - Evolutional Wave of stability - SEWS
Model of the Pulsating Universe with a Bounce
Electron Scale Range - ESR
Proton Scale Range - PSR
Grain of World Memory - GWM
Grain of World Spirit - GWS
Theoretical Universal Human Height - TUHH
Wave of stability – WS
Methodological introduction
There is nothing to distinguish one part of space from another except its relation to the place of material bodies. We cannot describe the time of an event except by reference to some other event, or the place of a body except by reference to some other body. All our knowledge both of time and place is essentially relative.
J.C. Maxwell
One can philosophize endlessly about the integrity of the Universe, about the interconnection of all its elements, about man as a microcosm and many similar topics. At the same time, philosophy does not need a numerical measure, while science cannot do without it.
As soon as we ask ourselves a scientific question about the interconnection and integrity of the electron and the Galaxy, the human being and the star, the atom and the Universe, we will immediately have to determine the metrics of space in which we will search for this integrity. Immediately, we will face a certain obstacle. The point is that the scales of the microcosm and macrocosm differ by tens of orders of magnitude, and the scales of the macrocosm differ from those of the megamir by the same amount. How can we compare the life of a tiny electron and a giant Galaxy?
In everyday life, we deal most often with absolute comparisons. For example, we note that Ivan Ivanovich is 10 centimeters taller than Peter Petrovich, but his salary is 200 rubles lower.
However, once we go beyond single-type objects, we are forced to switch to a system of relative comparisons.
Take, for example, this statement: object A is larger than object B by 2.7 meters.
Does this statement tell us anything about the mutual difference of these objects if we don’t know what we are talking about? If we are comparing two trees, yes. If we compare two asteroids whose diameters are measured in kilometers, then the difference of 2.7 meters is lost in measurement errors. The same difference becomes absolutely insignificant and meaningless if it refers to two galaxies.
Meanwhile, this example was taken from Krylov’s fable about the elephant and the moss. The difference of 2.7 meters in this case is huge, because the three-meter height of the elephant is ten times greater than the thirty centimeter height of the moss.
This simple example shows that when we need to compare objects from the micro-, macro- and megaworld, we cannot do without a relative system of comparisons. The transition from absolute to relative system of comparisons can be likened to the transition from horizontal to vertical.
There is one more small detail that is not unreasonable to remind those readers who are not engaged in scientific work related to precise measurements. The fact is that if the size of an atom is 100,000 times smaller than the size of a living cell, and the cell is 100,000 times smaller than the size of a human being, this record still looks convenient. However, what about comparing the size of a proton to the size of the Galaxy? The proton is 100 000 000 000 000 000 000 000 000 000 000 000 times smaller.
Here, math offers a simplification. The above number can be written as \(10^{35}\) , where the degree of ten indicates the number of zeros.
To make life even simpler, mathematics switches from degree expressions to logarithmic expressions. Then the above-mentioned number \(10^{35}\) converted through the decimal logarithm to the number 35:
\[\log(10^{35})=35\]
Yes, instead of complex counting of zeros or ascending to a degree, we immediately move into the realm of two simple arithmetic operations: addition and subtraction. For example, if we want to know how many times smaller than a star a man is, we must subtract from the decimal logarithm of the average diameter of a star \(\log(10^{12})=12\) the decimal logarithm of the average size of a man \(\log(10^{2})=2\):
\[12-2=10\]
This means that a star is about \(10^{10}\) times larger than a human being. If you want to get a more “complete” impression of this comparison, you can write it down in expanded form: A STAR IS 10,000,000,000,000,000 TIMES LARGER THAN A HUMAN BEING.
In this paper, we will often use the logarithmic scale, because it greatly simplifies comparisons of micro-, macro- and megaworld parameters. Sometimes, keeping in mind the traditional forms of presentation, we will also use degree expressions. Sometimes we will decipher them for clarity.
So, for example,
\[10^2\ cm=1\ meter\]
\[10^{-3}\ cm=10\ microns\]
\[10^{-8}\ cm = 1\ angstrom\]
\[3\times10^{-18}\ cm = 1\ parsec\]
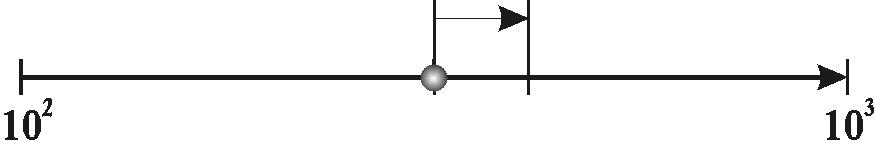
And one more methodological remark. The point is that the logarithmic scale, unlike the arithmetic scale, does not have quite the usual metric between unit divisions. Well, for example, if we want to show that object A is 3.16 times larger than object B, the size of which is equal to one meter, then on the arithmetic scale we will put off to the right a little more than three divisions, but on the logarithmic scale we will put off exactly five divisions. Thus, on the logarithmic scale, the transition from the dimensions of object B to the dimensions of object A will correspond to half of the distance from one to ten, which in the usual metric we associate with the number five. What is the point here?
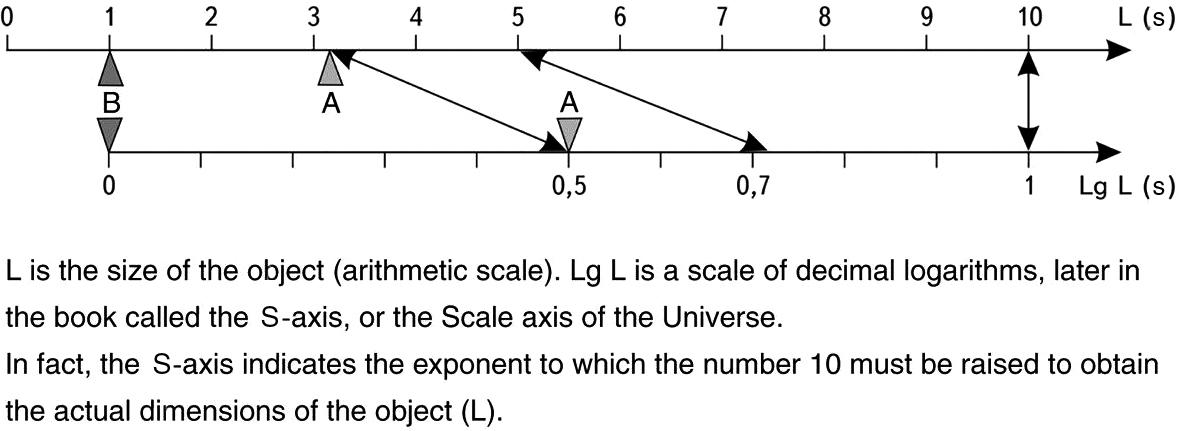
The point is that in the relative system of measures, the size of object A really lies exactly halfway between one meter and ten meters. In fact, if we multiply it again by 3.16, we get already object C, with dimensions of ten meters:
\[1\ meter\times3.16\times3.16 = 10\ meters\]
Therefore, the procedure of increasing by a factor of 3.16 is equivalent to a shift between divisions on the logarithmic (base 10) axis by 0.5 divisions.
It will be necessary to keep this feature in mind when we consider the fine structure of the scale order and translate objects close in size into logarithmic calculus. In this case, seemingly numerical discrepancies will often arise.
So, for example, a value of 31.6 microns would be converted to a logarithmic value as follows:
\[31.6 µm = 3.16\times10^{-3} cm = 10^{-2.5} cm\]
and the average human height is 1.6 meters:
\[1.6 m = 1.6\times10^2\ cm = 10^{2.2}\ cm\]
It should be remembered that all these and similar transformations do not change anything in essence, they are only different ways of expressing the same values. The values will be applied in one form or another solely out of convenience. In the process of reading this work, the reader is left to either believe that the author has repeatedly checked his calculations, or to remember this simple section of mathematics and check whatever he wants with a simple calculator that has a decimal logarithm function.
I would like to assure the reader, who will have to remember the seemingly so boring section of mathematics as the translation of ordinary numerical values into a logarithmic scale, that this translation makes it possible to compare very distant objects and their scales with each other. Thanks to this, the absolutely marvelous world of scale similarity of the Universe, in which we live, but which we pass by every day, opens before us. Therefore, it is safe to say that the reader’s labor to overcome mathematical difficulties will not be spent in vain.
Introduction
Behind me lie myriads of infusoria,
Before me, myriads of stars unfold.
I stretch between them, lying bold—
A sea that binds two shores in euphoria,
A bridge where two cosmoses are consoled.

Arseny Tarkovsky
Truly the central question of any worldview is the question of THE PLACE OF HUMANITY AND LIFE IN THE WHOLE UNIVERSE.
At all times, mankind has been searching for an answer to this question in different epochs, in different cultures, and in different traditions. It has found different answers involving art, religion, philosophy, and science.
We live in an era of scientific and technological progress, and whether one likes it or not, the answer to this question is primarily given by science, even if this answer contradicts religious and philosophical traditions. If up to Nicolaus Copernicus, science considered the human world as the central area of the Universe, and central not only in the geometric, but also in the physical sense, then after Copernicus, Bruno, Kepler, and Galileo’s view on this question underwent a radical, revolutionary change.
Let’s go back to the Middle Ages. People of that time believed that their world was the surface of a flat Earth floating on whales in the World Ocean and covered by a starry dome. Let’s not ironize the physical ridiculousness of such a model of the world, let’s pay attention to another thing - to the way the man of that time perceived himself in the Universe. And he perceived his world as the CENTER of the universe. After all, the planets and stars revolved around this world, even the bright Sun rose above the horizon and went beyond it in a circle, in the center of which (in any point of the Earth) there was always an observer. And the whole cosmos “was at the service” of man: the Sun illuminated and warmed the Earth, at night the Moon shone in the darkness, the stars told the way to the navigator, the planets - the fate of the ruler, and comets warned of the coming cataclysms. Indeed, “everything is for the good of man, everything is for his sake”.
Of course, most people believed that such a wonderful, cozy, reasonable and comfortable world order arose thanks to the Creator, who created this world for man. Therefore, when speaking only of the material world of the Universe, there were no doubts for many centuries: humanity was always considered to be at the center of the physical universe. Geometry, physics, and the entire connection between cosmic events and earthly ones all confirmed this belief to ancient people.
Moreover, the cosmos has always been commensurate to man in scale, for the stars fell to the Earth - this was a visible and undeniable fact. The moon was represented as a big piece of cheese, planets rotated in the sky with the help of mechanical gears and solid spheres. The sun in ancient Egypt floated on the celestial Nile on a boat, and in fairy tales of ancient peoples, it could be swallowed by a bird, crocodile, etc.
Therefore, it did not even occur to ancient man that the cosmos is a vast empty expanse. That any star is millions of times larger than the Earth, that nothing but the Moon actually revolves around the Earth 1.
If we now look at Copernicus’ theory from this angle, it will appear that the main thing in it was not a change in the physical principle of the rotation of the planets and luminaries, but that it completely destroyed the idea of the central position of the human world in the universe. Thus, it broke the core of the ancient worldview. (It is not without reason that the Church actively fought against Copernicus’ teachings for centuries.)
However, it was impossible to stop the development of science. After all, it was the change in the physical picture of the Universe that opened the door for mankind to a new physics, which after a while brought thermodynamics (steam engines), electrodynamics (electricity), aerodynamics (airplanes), and everything that makes up the practical basis of most people’s lives today.
And now, when it is unthinkable to refuse the benefits of modern science, it has become impossible not to consider the picture of the universe drawn by it, and it is so.
Somewhere off to the side of the center of the solar system revolves the small planet Earth. The inhabitants of this planet already know that their central luminary is just one of the outlying stars, of which there are tens of billions in the galactic archipelago. After Hubble’s discovery of other galaxies, it turned out that our galaxy is also just a small part of a huge world with about ten billion other galaxies.
There were, however, still esoteric traditions, in which the world was drawn differently, but their hermeticism did not have any noticeable influence on the mass consciousness.
What is our Earth on this canvas? A speck of dust, or even a molecule? The human world shrinks to quite microscopic scales and is lost on the outskirts of the margins. Moreover, the geometric insignificance is complemented by a physical abyss - because beyond our world is dominated by the icy expanses of hostile and almost empty space, which is permeated with radiation destroying all living things.
Why do we care about these empty spaces, hostile to all living things? Why should we think about them? After all, our planet is an insignificant trifle for the gigantic cosmos, where energies that destroy whole galaxies are raging.
And what can man change in this world? Is it possible from the thin top film of our planet, a man can change things?
It turns out that man is on his own, the Universe is on its own, the connection of events in these two worlds is impossible due to the difference of scales and gigantic distances. It seems absurd and ridiculous to talk about the return of the idea of the central position of man in the Universe from the scientific point of view.
Modern science paints a depressing and (I would say) tragic picture of the universe. It is not without reason that Academician Vladimir Ivanovich Vernadsky in one of his article, “The Study of the Phenomena of Life and the New Physics,” (1931) expressed his concern about the nature of the development of modern natural science: “Increasing the world to extraordinary proportions, the new scientific outlook at the same time relegated man with all his interests and achievements - relegated all the phenomena of life - to the position of an insignificant detail in the Cosmos.” 2
An insignificant detail… We hardly fully realize how much this picture of the world penetrates every pore of our consciousness, down to the personal and deepest tragedies of individuals who cannot find meaning in an animal and short-lived stay on the surface of a microatom of the vast world.
This picture can only inspire horror and fear to anyone who seriously tries to imagine the place of life in this gigantic world - it leaves behind universal gloom and longing. It is not without reason that the famous cosmologist Paul Davies wrote “mankind has never fully recovered from the intellectual shock of losing the privileges of the Earth.”3
Isn’t it terrible that mankind will never be able to forget about these endless empty spaces, never any observations will return us to such a cozy and homely picture of the Universe of the Middle Ages.
We will never be able to forget our own minuscule scale in this vast world. In our spatial periphery, a rocket will take thousands of years to reach the nearest star. The Copernican hypothesis has become a fact of our time, and there is no way to erase this fact.
…And now, when it seems that there is no way out of this worldview deadlock, that the accumulation of facts about distant galaxies and about the depths of the cosmos increasingly humiliates man, makes him a more and more insignificant element of the Universe. At this moment, suddenly, through the chaos of accumulated information, there appears a glimmer of the most beautiful picture of the world, in which man occupies not an accidental, but the CENTRAL POSITION.
However, this position is central not in the usual and habitual three-dimensional space, but in the hierarchical world order. We can call it a MASSIVE SPACE. To understand how important for all of us this objective scientific fact - the central position of life in the large-scale space - is, we must first show that this space plays a dominant role in the Universe and that events occurring, according to the laws of three-dimensional space, are only a consequence of causes that originate in this dimension unknown to us so far.
-
To be more precise, such an idea came from time to time, for example, to Aristarchus of Samos in the second century BC. However, such an idea was perceived as wild, absurd and contrary to the totality of observations and practice. ↩
-
Vernadsky V. I. Problems of biogeochemistry / V. I. Vernadsky // Proc. I. Problems of biogeochemistry / V. I. Vernadsky // Proc. of the Biogeochemical Laboratory. Biogeochemical Laboratory. - 1980. - VOL. XV1., 247. ↩
-
Davis P. Space and Time in the Modern Picture of the Universe. M.: Mir, 1979. p. 32. ↩
The S-order of the universe
More than 100 years ago, M. Planck in his report at the meeting of the German Academy of Sciences first proposed the so-called Planck quantities [^note-1], in particular the Planck length, which has since become famous:
$$ l_p = \sqrt{\hbar \cdot G / c^3} \approx 10^{-33}\text{cm} \tag{1.1}\label{eq1} $$ where \(\hbar\) is Planck’s constant, \(G\) is the gravitational constant, \(c\) is the speed of light.
This size is a certain maximum permissible minimum size on the scale the laws of physics known to us are still valid. Penetration into the structure of matter deeper is either impossible at all, or requires the creation of new physics, or will lead to getting into another universe similar to ours (see, for example, the work of Moisey Alexandrovich Markov2.). In any of these variants, the Planck length is the fundamental lower boundary of our world.
On the megascale side, the penetration of astronomy into more and more remote corners of the Universe has led to the fact that it was possible to see the boundaries of the Metagalaxy at distances of the order of \(10^{28}\ cm\). True, in the theoretical model of the Big Bang, the distant boundaries of our Universe are an order of magnitude farther away - about \(10^{28}\ cm\). So, in the twentieth century science has managed to push the large-scale boundaries of our world by many orders of magnitude.
In doing so, it turns out that our world is limited in scope. If there are any boundaries, it is certainly extremely curious to know what is in the center between them? What is equidistant from one scale edge of the Universe as well as from the other? In other words, where is the scaled THE CENTER OF THE UNIVERSE?
It should be remembered that the traditional idea of the middle of the world cannot be used here, because we are not talking about the usual spatial cube, in which diagonals intersect in the center. The question is posed in a different way. To find the middle between scale boundaries means to choose objects of “median scale,”. i.e. such objects that would be so many times larger than the fundamental length, how many times smaller they are than the Universe itself.
At first glance, there is no physical sense in this search, because there can be a great number of objects with such sizes in the Universe. However, let us forgive our idle curiosity and still determine which objects in the Universe are in the scale center of its hierarchical structure. It is very easy to find the scale center. For this purpose, it is enough to construct a logarithmic axis of the sizes of the Universe objects (in principle, it is indifferent what logarithm base we will take, though for calculations it is more convenient to take the base ten), to postpone on it the boundaries of the Universe in microcosm and megamir and to divide the obtained segment in half (see Fig. 1.1). The point in the center of this segment has a value of \(10^{-2.3}cm\) or \(5\times10^{-3}cm\), i.e. about fifty microns.
Fig. 1.1. Scale interval of the sizes of the Universe objects (from the fundamental length of M. Planck - \(10^{-32.8}\ cm\) to the visible boundary of the Metagalaxy - \(10^{28.2}\ cm\)) located on the scale axis (S-axis) and its the Scale Center of Universe (SCU)
The obtained value, firstly, pleases with its accessibility (such objects can be seen in an ordinary microscope), and secondly, surprises with its accuracy. After all, the boundaries are God knows where! One - beyond the capabilities of telescopes, another - at the very bottom of the microcosm, and here - 50 microns. Already 5 or 150 microns is far enough from this point.
Therefore, it is interesting to determine what objects common in natural nature have sizes of this order. In inanimate nature, it is the size of dust particles and grains in minerals, i.e., seemingly nothing special. In animate nature, in this selected central place of the whole scale interval of our world there is a biological cell in its geometric mean size (see Fig. 1.2). It is important to note that this geometric mean size is applicable to all kinds of nuclear cells: unicellular, plant and animal. Moreover, the germ cells of most living beings, regardless of their size, have approximately such dimensions. For example, the cell of a fox, a field mouse, a mosquito, an elephant and… a human cell after its fertilization, each of us starts our way into this visible world from the large-scale center of the Universe!
Fig. 1.2. Scale boundaries of our Universe are such that exactly in the center of the scale interval there is a living cell, which is so many times larger than the smallest particle of the Universe - the maximon, how many times smaller it is than its upper boundary - the Metagalaxy
So, using only the well-known data of astrophysics, we get a completely unexpected and intriguing result: In the SCALE CENTER OF THE UNIVERSE (SCU) there is a LIVING CELL - the FOUNDATION of ALL LIFE ON EARTH.
Taking into account the gigantic scale interval of the Universe - sixty one orders of magnitude, there is no reason to consider this scientific fact as a consequence of blind chance. Keeping in mind that we inherit the overwhelming majority of information about our organism, our character, appearance and, most likely, our destiny, we can confidently assert that a genetic person “passes” from generation to generation through a “narrow neck” of a large-scale channel with a “cross-section” of about fifty microns. At the same time, our hereditary “I” stored in each cell is always located exactly in the scale center of the Universe!
So, the central size of the scale range of our world belongs to the living cell, which is so many times larger than the fundamental length in how many times smaller it is than the Metagalaxy. This is hardly an accidental fact, but rather a KEY to the understanding of life in the Universe.
However, to make a final conclusion, we have to make a fascinating journey into the world of new patterns for science, to discover many previously unknown symmetries. We will have to make a long journey into the world of large-scale regularities. And in order not to succumb to the temptation of attributing reality to those regularities that do not exist in it, we will firmly adhere to a simple rule: to use only repeatedly verified scientific facts and data, to rely on such a factual basis, which is virtually no longer questioned in science. Let’s get back to the large-scale range. If we speak about reliable, verified by experiments and observations boundaries, then all our visible world (from proton to Metagalaxy*) is contained within the size range from \(10^{-13}\) to \(10^{27}\) cm, which is exactly FORTY ORDERS (13+27). If we take into account quite probable and most often recognized theoretical boundaries of the scale of our world, it is necessary to consider already 61 orders of magnitude (from \(10^{-33}\) to \(10^{28}\) cm - from the maximon to the Metagalaxy). But if we take into account the fact that over sixteen billion years the expansion of the Metagalaxy has continued, then beyond sixteen billion light years extends a region twice as large, which suggests the existence of invisible boundaries of the Metagalaxy of almost \(10^{29}\) cm.
* In experimental physics it was possible to penetrate only to the depth of \(10^{-17}\) cm, but the reliable boundaries of experimental study of our world are the scales of nucleons - \(10^{-13}\) cm (proton, neutron). Therefore, the author warns in advance that all conclusions, schemes, and models which in this paper refer to the range \(10^{-33}\)… \(10^{-17}\) cm are extrapolations.
In this case, the entire range on the S-axis must be increased to a value of 61.8 orders of magnitude. What lies beyond this interval is a purely theoretical question, and its study often leads to paradoxical conclusions (see, in particular, M. A. Markovs’s model of the “Micro-Macrosymmetric Universe”3). We set ourselves a different task: to see how the internal ladder of the Universe scale is organized, on the steps of which elementary particles, atoms, cells, animals, planets, stars, galaxies, and their all kinds of compounds and systems are located. To look with the purpose of finding out whether the large-scale order of the world order exists or does not exist. At first glance, this question is devoid of any scientific sense - so different systems are juxtaposed against each other. That is why only in popular scientific works sometimes there are pictures (see, for example, the book by B. A. Vorontsov-Velyaminov4), on which the scales of atoms, molecules, cities, solar system, galaxies, and other objects are compared. These pictures are intended to make the novice scientist realize that the range of sizes of objects studied by science is enormous, and partly for this reason each scale slice of our world requires a separate study. It is true that science once encountered a strange scale order, which is difficult to give any explanation, but which is also impossible to ignore. Back at the beginning of the century, Arthur Eddington and Paul Ehrenfest discovered a unique large-scale regularity: it turned out that a reasonable combination of various cosmological constants results in the same dimensionless number close to \(10^{40}\) or its multiple. This problem attracted the attention of all famous physicists, such as Einstein, Gamow, Dirac, and other scientists who dealt with the worldview problems of the Universe structure. It turned out that the obtained result did not follow from any theory, and many years of attempts to find an explanation for it showed that it could not be deduced from any known physical theory.
The problem is called the “BIG NUMBER PROBLEM”. It consists in the fact that there are mysterious numerical coincidences of some dimensionless numerical relations composed of atomic constants, the speed of light and the following cosmological constants: the age of the Universe tp , the radius of the Universe Rp , the average density of matter in the Universe ρp, and the gravitational constant G. It turned out that various meaningful combinations of these constants give surprisingly the same dimensionless value:
Strengths:
$$ \frac{\text{Coulomb (proton-electron)}}{\text{Gravitational (proton-electron)}} = \frac{{e^2}/{r^2}}{{{G}\cdot{M_p}\cdot{m_e}}/{r^2}} = \frac{e^2}{{G}\cdot{M_p}/{m_e}} = 0.2 \cdot 10^{40} \tag{1.2} $$
Lengths:
$$ \frac{\text{Radius of the Universe}}{\text{Classical electron radius}} = \frac{R}{\frac{e^2}{m_e c^2}} = 3 \cdot 10^{40} \tag{1.3} $$
Masses:
$$ \frac{\text{Mass of the observable universe}}{\text{Proton mass}} = \text{number of nucleons} = \frac{{\rho_p}\cdot{R^3}}{M_p} = \left(0.24 \cdot 10^{40} \right)^2 \tag{1.4} $$
At density:
$$ \rho_p = 7 \cdot 10^{-31}\text{g/cm}^3 \quad \text{(modern estimate)} $$
Time:
$$ \frac{\text{Age of the Universe}}{\text{Elementary unit of time}} = \frac{t_p}{{e^2}/{({m_e}\cdot{c^3})}} = \frac{10^{10}\text{years}}{10^{-23}\text{seconds}} = 3 \cdot 10^{40} \tag{1.5} $$
As we see, the scale interval of forty orders of magnitude, which stretched from the proton to the Metagalaxy, is peculiar not only to the ratio of sizes, but also to the ratio of masses, forces, and times. For some time these incomprehensible ratios remained the subject of a separate study. In the 1930s, they were paid close attention to by Paul Dirac, who realized that they are not accidental but show a deep connection between cosmology, gravitation, and electricity. He hypothesized that physical constants change with time, and formulated the following postulate - Dirac’s PRINCIPLE:
Any two very large (about \(10^{40}\)) dimensionless physical quantities are related by a simple mathematical relation in which the coefficients are quantities of the order of one.
Since the relation (1.5) also obeys this principle, which includes the age of the universe, then the question immediately arose:
-
this principle was always valid in the Universe, but then the cosmological and atomic constants must change taking into account the changing age;
-
this principle is fulfilled only in a small period of time of the Universe’s existence, and then we live in some special allocated moment of its development.
To test the first version, astrophysicists conducted theoretical studies aimed at finding the answer: are physical constants constant? A positive answer was obtained with very high precision6.
However, during the test another paradox was revealed: it turned out the most insignificant changes of physical constants lead to the fact that the whole Universe turns out to be completely different. This led to an obvious conclusion: all constants were “selected” in such a way as to produce a Universe in which life, including human life, may have appeared. An important consequence of this conclusion is that all the constants of our Universe have not random values, but are strictly linked to each other through an currently unknown astrophysics law of their harmonization.
Scientists’ discussion of these results has led to two opposing theories:
- THE HYPOTHESIS OF MULTIPLE UNIVERSES (in particular, it is developed by Brandon Carter7). According to this hypothesis, there is an almost infinite number of universes.
All of them are different, and physical constants in them take any value. Only in one of the universes, due to a coincidence of circumstances, the constants took such a value that life could arise.
- HYPOTHESIS OF GLOBAL UNITY OF ALL PARAMETERS OF THE UNIVERSE (in particular, it is developed by John Wheeler). According to this hypothesis, the Universe is one, but in it the global and local laws of evolution are pulled into one tight conceptual knot, which allows Wheeler to ask the following question8:
“AREN’T HUMANS INVOLVED IN DESIGNING THE UNIVERSE IN A MORE RADICAL WAY THAN WE’VE THOUGHT SO FAR?”
The problem of linking the physical constants of our world with the possibility of human existence has so excited the scientific world that the BIG NUMBERS PROBLEM, which actually gave rise to it, has fallen into the shadows and has been on the periphery of attention. It remained an unsolved phenomenon of nature and is only rarely mentioned in review cosmological works.
In the seventies, knowing absolutely nothing about this problem, I set myself a very bold worldview task: to determine whether there is any independent order of structure in the large-scale hierarchy of the Universe.
Since the order can be determined only on the basis of quantitative criteria, it was necessary to choose a parameter that would be universal and peculiar to all systems without exception. Time, mass, forces, size and other parameters were considered by me for their universality and availability. It turned out that the most complete information about all objects of the Universe without exception refers to their geometrical characteristics, and in the simplest form - to their sizes (wavelengths, etc).
First, all real objects without exception have dimensions, and it is this parameter that can be used to compare them with each other. This approach, by the way, agrees with the position of such physicists as J. Wheeler and Dmitri Blokhintsev, who believed that all physics can be reduced to geometry. In particular, D. Blokhintsev wrote: “…the laws of geometry are the most general and extend their power and significance to any events and phenomena in the world that we know.“9
Second, most of the most common objects of the Universe at all levels of its organization have very stable sizes. Therefore, the comparison of objects just by their sizes can lead to quite reliable and sustainable conclusions.
Third, all field processes can be estimated from their wavelengths.
Fourthly, if all objects and processes in the Universe are united by a common harmonic principle, then it is obliged to manifest itself through the distribution of objects by size and the distribution of field relations through wavelengths. If there is no harmony in the Universe, then chaos must reign in the arrangement of all objects on the scale.
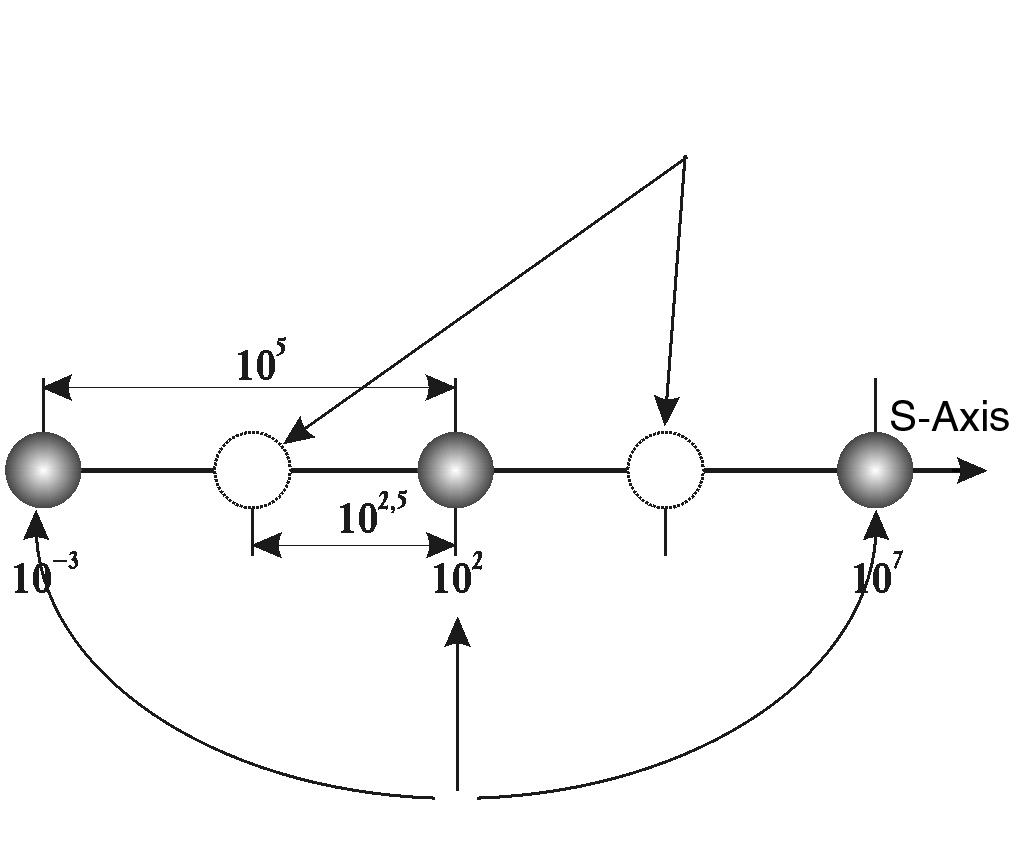
Using the most common reference data on the sizes of the objects of the Universe, I began to gradually place them on the scale of decimal logarithms (S-axis), and here a striking regularity appeared: it turned out that the most typical objects of the Universe occupy in their average sizes on the S-axis places strictly through \(10^{5}\). Moreover, many key system properties of the Universe objects (structural and dynamical) have similarity with coefficients \(10^{10}\), \(10^{15}\) and \(10^{20}\). These results were first reported at the First Conference on Classification Theory in Borok in 1979 and published in the popular science journal “Knowledge is Power10. Then two more publications 11, 12 followed, which summarized the main regularities of the discovered phenomenon. Let us now consider the revealed regularity in more detail.
Periodicity of the S-structure of the Universe
At present, the system with the largest size that is accessible to direct observational measurement is the Metagalaxy. Based on the age range of the Universe, according to the references found in the cosmological literature (10–25 billion years), we can accept with some inaccuracy the minimum size of the visible Metagalaxy as 1.6 x \(10^{28}\) cm or \(10^{28.2}\) cm.
From the other edge of the scale in our world, the minimum (determined experimentally) size has such a well-known system as the proton - 1.6 х \(10^{-13}\) cm or \(10^{-12.8}\) cm. However, since even in experiments it was possible to penetrate several orders of magnitude deeper, theorists have raised the question: is there any limit at all to the splitting of microparticles into their constituent parts? Quantum theory, relying on the totality of its knowledge, has deduced a certain theoretical limit of matter splitting into elements - this is the so-called fundamental length. Its properties are such that any smaller particles—if they exist—are no longer subject to the laws of our world, and cannot be described by modern physics. We will not go deep into this area of physical theory, since it has its own specificity. Let us only note that some hypothetical microparticles (they were called differently: maximon, plankeons, freedmons, etc.) can have exactly this fundamental size. The exact value of the fundamental size is determined from formula (1.1):
$$ l_p = \sqrt{\hbar \cdot \frac{G}{c^3}} \approx 1{,}6158 \cdot 10^{-33}\text{cm}, $$
or \(10^{-32{,}8}\text{cm}\).
The properties of these particles are such that under certain conditions a whole Universe similar to ours can be concentrated inside each particle (M. A. Markov assumed this based only on the known laws of physics). On the other hand, our Universe can be a maximon of the metauniverse of the next level (see Fig. 1.3).
Thus, if we stay within the framework of the world of phenomena we study, we can consider with a certain degree of convention that on the dimensional scale of decimal logarithms1 our visible world is enclosed in the range of 61 orders: from the Maximon to the Metagalaxy (32.8 + 28.2 = 61).
Fig. 1.3. Scale-cyclic model of the world according to M. A. Markov.
Our universe according to this model is just one link in a long (possibly infinite) scale chain of universes
Let us now see how the most well-known and widespread systems are located on this scale. As such, I have chosen the following series:
 0 - Maximons

      ...

      4 - protons, the nuclei of atoms,

           5 - hydrogen atoms,

                6 - living cells,

                     7 is a human being,

                          8 - the nuclei of stars,

                               9 - stars,

                                    10 - galactic nuclei,

                                         11 - galaxies,

                                              12 - Metagalaxy.
Let us justify the choice of such a series. First, 99% of the matter of the Universe is concentrated in stars13, which are almost all assembled into galaxies. Stars more than 70% by mass consist of hydrogen, the core of which is a proton. Taking into account the fact that hydrogen exceeds 90% of the content of other atoms by the number of elements of the Universe, and the proton is the longest-lived particle of the Universe (\(\sim 10^{56}\) years) - the choice of these objects at scale levels was determined by their overwhelming abundance. The choice of a cell and a human being is subjective only at first glance. Taking into account the fact that the whole science is the activity not of elephants and insects, but of man - the place of man in this row is at least of some interest. Accordingly, man, like all multicellular organisms, is composed of cells. Moreover, according to many biologists, the cell is the most important and representative biological system of the Biosphere.
It is known that the nuclei of atoms determine the basic properties of atoms themselves, although they are in 100 000 times smaller in size. However, not everyone knows that similarly in the megaworld it is the nuclei of stars and galaxies that determine their basic properties, and their sizes are about as many times smaller than the stars and galaxies themselves. That is why the nuclei of stars and the nuclei of galaxies are chosen to build the classification scheme.
The sizes of the proton and the hydrogen atom are known to science to within a tenth of a factor before the power of ten. The average human height has fluctuated in the history of human formation, but still within fairly narrow limits. The sizes of cells, nuclei of stars, nuclei of galaxies and galaxies themselves were determined by me as geometric averages by the same procedure. If, for example, it is known that stars do not occur less than \(10^{10}\) cm and more than \(10^{14}\) cm, then the average size of a star was defined as a point on the scale equidistant from these limits, i.e., \(10^{12}\) cm.
The author’s detailed studies of this question have shown that with an error of up to 10% (0.5 orders of magnitude on the scale of decimal logarithms) the selected series of systems (including the average sizes of stars, galaxies, etc.) occupy places on the S-axis alternating through 5 orders of magnitude 2 (or multiples thereof). The figure 1.4 shows the S-axis and the points where the selected objects are located on it.
This result shows that there is a strict order in the massive hierarchy of the Universe.
A DEFINED PERIODICITY that is not related to the kind of ruler (centimeters, meters, parsecs…) and is defined by a dimensionless relation that can be formulated very simply.
The average galaxy is as many times larger than the average galactic nucleus as the latter is larger than the average size of a star, which in turn is as many times larger than the average size of a star’s nucleus, etc,.
Fig. 1.4. Scale axis of the Universe (simplified model3) divided into 12 intervals of 5 orders each. A shift on the S-axis by one order to the left or right means a 10-fold change in size
Let us return to the problem of large numbers. We see that this unique regularity is only a fragment of the general regularity discovered by the author (see Fig. 1.4).
True, it may seem that the pattern of LARGE NUMBERS has a more general status, since it exhibits regularities in several parameters rather than in single dimensions. The author’s preliminary study, however, has shown that the discovered dimensionless periodicity with a prime factor of \(10^{5}\) is peculiar to all the main parameters of the Universe: times, masses, forces, etc. The fact that the main representatives of the MASHABLE classes 4 of systems are located on the S-axis strictly periodically, with a period that does not change during twelve operations of its postponement from the leftmost point, and the accuracy is more than 10%, testifies to the presence of strict orderliness in the scale hierarchy of the objects of the Universe. Although we can currently judge the values of the average sizes of such objects as the nuclei of stars and the nuclei of galaxies with a low degree of accuracy, our study shows that, with further refinement of the sizes, the accuracy of their coincidence with the model sizes (taking into account the revealed bimodality in the distributions14) only increases.
Let us show by concrete examples how the sizes of objects with a five-order period coincide.
SCALE CLASS #0. The leftmost point of the scale interval - the size of the maximon (fundamental length) is theoretically determined with a very high degree of accuracy.
$$ l_p = 1{,}6158 \cdot 10^{-33}\text{cm}. $$
SCALE CLASS #4. Exactly after 4 intervals of 5 orders of magnitude, which gives a shift along the S-axis of 20 orders of magnitude, we obtain a value of 1.6 × \(10^{-13}\) cm, which is identical to the proton diameter with an error below 0.05 for the factor before the tenth.
So, we have made a shift of twenty orders of magnitude and obtained a point on the S-axis, which with an accuracy of 0.005 of one order corresponds to an extremely important size in the Universe - the size of the most common and long-lived particle - the proton. Consequently, the deviation of our calculated size from the real one is less than 1/20000!
However, the deviation can be defined in another way (see diagram on page 43).
SCALE CLASS #5. Another step of five orders of magnitude along the S-axis gives us a size of 1.6158 × \(10^{-8}\) cm. According to most sources, the diameter of the hydrogen atom is 1.4 × \(10^{-8}\) cm. The deviation from the calculated value is 0.2158 5. At one order of magnitude, the deviation is 10 times smaller ~ 0.02. Given that the shift from the fundamental length is 25 orders of magnitude, the calculation shows an error of 0.04% (0.02: 25 = 0.0004 = 0.04%). The maximum deviation from the theoretical grid is 5 orders of magnitude higher and equals 0.4 %.
SCALE CLASS #6. The next step gives us a value of 1.6158 х 10-3 cm. Approximately this size, as the study of cytology material has shown, does play an important role in the life of cells.
Unfortunately, biology still treats size parameters as illustrative and often does not even indicate the size of certain cells, or if it does, it is very approximate. Therefore, reliable statistics on cell sizes have yet to be collected in order to draw any confident conclusions. We can, however, say that with an accuracy of 1 order of magnitude this value coincides with the average size of all cells. In this case, the calculation error at thirty orders of magnitude does not exceed 1/30, and for the grid it is 1/2.5.
ERROR CALCULATION SCHEME
If we take into account that on the whole scale axis (S-axis) we imposed a periodic scale with a step of 5 orders of magnitude (periodic grid), then the value of the maximum possible deviation of the most important objects of the Universe from the nodal points of the grid will be 2.5 orders of magnitude (the maximum remote point from the selected marks will be in the middle between them).
The points of maximum deviation from the periodic theoretical mesh on the S-axis are shifted relative to the nodes by 2.5 orders of magnitude
Periodic grid nodes with a step of 5 orders of magnitude
Consequently, the maximum theoretical deviation from the nodes of the chosen periodic grid will be 1/2.5 orders of magnitude, so for the factor before the tens, whose value can run values from 1 to 9.9…, each whole unit of deviation will give an error of 1/25. (For example, going from a size of 5 meters to a size of 6 meters is only a change of about 1/10 of one order of magnitude; for 2.5 orders of magnitude, such a change in size results in a deviation of only 4% (0.1: 2.5 = 0.04 = 4%).
5 × \(10^{21}\)…6 × \(10^{2}\) (5 to 6 m) = 0.1 intervals of 1 order. (One order of magnitude corresponds to a 10-fold increase in size.)
Since the deviation of the proton size from the theoretical value does not exceed 0.05 fermi, the total error in this case can be defined as 0.05:10:2.5 = 0.002, or less than 0.2%. This error is larger than that obtained above, but it is still negligibly small, and given the inaccuracy of determining the proton diameter for values after tenths, it can be neglected altogether.
SCALE CLASS 7. Another step to the right gives us the value 1.6158 × \(10^{2}\) cm. The average human height until the beginning of the XXI century was quite close to 1.6 m, in our time it has increased by 4-5 cm (most likely due to hormonal additives to animal food). But it hardly deviates from the average value of 1.62 cm by more than ±10 cm. Therefore, with a large margin of error we can assume that the error is less than ±0.1 m, and this will give us a deviation from the calculated value of 0.02 orders of magnitude. Taking into account that the limit deviation is 2.5 orders of magnitude, the average human height is determined with an accuracy above 0.4%. It is important to note that three known cosmological constants (G, ħ, c) and one discovered by the author, were used in the calculation of the average human height. Let us consider this dimension in more detail. Obviously, the obtained error is so insignificant that the non-randomness of man’s growth in the universal hierarchy can be considered strictly proved. If we take into account that deviations could accumulate in the periodic series of sizes (to get to the man, we made 7 such steps, and the deviations were not accumulated, but mutually compensated), and if we take into account that the real average height deviates from the value of 1.6158 meters by less than ±10 centimeters, then the hit of the man’s height in the general periodic series of hierarchical floors can be considered simply ideal.
It is impossible to attribute this fact to thoughtless combinations by constants. After all, the fundamental length obtained by M. Planck more than 100 years ago from three physical constants, is considered in science as one of the most important dimensional constants of our world. And the dimensionless coefficient \(10^{5}\), derived by the author, is universal for all basic objects of the Universe, with its help a number of dimensions is built, in which the proton, hydrogen, and all other significant objects are exactly located.
Let’s assign to the calculated cosmological value of the average height of a man the status of the average Theoretical Universal Human Height (\(L_{\text{HSU}}\)):
$$ L_{\text{HSU}} = (10^5)^k l_p = (10^5)^7 \cdot 1{,}6158 \cdot 10^{-33} \text{cm} = 1{,}6158 \cdot 10^2 \text{cm} = 161{,}58\ \text{cm} \tag{1.6} $$ where k is the number of scale class, or the number of scale level, for a human it is equal to 7.
It can be assumed that, throughout the entire history of humanity, the average height has fluctuated around or tended toward the cosmological average height. The calculation of the average height of a modern person in different countries is of separate interest.
Let us make a calculation for our country. According to the GSE (The Great Soviet Encyclopedia),, in the USSR in 1960-1970, the average height of men was 167-168 cm, and women - 156-157 cm. It is not difficult to calculate that for the average resident the average height was somewhere in the range of 161.5x162.5 cm. The arithmetic mean is 162 cm. Given that at this time there were about 10% more women in the country, the average value must be adjusted downward. Thus, the average height of the USSR inhabitants in this period differed from \(L_{\text{HSU}}\) by less than 4 mm. Taking into account the spread of 1 cm, which accompanies the indication of the average height of a person in the GSE, we can assume that it did not deviate at all from the \(L_{\text{HSU}}\) calculated by us!
However, since the first calculation of average human height, it has grown by 4-6 centimeters. Most likely, due to the use of hormones in the cultivation of agricultural products. And it has become more than the calculated theoretical value. But once again we repeat that a deviation of even 10 cm for this value is a negligible error.
Moreover, the obtained calculation is just a first estimate, but these two values - Theoretical Universal Human Height - TUHH and the real average height of the USSR inhabitant - coincide too precisely for this calculation to be just another random coincidence. So, we see that, at least for three objects: the proton, the hydrogen atom and a human being, the accuracy of the periodic partitioning of the S-axis is incredibly high. There arises an assumption that for other systems of the Universe the characteristic sizes of their most representative species have such a high coincidence with the calculated one.
By the way, it is possible to note (see relations (1.2) - (1.5)) that the ratio of LARGE NUMBERS, which so excited all physicists, has an error of more than one order (coefficients from 0.2 to 3.0) at 40 orders, which gives an accuracy not higher than 1/40, i.e. 2.5 %. If the error of 2.5 % did not embarrass physicists in the past, the error of 0.005-0.04 % should not embarrass them in the present study.
SCALE CLASSES # 8, 9, 10, 11. Four more levels were determined from reference data as the geometric mean sizes of stars, stellar nuclei, galaxies, and galaxy nuclei, as already mentioned, with an accuracy of 10 %. In future work, the technique for determining these sizes will be shown in an expanded form.
SCALE CLASS #12. Metagalaxy - estimates of its apparent radius from astrophysical data range from \(10^{28}\) cm - 2.5 × \(10^{28}\) cm. According to the concept of the finiteness of light, the “edge” of the Metagalaxy that astronomers see is in a position much closer than the real one. Because of the expansion, the real radius of the Metagalaxy can be from 32 light years away, and the diameter, accordingly, can be twice as large and reach a value of almost 6.4 × \(10^{28}\) cm. Thus, in different variants it is possible to use the parameters (1.6–6.4) × \(10^{28}\) cm.
For further calculations, we will use the value 1.6 × \(10^{28}\) cm, or, what is the same, \(10^{28.2}\) cm. For the reason that all electromagnetic oscillations have reached us and other corners of the Universe exactly from this distance. In this case, this observational value has a maximum deviation from the model point on the S-axis (\(10^{27}\) cm) of about one order of magnitude.
So, it has been found out that the most representative objects of their scale levels are located along the S-axis of the Universe with strict periodicity. However, in this periodicity, firstly, there is a micro-interval (the so-called Dirac basement), the structure of which we have to extrapolate by placing the photon, the electron nucleus and the electron itself on scale shelves, about which modern science cannot yet say anything even in theoretical calculations. And secondly, we have occupied two more shelves with bio objects (cell and man), which in the general series of systems of the Universe look like a special (though important for us) case. Thus, in the constructed periodicity of thirteen floors, the existence of five additional floors remains a significant question. In the following we will show that experimental physical data remove completely the question from one of the floors - the sixth, which plays a key role in the thermodynamics of the Universe. However, the other four floors (1, 2, 3, and 7) remain in many respects somewhat predictive.
METHODOLOGICAL DEPARTURE
Before moving on, I would like to consider the question of the methodology of building a periodic scale hierarchy. The point is that any continuous scale sequence of systems of the Universe will be perceived naturally if it has a constant transition factor of the type “consists of…” or “is included in…”. For example, the Metagalaxy “consists of…” galaxies that are not observable outside of it, so all galaxies are “included in…” Metagalaxy. Further, any galaxy “consists of…” stars, and vice versa, no galaxy-free stars have yet been found. Stars themselves are made up of atoms. True, atoms may well exist outside stars. However, on the other hand, these extra-stellar atoms in the Universe are so few (less than 0.1%) that they can be neglected and the opposite phrase can be written: atoms are “included in…” stars. Atoms are also “composed of…” protons, neutrons, and electrons, and we can confidently assume that most of these particles are not “walking around free” but are “included in…” atoms. Further, the particles are apparently “composed of…” maximon.
Thus, we have a continuous series of systems, which are very rigidly connected with each other by the system of mutual inclusion. In this series, as it has already been noted, there are relations of scales of type \(10^{5}\) or multiples of it. At the same time, if everything is practically obvious for the micro and megaworld, for the macro-world we encounter a serious methodological problem. We cannot claim that stars are “composed of…” people (although the priests of ancient Egypt believed so). However, further everything is in order: a human being consists of cells, cells consist of atoms…..
It is very difficult to find a way out of this PARADOX (which we ourselves, by the way, created) today. After all, if we consider the Earth with all its inhabitants to be a small side branch (in terms of mass) on the giant scale trunk of the Universe, then all its objects are a very private aspect of the Universe structure. The main “trunk” in the interval from atoms to stars is simply not yet studied by science. Due to purely natural and methodological difficulties, astrophysics is not able to study structures with dimensions of the order of interest not only in stars, but even in the Sun. Therefore, science cannot assert both that there are any distinguished and stable structures on this scale interval and that there are none at all. In this case there are no prohibitions on some model fantasy and we can assume that stars “consist of…” some not yet discovered, but very stable subsystems, the sizes of which are on average \(10^{5}\) times smaller than their own. This, by the way, is quite confirmed by the surface structure of the Sun (the average size of the star is approx. \(10^{12}\) cm), the “granules” of which have an average order of magnitude of approx. \(10^{7}\) cm. The “granules” themselves according to our scheme should also consist of some very stable structures of meter sizes, which are still five orders of magnitude smaller than themselves. It is clear that it is currently impossible to see such structures on the surface of stars, not just stars, but even the Sun. An even more incredible task is to verify the thesis that these meter-sized parts of “granules” should “consist of…” quasi-cells with sizes of tens of microns.
So, since astrophysics has not yet revealed anything similar even in the structure of the Sun, we find a gigantic failure of scientific information about the macrostructures of the most common systems of the Universe - stars. It turns out that observations do not give us any information about the structures in the size range from the scale of atoms to the scale of stars.
If we follow classical ideas, stars are composed of atoms (and their ions). Consequently, from stars to atoms in our series of systems through five orders of magnitude we practically cannot put with certainty any stable structures. Perhaps they really don’t exist, but then there is a giant gap in the scale floors of the Universe (skipping three steps). Perhaps they do exist and play a very important role in the life of stars, but have not yet been detected, so this scale failure is the result of our profound ignorance of the true structure of stars. Once again, recall that stars are 99% of the matter of the Universe, so any studies of this series on Earth alone are curious, but statistically very unrepresentative.
As for my own point of view, I quite admit that the substructure of all stars has all the above-mentioned stable floors alternating through five orders of magnitude. And it is possible to detect them not necessarily directly - visually, but also indirectly, through the regularities of frequency periods, which are surely related to these hypothetical stable sizes.
Summarizing this section, we can note that if we PROVIDE the existence of four-five more selected stable dimensional floors in the Universe, then its entire scale structure will be subject to a strict periodicity. And in some cases it is possible to establish that this periodicity is observed with incredibly high accuracy. If we discard all assumptions, we should note that the gigantic gap in the large-scale periodic structure of the Universe from atoms to stars is filled in our work with a thin web bridge mainly from biological systems of the Earth. It is simply not possible for us to know anything else for today. In order that the reader does not get the impression that this periodicity is peculiar only to the size of objects. Let us give some examples from other parametric domains. Take, for example, a number of characteristic physical and cosmological times. Let us note in advance that any system can theoretically have (and, as a rule, actually has) at least three characteristic times:
-
t - is the time for a signal propagating at a finite speed (e.g., the speed of light) to traverse the system cross section;
-
τ - is the time of oscillation of the system relative to the equilibrium point (natural period of oscillation);
-
T - is the time the system is in the excited state. Let us take ATOMS for starters. It is easy to calculate that an electromagnetic wave passes through the cross section of an atom at a time t of about \(10^{-18}\) s (\(10^{-8}\) cm / \(10^{10}\) cm/s).
The natural period of vibration (\(\tau\)) of all atoms in condensed media is known to be constant and equal to \(10^{-13}\) s.
The lifetime of an atom in the excited state (T) is also known, it is equal to \(10^{-8}\) s.
We see that the consecutive ratio between these three most important atomic characteristic times is \(10^{5}\). Maybe this ratio is peculiar only for atoms? However, it is not. Let us consider characteristic times for other objects of the microcosm - atomic nuclei.
It is easy to calculate that the electromagnetic wave passes the cross section of the atomic nucleus in time t equal to \(10^{-23}\) s = \(10^{-13}\) cm / \(10^{10}\) cm/sec. This same time is widely known in nuclear and elementary particle physics as the characteristic time of nuclear interactions. Another time, the lifetime of the nucleus in the excited state, T, is also well known. It is equal to \(10^{-13}\) s, which is ten orders of magnitude longer than the nuclear interaction time.
In accordance with the regularity established for atoms, we can calculate the intrinsic period of vibration of the atomic nucleus - \(\tau\). According to our scheme it should be \(10^{5}\) times less than the lifetime of the nucleus in the excited state - \(10^{-18}\) s. 6
So, we can PROPOSE that also for atomic nuclei the three characteristic times are correlated with the coefficient \(10^{5}\). In any case, it is obvious for two of these times.
One can BELIEVE that the time logarithmic axis on this scale interval also has selected points (see Fig. 1.5), which are five orders of magnitude apart. Otherwise, how else can we explain the fact that characteristic atomic times are elementarily obtained from characteristic nuclear times by multiplying them by \(10^{5}\)?
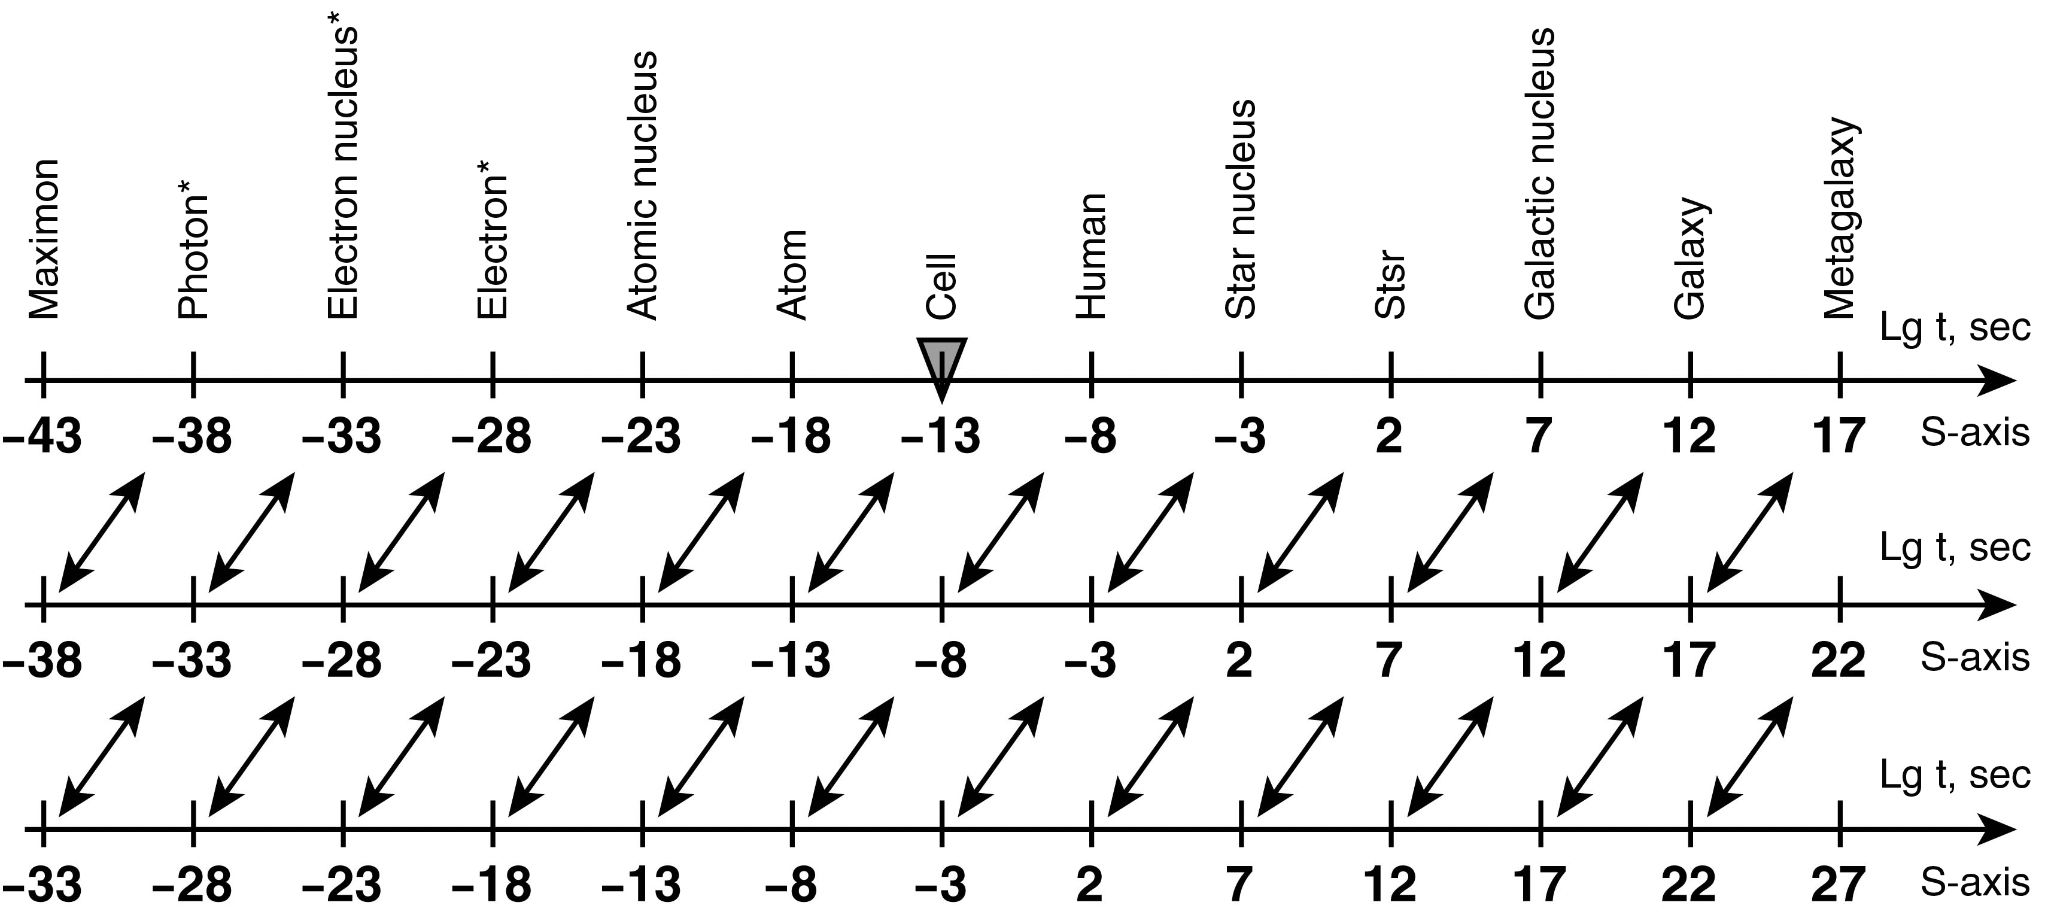
Fig. 1.5 The scale-time periodicity (\(10^{5}\)) of the Universe assumed by the author (simplified model). 7 8
How can we explain the fact that for the Earth’s orbit, the dimensions of which are about \(10^{13}\) cm, by quadrupling the oscillation period of the atom by \(10^{5}\) we get the value: \(10^{-13}\) s × \((10^{5})^4\), i.e. about \(10^{7}\) s, which is surprisingly close (taking into account the huge distance on the logarithmic axis) to the value of one year (365 × 24 × 60 × 60 = 3 × \(10^{7}\) s).
Hence, we can PROVE that on the S-axis the conversion factor of characteristic dimensions into characteristic times is the speed of light.
Further. The coefficient \(10^{5}\) can also be found in the relations of field interactions. Thus, the experimentally found constant of the four-fermion interaction, which according to the Fermi model can be considered as a weak interaction, can be written in the form 9:
$$ \mathbf{G}_f = 10^{-5} \cdot \hbar^3 / M^2 \cdot c \tag{1.7} $$
where ћ is Planck’s constant, c is the speed of light, and M is the mass of the nucleon.
Another example from the field of microphysics. It has been calculated16 that the mass of a boson necessary to realize the so-called grand unification (all kinds of interactions) must be \(10^{15}\) times the mass of a proton, which on the mass scale axis corresponds to a threefold multiplication by the factor \(10^{5}\).
So, we see that the ratios not only of sizes, but also of other important parameters (times, masses…) of the most representative objects of the Universe often show the same dimensionless coefficient - \(10^{5}\).
The facts listed above, related not to the sizes but to other parameters, may seem randomly selected, so the author once again warns that a thorough and complete study of scale periodicity is made by him only for the parameter of the sizes of systems. It is in this area that the choice of each of the points on the S-axis is reasonable, not random. It is worth recalling once again that in recent decades most theoretical physicists have increasingly come to realize the leading role of spatial regularities. There is an intensive work on geometrization of physics.
“Matter is an excited state of dynamic geometry… Geometry predetermines the laws of motion of matter…” 10
Concluding this section, let us consider in more detail, perhaps, the most intriguing fact established by the author in the course of research into the large-scale hierarchy of the Universe: THE CENTRAL LOCATION ON THE S-INTERVAL OF THE UNIVERSE OF THE HUMAN SEX CELL (see Fig. 1.6A). With incredible accuracy nature literally adjusts to the value close to 30-50 microns the size of the male sex cell and the egg cell nucleus at the moment of their synthesis (see Fig. 1.6B), and it is this size that corresponds to the S-Center of the Universe or SCU, or a point on the S-axis (-2, 3).
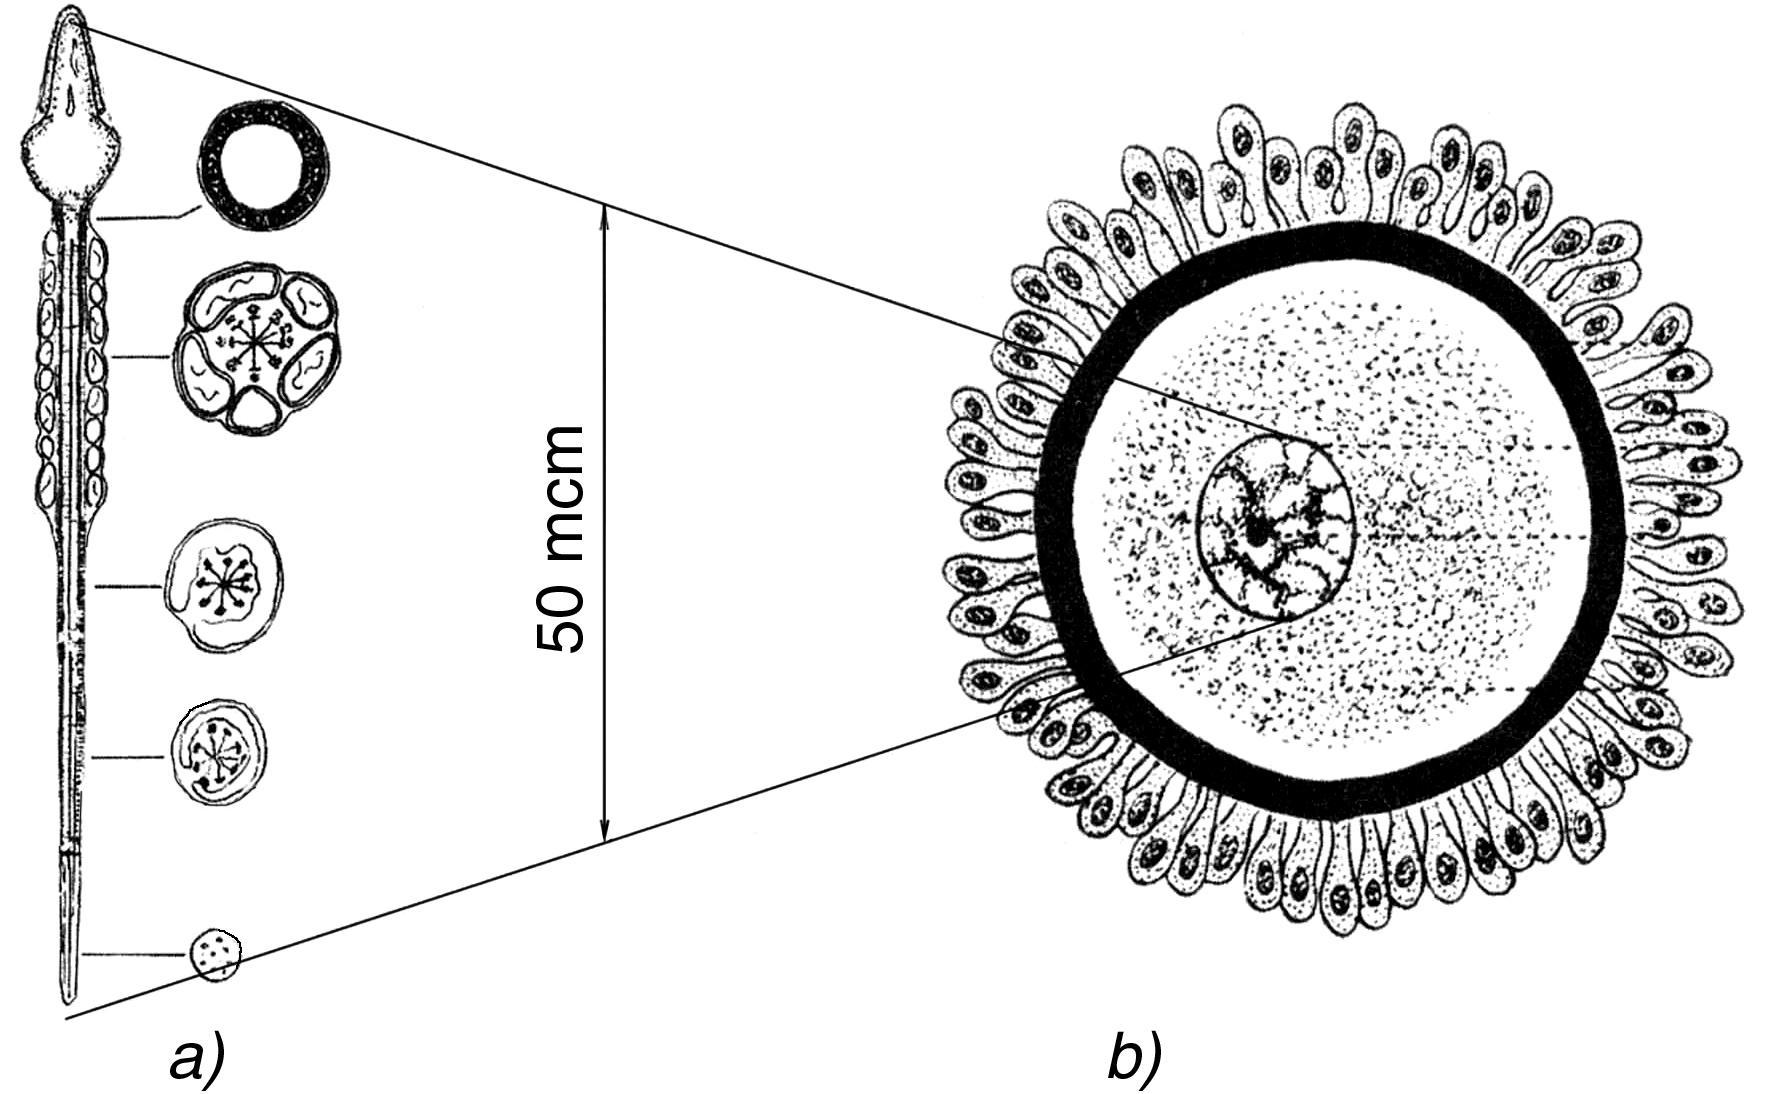
Fig. 1.6A. The sperm cell (a) is 50-60 microns long. The female germ cell (b) is much larger: 130-160 microns, but its nucleus is also approximately 30-60 microns long.
Many years of reflection on this fact have convinced me that it is not a coincidence, but a consequence of a special, allocated position of life and man, especially in the large-scale hierarchy of the Universe. After all, if we consider man in a more generalized plan as a generic man (and there are many reasons for it, for example, such as: more than 80 % of man’s life is determined by his genetic heredity, which is formed just in the SCU), then we can confidently assert that man is a QUINTESSENCE of all the processes going on in the Universe, and occupies in its hierarchy an ABSOLUTELY exactly central place.
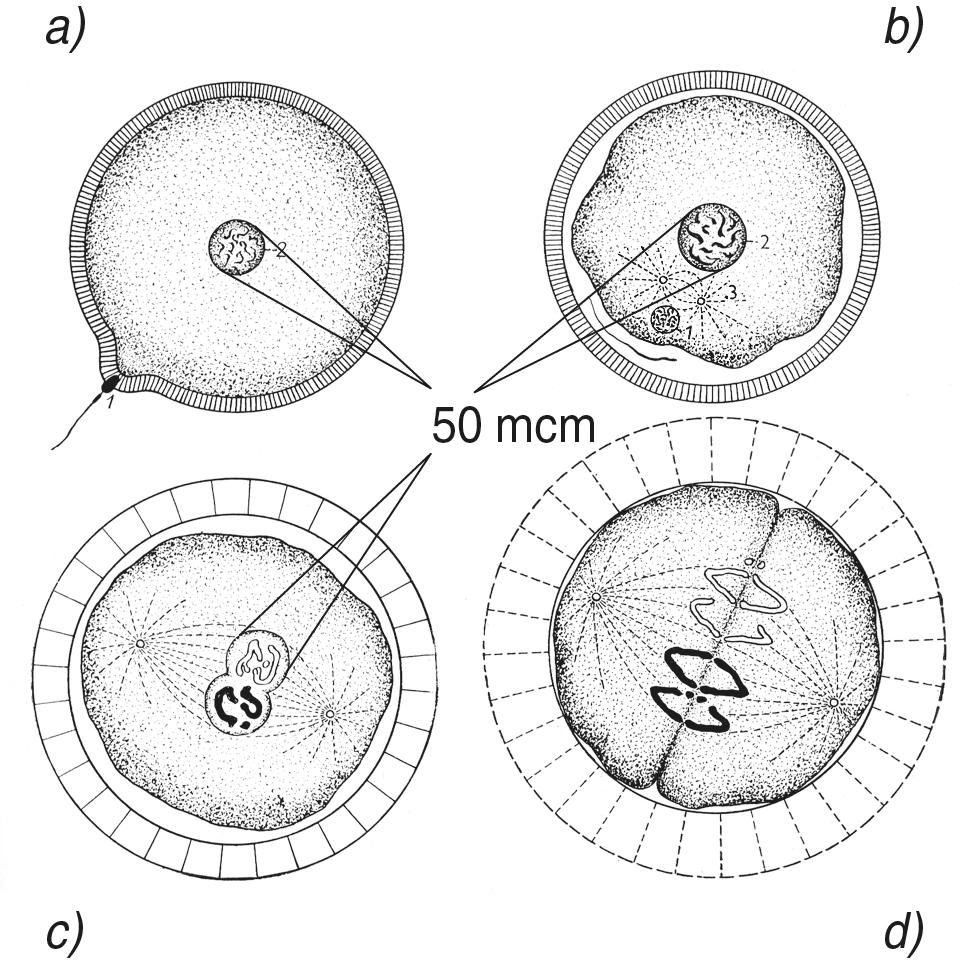
Fig. 1.6B. As a result of the “race”, only one of the 200,000,000 sperm pierces the female cell membrane (a) and penetrates it to effect fertilization. The sperm head, which is much smaller in volume than the female primary nucleus, then begins to gradually increase in size (b) until it reaches approximately the volume of the egg cell nucleus and, remarkably, a size of about 30-50 microns. Only then does the contents of both primary nuclei fuse into a common nucleus (c). The synthesis of the nuclear material, which takes place absolutely precisely in the scale center of the Universe, ends the process of fertilization and begins the ontogenetic development of the new organism (d). Thus, the starting scale “site” for each human being is the scale center of the Universe (50 microns), and the finishing “scale line” is the size of an adult organism, which is exactly 5 orders of magnitude higher on the scale scale of sizes.
However, this topic is so important that we will leave it to special consideration.
-
The choice of the scale of decimal logarithms was determined at the first stages by considerations of convenience, since most of the sizes of the objects of the Universe in scientific literature are given in this traditional form. ↩
-
The only exception to the established rule is the Metagalaxy itself, which is located on the S-axis 1 order of magnitude to the right of the calculated location. ↩
-
For simplicity of explanation of the main idea, two models of the scale symmetry of the Universe are used in this paper: a simplified model, or rounded to integer orders, and a refined model using hundredths of an order. The simplified model is convenient for clarification of the basic regularities of scale symmetry, and the refined model is convenient for verification of phenomenological data. At the same time, the simplified model uses the values of the size of the maximon - \(10^{-33}\) cm and the size of the Metagalaxy - \(10^{27}\) cm (which corresponds to its age of about 1 billion years), i.e., it operates with the S-interval \([-33; +27]\) with a length of 60 orders of magnitude.
The refined model uses size values of \(10^{-32.8}\) cm and \(10^{28.2}\) cm, respectively, i.e., considers the S-interval \([-32.8; +28.2]\) with a length of 61 orders of magnitude. Such replacement of one interval by another in order to emphasize the reader’s attention on the main points of the author’s idea gives an error of only 1/60, i.e., only 1.5%. ↩ -
A clear classification will be given later, see Fig. 1.7. ↩
-
The reason for this discrepancy may also be some underestimation of the true sizes of atoms, the boundaries of which are determined by the maximum density of the electron cloud. ↩
-
However, the author has not been able to find a reference to such a time in the literature. Perhaps it is simply rarely mentioned, perhaps it has not yet been discovered. ↩
-
\(10^{17}\) seconds is about 10 billion years - the lifetime of the universe. ↩
-
Or a planetary orbit, such as Mercury. ↩
-
Vladimirov Y. S. Space-time: explicit and hidden dimensions. Moscow: Nauka, 1989. С. 97. ↩
-
Wheeler J. Einstein’s Foresight. М.: 1970. С. 15-18. ↩
S-wave of stability
Thus, we have established that with sufficient accuracy (in some cases - with incredibly high accuracy) the main objects of the Universe are located on its scale hierarchical axis not chaotically, but strictly ordered, in 5 orders. If we take a closer look at the revealed series (see Fig. 1.4), another regularity draws attention: in some cases the core of systems and their structural superstructures alternate through five orders. It is PROPOSED that there is another periodicity with a step of ten orders, and we are actually dealing with two series: nuclear and structural, which are shifted relative to each other by five orders.
Since the nuclei of objects are much more stable (in the most general sense of the term) than their structural superstructure, the identified two rows can be placed on the diagram one above the other. By this arrangement we strengthen the intuitive certainty that the nucleus (of an atom, star, galaxy, etc.) is more stable to external influence, exists longer and is less subject to transformations than the structural superstructure itself. Let us once again draw a diagram of the location of the selected main objects of the Universe on the S-axis (in the future, the validity of this construction will be confirmed by empirical data).

Fig. 1.7. Quantitative-qualitative scale-stability diagram, named S-Wave of stability (SWS) in 1979
Let us note in advance that the scale classes introduced by us are common for all kinds of systems of the Universe. One and the same scale class is filled with objects with different properties. For example, class No. 8 is occupied by planets, star cores and biocenosis. At the same time, the scale boundaries of these objects are invariant with respect to their material filling
In the diagram, purely conventionally for reasons of convenience, it is assumed that stability increases downward along the Y-axis. In this case, the entire nuclear series is located below the S-axis (see Fig. 1.7), and the structural series is located above the S-axis.
The upper and lower points will be connected by a sinusoid, which, as it will be shown further, turns out to be a very convenient model reflecting many system properties of the Universe objects. Due to the fact that in the troughs of the sinusoid the stability of objects in general is higher than at the crests, we will give the obtained MODEL the name “Stability Wave” (SW).
This model carries, among other things, the following semantic load: the main objects of the Universe are not only located along the S-axis in a strictly ordered, periodic manner, but also the periodicity of their location has a VOLUME HARMONIC CHARACTER.
However, along with the obvious distinction between nuclear and “supranuclear” or structural objects, we see two systems that seem to fall out of this pattern. We are talking about humans and cells
At first glance, their placement in the general alternation of nuclei - structures is incorrect. On the other hand, a cell corresponds quite well to the “nuclear” status in relation to a human being, because it contains the main structural information about him. True, the concept of “nucleus” is more habitually considered as one single nucleus, which is located, moreover, in the geometrical center of the system. Here we are rather talking about a polynuclear structure. Let us leave for now the legitimacy of such placement without explanation and see what conclusions we will come to as a result of the whole study. However, before moving on, an additional METHODOLOGICAL EXPLANATION is necessary.
The resulting diagram (see Fig. 1.7) is just a semi-metric classification scheme, in which the SIZE OF SYSTEMS (horizontal axis) is defined with the highest possible accuracy, and the stability OF SYSTEMS (vertical axis) is a conditional qualitative measure.
Recall that in classification works such qualitative parametric spaces are often used quite successfully. Take, for example, the well-known classification of galaxies - the Hubble diagram (see Fig. 1.8). In it, galaxies are ordered by type, and the types are connected in a highly conventional qualitative sequence in which metrics and justification for the arrangement are missing both horizontally and vertically. This simple scheme, despite numerous attempts to modify it17 , has survived for decades and is still used in almost all survey works on galaxies.
The quantitative-qualitative diagram we have constructed (see Fig. 1.7) at this stage of the analysis of scale symmetry is no more than a conventional scheme. We need it in order to begin to distinguish the objects of the Universe not only by their sizes, but also by other criteria. At the same time, it is necessary to warn in advance that the main goal of this work is still the study of regularities of distribution, “motion” and change of objects along the S-axis (along the logarithmic axis of sizes). It is in this direction that the author has made the greatest efforts and obtained the most accurate and stable scientific results.
However, in order to compare objects with each other, often one dimensional parameter is not enough. Then there is a need for additional attributes and properties that are not directly derived from dimensions. Therefore, this paper is woven as if from two very different methodological lines.
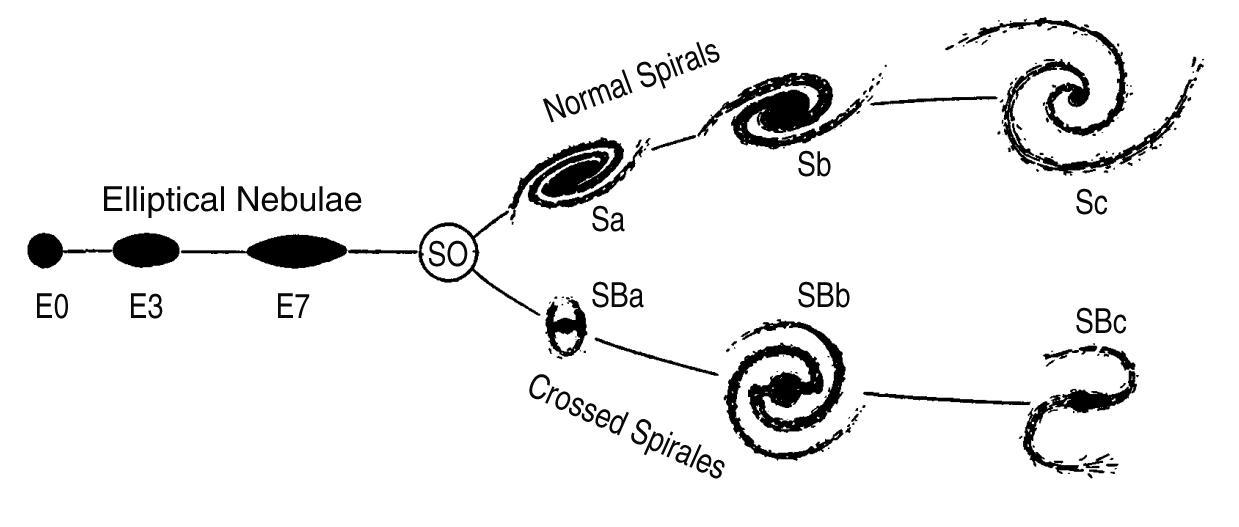
Fig. 1.8. The first and most widespread chamberton classification of galaxies by E. Hubble
On the one hand - very precise determination of coordinates on the S-axis and creation of a MODEL PERIODIC grid, in the nodes of which important properties of matter change, the most widespread systems are located, etc. On the other hand - non-metric intuitive division of objects by their properties.
Let us return to our wave model (see Fig. 1.7). The construction of the S-WAVE of stability (SWS) was a very long, painstaking process, which can be compared to the reconstruction of the appearance of an unknown ancient animal based on several fragments of its skeleton. And only the complexity of the comparison of facts, their multifactor check for consistency allowed us to confidently assert that the S-WAVE of stability is not a figment of imagination, but ONE OF THE PHYSICAL REALITIES OF OUR WORLD. In further sections of the book this will be shown with all possible completeness.
The S-WAVE of stability (SWS) makes it possible to place nuclear and structural forms of matter on different scale levels. It allows us to give a qualitative comparison of their relative stability. In addition, the points of intersection of the SWS with the S-axis, as revealed by the analysis, are dimensional boundaries for the main classes of the systems we have chosen.
The S-WAVE of stability has a number of other additional informational properties, which, as will be shown below, lead us to the regularities of large-scale dynamics in the Universe. It should be said that many successful properties of the wave model make it simply an indispensable tool for preliminary analysis of large-scale regularities in the Universe.
That said, it should be noted that it does have some very unprocessed areas.
First, it is the interval from -33 to -13, the so-called Dirac basement. By placing there the electron and the photon, the author has obviously gone to arbitrariness, because there are no serious arguments in favor of such a step.
Secondly, in fact the nodal sizes -3, +2 to and +7 are very weakly supported by statistical basis from physics. Yes, -3 is the most important size for the biosphere, the average size of cells, yes +2 is the most important size for humans - their own growth. But how do you compare a cell to a human being and the rest of the physical world? This is partly answered in the book “Man on the scale of the Universe,” but questions remain.
Thirdly, astrophysicists do not know the true size of stellar nuclei. Their theoretical size of +7…+8 orders of magnitude on the S-axis does not agree with astrophysical calculations, which give orders of magnitude larger sizes. Thus, we do not know what the true ratio between the average size of a star and its nucleus is. Is it the same as that of an atom, i.e., 1 to \(10^{5}\), or is it significantly different, e.g., 1 to 100? Thus, there are many questions about the structure of the S-WAVE of stability . But, on the other hand, there is not a single observational fact that violates it. There are unclear, unexplored places, but there are still no contradictions with the factual material.
S-classification boundaries in the S-structure of the universe
In the previous chapters it was shown that the most typical representatives of the thirteen main classes of objects of the Universe are located on the S-axis with strict periodicity in five and ten orders of magnitude. In doing so, we used the geometric mean sizes of the selected objects. Recall that this parameter was defined as the midpoint of the scale range of the objects’ existence. For this purpose, the dimensional boundaries for each studied class (minimum and maximum) were marked on the S-axis, and then the midpoint of the obtained segment was found.
The logical development of this scheme led the author to the construction of the S-WAVE of stability . Then it unexpectedly turned out that the SWS MODEL has additional heuristic possibilities. For example, in many cases the permissible range of object sizes coincides with the points of intersection of SWS and S-axis, and the scaling length of this range in many cases is equal to five orders of magnitude. That is, not only the main objects of thirteen classes of the Universe are located at a distance of five orders of magnitude from each other, but the scaling range of eleven of them is also almost always equal to five orders of magnitude. At the same time, each upper half-wave of the SWS, having a scaling length of five orders, as we have already said, is “populated” mainly by structural objects, and each lower half-wave - by nuclear objects. Moreover, it turned out that the upper and lower inflection points of the SWS are also classification boundaries, but within each of the thirteen classes. Since the special points on the SWS (inflection points and points of intersection with the S-axis) alternate in 2.5 orders, this model gives us a hierarchical scale classification. In this classification, there are large cells whose scaling length is twenty orders of magnitude. These large cells are subdivided into cells of ten orders of magnitude, which in turn are subdivided into cells of five orders of magnitude, and those into cells of 2.5 orders of magnitude. Moreover, as will be shown, cells of fifteen orders of magnitude also make physically real sense. All this suggests a complex combination of different classes with each other. It can hardly be taken as a coincidence, so the author had a PROPOSITION that the , constructed at the first stage simply as an image of stability of objects, is also a convenient classification matrix for large-scale division of the Universe floors. Let us show to what extent this assumption corresponds to the facts.
We start the analysis with the largest classification division of SW into three identical sections of about twenty orders of magnitude each.
Types of interactions in the S-hierarchy of the universe
At present, science knows and has studied four interactions to varying degrees: weak, strong, electromagnetic and gravitational. It is fundamentally important to note that each of them has a different degree of influence on matter depending on the scale level 1. If this fact is not noticed, one can come to incorrect statements. Thus, J. Wheeler wrote: “It is often said that “the coupling constant of the gravitational field is small.” However, this kind of statement in the framework of classical physics is devoid of any meaning, because there is no natural scale for comparing physical effects.“19 What are we talking about here? Yes, that at different scale levels the ratio of forces of interactions is essentially different. All interactions should be considered only taking into account their role in certain areas of scales. Let us see, based on scientific data, how these interactions “populate” the S-axis (see Fig. 1.9).
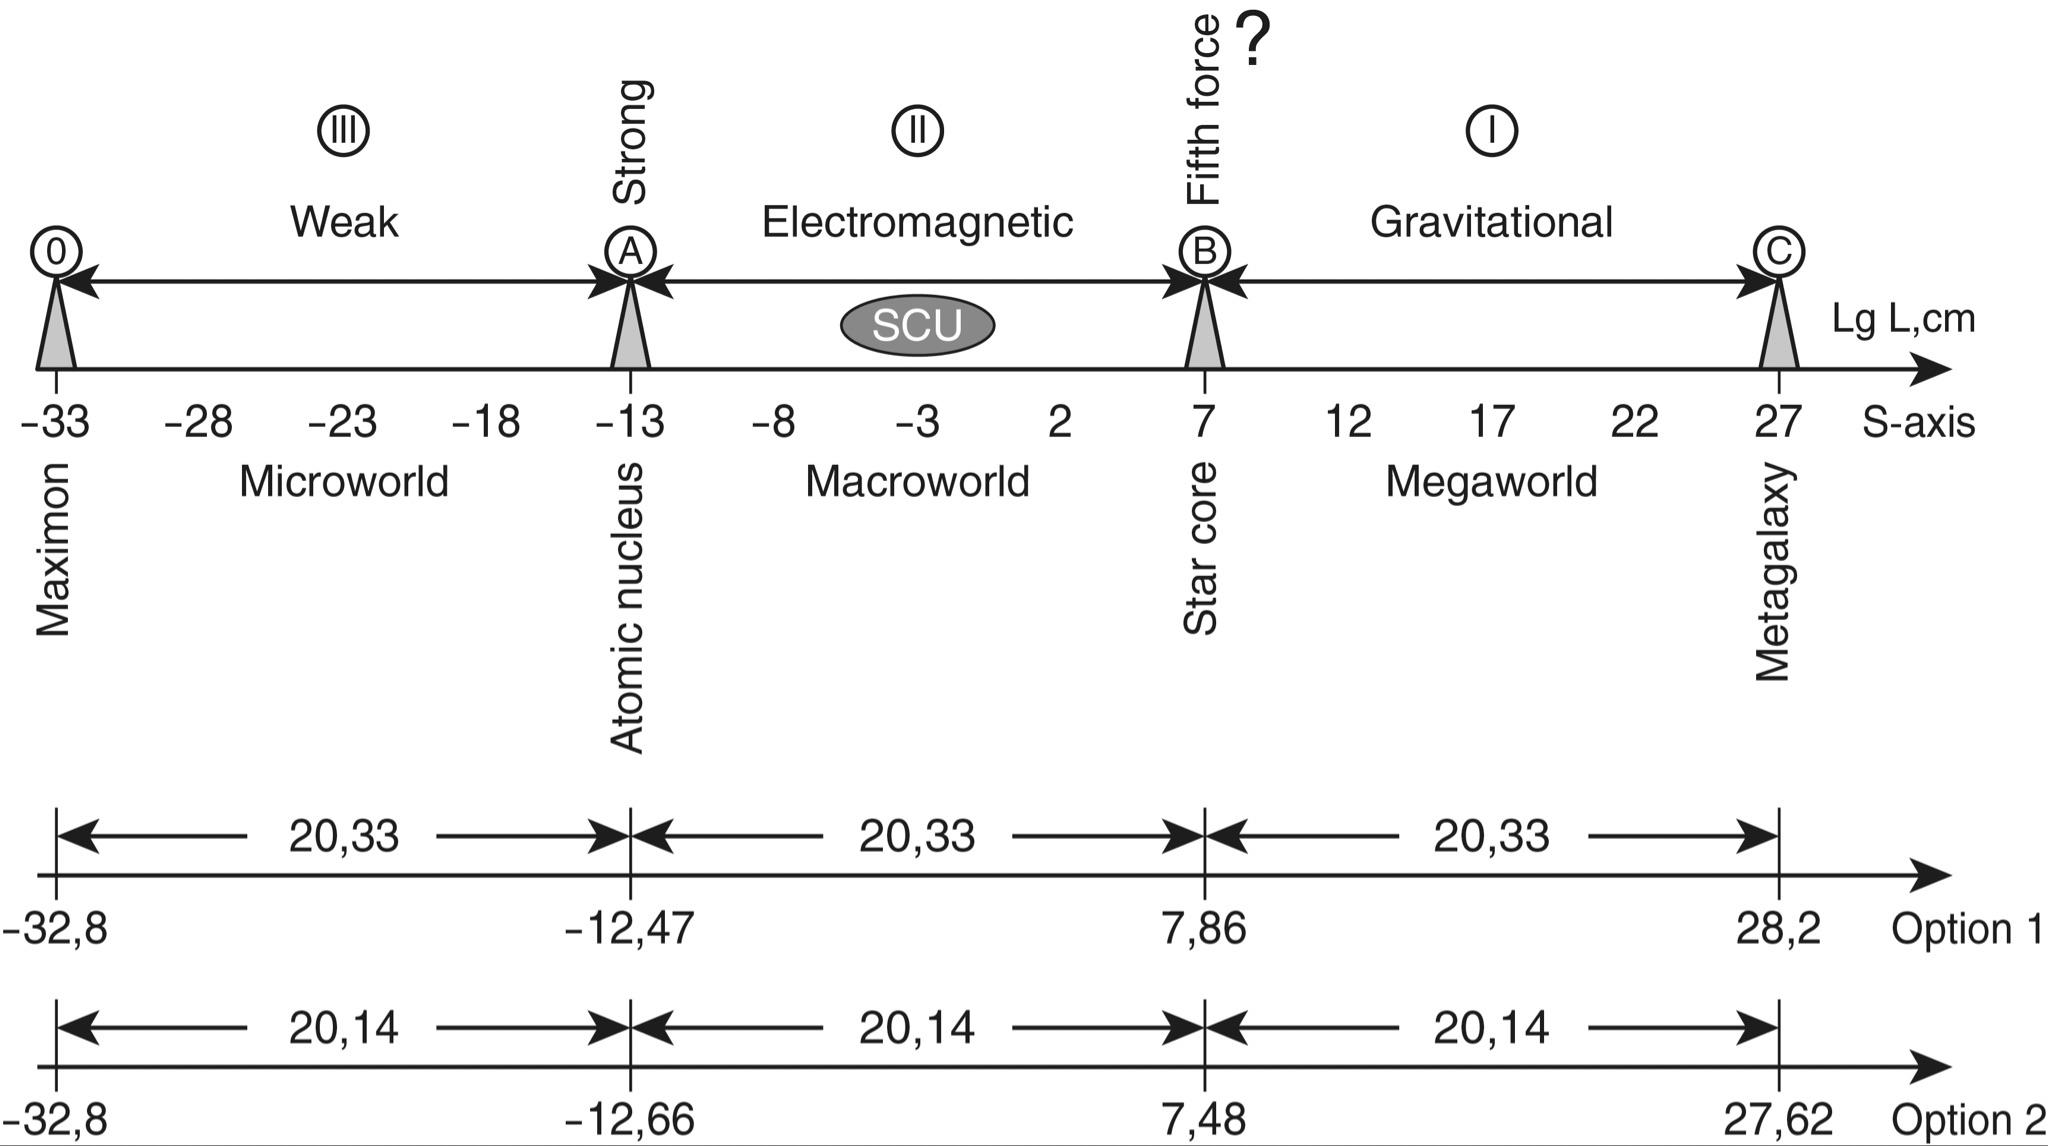
Fig. 1.9. Location on the S-axis of the four types of interactions.
At the top is the simplified integer version. At the bottom are two variants of calculating exact values for points A, B and C and intervals for three interactions
I - IS THE MEGA-INTERVAL. When considering the interaction of stars and galaxies, the GRAVITATIONAL interaction turns out to be the decisive factor, while neither weak, nor strong, nor even electromagnetic forces can be mentioned here, so negligible are the results of their impact at the mega-level of the Universe.
“If we talk about any cosmic object as a whole, be it a planet, a star, a galaxy, etc., then in none of them magnetic forces play the dominant role determining the very existence of the object. Everywhere the main role belongs to gravitational forces.”[^ref-20] The reason for this is that as the mass of the object increases, the charged particles shield each other, which leads to compensation of their electric and magnetic fields. This as if neutralizes the electromagnetic field of matter. Naturally, the mass of particles and their gravitational field are not shielded by anything. Therefore, with the transition to ever larger objects, the energy of the electromagnetic field grows slower rather than in proportion to the total number of particles of the object.
“Gravitational interaction differs from electromagnetic interaction in that all particles have masses of the same sign, including antiparticles. As a result, the role of the gravitational interaction, hopelessly weak in the world of elementary particles, increases in the transition to ever larger scales and absolutely dominates on the scale of the Universe 2. Therefore, if in small volumes … magnetic forces can completely control the behavior of matter, then in a planet, star or galaxy as a whole this is no longer the case, and in even larger areas, significantly exceeding the size of individual galaxies, the dynamic role of the magnetic field is apparently negligible.” [^ref-21]
II - MACRO INTERVAL. The whole macro-world in which man lives and acts is a world in which the main architect and builder is electromagnetism. Due to the fact that this force has equivalent “poles” - attraction and repulsion, nature by means of a huge number of combinations of these forces builds an incredible number of types of systems at different scale levels (here the analogy with the binary language of computer programs is appropriate).
A – “TRANSITION POINT”. However, the role of electromagnetic forces weakens not only as we move into the megaworld, but also as we dive into the microcosm. Thus, on nuclear scales, the ELECTROMAGNETIC interaction forces are already much weaker than the SILENT interaction forces. “Nuclear forces are large in absolute magnitude… For an example it is enough to say that the binding energy of the simplest nucleus (deuteron) due to nuclear forces is equal to 2.26 MeV, while the binding energy of the simplest atom (hydrogen) due to electromagnetic forces is equal to 13.6 eV” [^ref-22] 3.
However, the Nucleic Forces are strongest only in a narrow range of the S-axis.
“The nuclear forces vary greatly with distance; at a distance of 1 fermi, the nuclear forces between protons are thirty five times the electric repulsion force and \(10^{38}\) times the gravitational interaction. At distances less than 0.7 fermi the nuclear forces act as repulsive forces, at distances greater than 0.7 fermi - as attractive forces; at a distance of two fermi their effect is zero.” [^ref-23].
III - MICRO INTERVAL. If we go further into the microcosm, it will turn out that the WEIGHT INTERACTIONS, which are about \(10^{13}\) times weaker than the strong ones on the scale of atomic nuclei, appear to dominate over all kinds of interactions after 2-3 orders of magnitude.
Thus, the scale of the dominant action of the weak forces, which are responsible for the decays of elementary particles, nuclei and other micro-objects, is already quite microscopic. “Experiments performed…on high-energy neutrino beams have shown that…the radius of action of the weak interaction forces is at least 100 times smaller than the radius of action of the nuclear forces. In this case, the entire ‘weakness’ of the weak interaction is due to the smallness of their radius. “24 It does not follow from this that the role of these forces in the Universe is small. It is as great as the role of electromagnetic, gravitational and strong interactions. In fact, in addition to decay, weak forces initiate the birth and transformation of particles25.
Consequently, the strength of each interaction varies on different scales, and each of them is responsible for one or another floor of the Universe structure. Figuratively speaking, there is a peculiar division of labor between interactions in nature: WEAK FORCES DOMINATE IN THE MICROCOSM, ELECTROMAGNETIC FORCES DOMINATE IN THE MACROCOSM, and GRAVITATIONAL FORCES DOMINATE IN THE COSMOS.
So, we see that each of the interactions plays a very important structure-forming role in the Universe, first of all, on its large-scale floors. And where one of them “commands,” it practically “does not allow” other interactions to have a significant effect on matter. If there are large-scale “zones” of dominance for each of the interactions, then there must also be “junctions” between them - such large-scale levels on which the “passing of the baton” from one type of interaction to another can be clearly traced. The AUTHOR’S HYPOTHESIS is that each of the interactions (gravitational, electromagnetic and weak) occupies ONE S-interval on the S-axis.
Then the whole S-interval of the Universe can be divided into three equal parts.
If the author’s hypothesis is correct, the TRANSITION POINTS from one type of interaction to another should have sharply expressed special properties. Let’s check this hypothesis. THE FIRST VARIANT OF CALCULATION OF TRANSITION POINTS. To determine the boundaries between the three interactions, it is necessary to divide the S-interval of sixty one orders into three sections, which will give us the length of each third of 20.33 orders (see Fig. 1.9).
Let’s make the corresponding marking on the S-axis and see what values of dimensions we have obtained. We will call each of the three sections, respectively: Micro-, Macro- and Mega-interval.
POINT A. If we postpone from the leftmost point at (-32.8) order, conventionally from point 0, the length of one third of the S-interval at 20.33 order, we obtain the model point a on the S-axis:
(-32.8) + 20.33 = (-12.47), corresponding to a size of \({3.4}\cdot{10^{-13}}\) cm.
According to empirical data [^ref-26], the strong interactions cease to act at a distance of \({2.2}\cdot{10^{38}}\), i.e., the size on the S-axis, where the transition from strong interactions to electromagnetic interactions is observed, is \(10^{-12.66}\) cm. The deviation from the model value obtained by us is only 0.19 orders of magnitude.
Since we found the model boundary by postponing some segment from the left boundary of the S-interval of the Universe (from point 0), the operation was performed at twenty orders of magnitude. Consequently, the error of calculations is less than 1%. This is a very good result, especially since it is necessary to take into account the uncertainty of the true size of the Metagalaxy, which makes the right boundary (point C), and hence the length of the S-interval, floating within fractions of an order of magnitude.
POINT B. Next, let’s postpone from the size of the maximon (from point 0) two thirds of the S-interval and get another characteristic point - point B: (-32.8) + (20.33 х 2) = 7.86.
According to the AUTHOR’S HYPOTHESIS, this size (\(10^{7.86}\) cm) should mark the boundary separating the scales dominated by electromagnetic interactions from those dominated by gravitational interactions. To test this hypothesis, we need a dataset of bodies of the same type, with dimensions both smaller and larger than \(10^{7.86}\) cm.
The bodies of the Solar System are best suited for this purpose. In it, one can find objects of a wide range of sizes: microdust particles, micrometeorites, meteors, asteroids, etc. All these objects are mostly irregular and fragmentary in shape, which is caused by local interactions of atoms and molecules.
However, the larger the size of bodies, the stronger the role of gravity, and, starting from large planets, only gravity is responsible for the shape. Unlike electromagnetism, gravity has only one “pole” - attraction. It “speaks” a language with only one letter in the alphabet. Gravity can perform only one function - to gather, to pull objects to each other. Because of this, gravity in the limit of its influence is able to create only balls. Collective forces of its attraction always have a single point in the center of mass of each body, which at the loss of kinetic energy by this body becomes the geometric center of the spherical body. That is why all planets and stars are so remarkably monotonous in shape: they are spherical. The transition from the chaotic shape of cosmic bodies to spherical shape is precisely an indicator of the transition from the dominance of electromagnetism to gravity. Thus, for crystalline dense bodies, the transition from formless asteroids to the ideal shape of spheres of planets and further - stars occurs in the region of hundreds of kilometers (see Fig. 1.10).
We see that starting from microdust and up to large asteroids for almost 15 orders of magnitude in space in the overwhelming number of cases there are exclusively formless bodies that have zero symmetry - they are asymmetric. But as soon as we pass the threshold of a few hundred kilometers, gravity comes into play and creates almost perfect spherical bodies27. 4
According to modern hypotheses, all cosmic bodies were formed by condensation from cosmic dust. This joining of particles into a single object was due to electromagnetic coupling. Starting from primary crystalline embryos that could still be symmetrical, the further growth of cosmic bodies rapidly led to a loss of symmetry (see Fig. 1.10). Up until asteroids, only formless bodies formed in space. But as soon as a certain size threshold was crossed, gravitational forces, overcoming the resistance of electromagnetic forces, immediately created “spheres,” and there was an extreme jump in symmetry - from zero to infinity!
Of course, it is extremely interesting to determine with the utmost possible accuracy at what size such a limiting jump in symmetry occurs. For this purpose, it is necessary to study the shape of small planets with sizes of hundreds of kilometers. This was possible only after the flight of American satellites to distant planets, which transmitted to Earth the image of small planets.
The following minor planets of the asteroid belt were found to be spherical in shape: Ceres (1000 km), Pallada (530 km), and Vesta (530 km)28
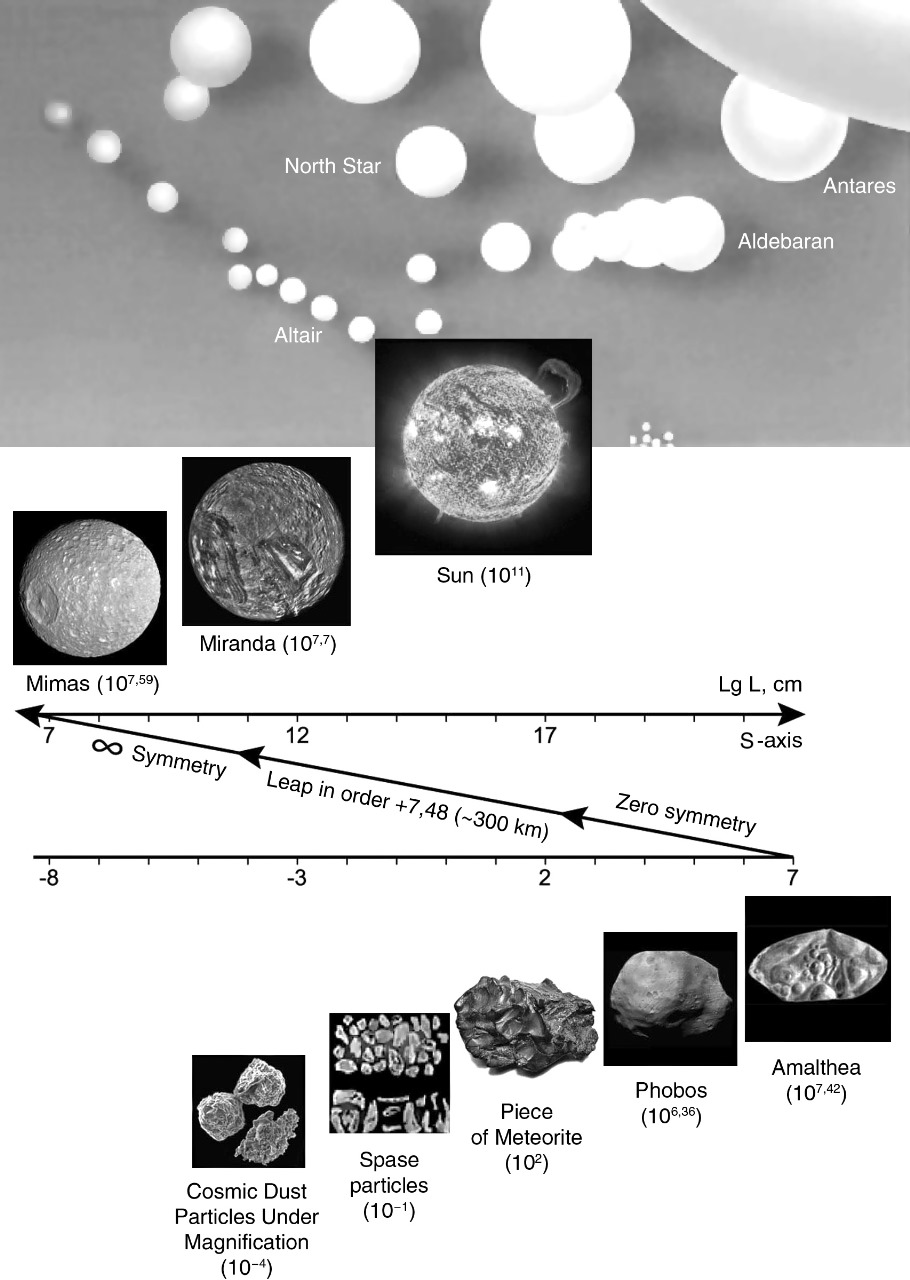
Fig. 1.10. The jump from zero-symmetry to infinite symmetry when crossing the boundary of values (107,48 cm ~ 300 km) on the S-axis. The characteristic dimensions in centimeters are given in parentheses. The top shows the spherical shape of the stars without taking into account their position on the S-axis.
Smaller planets are also known that have a spherical shape, such as Miranda (500 km in diameter), a small moon of Uranus, or, for example, Mimas29 a satellite of Saturn with a diameter of 390 km. On the other hand, satellites smaller than 300 km have disordered shapes, such as Saturn’s satellite Ida30 or the largest of Jupiter’s small satellites Amalthea31 (265 - 150 km), not to mention such bodies as Mars’ satellites Phobos (23 km) and Deimos (16 km). So, it turned out that all bodies up to Amalthea (265 km) have a disorderly asymmetric shape. However, starting from the size of 390 km, which has Saturn’s satellite Mimas, the shape acquires strictly spherical symmetry. Consequently, the transition takes place in the size range from 300 to 400 km, or on the S-axis between the points 7.48…7.6.
We see that the model value of 7.86 obtained by us has a deviation of only 0.26 orders of magnitude from the right boundary of the empirically determined interval. At forty orders of magnitude, this gives an error of less than 1%. This is an amazing result!
This result is even more surprising if you use the following calculation.
THE SECOND VARIANT OF THE CALCULATION OF THE TRANSITION POINTS. It is well known that the size of the Metagalaxy (the right boundary of the S-interval - point C) is still being refined. Therefore, it is hardly correct to use it for a precise calculation.
However, the left boundary of the S-interval (fundamental length - point 0) is still not in doubt. Equally reliable is the empirically obtained boundary of the transition from strong interactions to electromagnetic interactions (point a = 2.2 × \(10^{-13}\) cm, i.e., \(10^{-12.66}\) cm).
If we take the scaled length from point 0 to point A as a reference (32.8 - 12.66 = 20.14) and back it off to the right two times, we get a new partition and a new value for point B.
Point B = (-12.66) + 20.14 = 7.48.
The degree of ten at point B (107.48cm) gives a cosmic size of 300 km, which is larger than the size of chaotic Amalthea (265 km) but smaller than the size of spherical Mimas (390 km). Therefore, it is this size (~300 km) that can be considered the TRANSITION from electromagnetic forces to gravitational forces. In this case, satellites and small planets with sizes smaller than 300 km should be shapeless bodies, but planets with diameters of 300 km and above should be spherical. Let us summarize the model calculations. Both calculations determine the value of the transition point from the electromagnetic interval (II) to the gravitational interval (I) in the range of 300-700 km, which agrees with empirical data. At the same time, complex calculations of the coordinate of this transition, made in due time by the classical way32 gave a value of …2800 km. It follows that the HU model allows us to obtain more accurate boundaries than - classical physics. Based on the more precise coordinates of the first third of the interval (point a) obtained (according to the second variant of calculation), we can specify the model size of the Metagalaxy (point C). It is equal to:
-32.8 + 20.14 - 3 = -3.8 + 60.42 = 27.62.
This degree (27.62) corresponds to a size of 4.2 x \(10^{27}\) cm, which is at least a factor of 2 smaller than the theoretical cosmological size of the Metagalaxy.
However, it is not necessarily that the size of \(10^{27.62}\) cm is the size of the Metagalaxy. It is possible that this is only the boundary of gravitational forces - a kind of GRAVITATIONAL HORIZON of the Metagalaxy, beyond which gravitation is no longer able to form any structures, and they are formed by other, “meta-metagalactic” forces, which, by the way, can, like strong interactions, occupy on the S-axis only 0.5 orders of magnitude, i.e. the range from 5 × \(10^{27}\) to 15 × \(10^{27}\) cm.
So, even if we do not change the right boundary of the S-interval of the Universe (calculated according to the first variant), then with an error of less than 1% we will get the left and right scaling boundary of the dominant influence on matter - electromagnetic forces - by simple arithmetic division of the S-interval into three sections. Already this result is phenomenal in itself, because the whole “theory” proceeds from the simple idea of scale symmetry, and the whole “calculation” - from the division of the segment into three equal parts accessible to a schoolboy. No matter how ridiculously simple this approach is, it gives such an accurate result that there is an assumption of much simpler laws of the Universe structure than even the most fantastic mind can assume. After all, at quite reasonable correction (calculation according to the second variant) we almost without error find the order of the boundary size between electromagnetic and gravitational interaction - 7.48.
It is asked, whence comes in nature such high accuracy of division of the whole S-interval into three equal sections?
Concluding this section, let us pay attention to one more feature of the obtained scaling scheme of interactions (see Fig. 1.9). The symmetry of the arrangement of interactions on the S-axis is “broken”: at the junction of the weak and electromagnetic interactions, strong interactions dominate on a narrow scale band of 0.5 orders of magnitude (point a). Then at the junction of the electromagnetic and gravitational interactions one can also PROPOSE the existence of a similar “strip” (point B) occupied by some FIFTH force.
It would seem that there is no fifth force in nature. What does this indicate? Either the scale symmetry is broken, this violation is global in nature. Or the FIFTH force exists in Nature, but has not been detected in the experiment so far, because it acts around point B (~300 km) in a narrow scale range of only half an order of magnitude. It is possible that, just as strong interactions are “hidden” in the depths of atoms, so the fifth force is “hidden” in the depths of stars (and planets?).
And in this case, it is the fifth force that leads to the gradual expansion of the Earth (in some hypotheses, it is this that explains the complementarity of continental boundaries rather than their “scattering”). And maybe it is the fifth force that leads to supernovae explosions and the appearance of planetary nebulae, and not the exhaustion of “stellar fuel” in their depths?
And maybe it is this “fifth force” that is responsible for the “expansion” of the life space of biological systems? It is it that gives them impulses for universal expansion?
-
Vladimirov Y. S. Space-time: explicit and hidden dimensions. Moscow: Nauka, 1989. С. 95-100. ↩
-
When two protons interact, the electric forces are \(10^{38}\) times greater than gravitational forces. ↩
-
It is not difficult, by the way, to calculate that the binding energy of the hydrogen atom is \(10^{5}\) times weaker than the binding energy of the simplest of nuclei - the deuteron, and at the same time the size of the deuteron is exactly the same number of times (\(10^{5}\) times) smaller than the size of the hydrogen atom. ↩
-
It is known27 from symmetry theory that the sphere has a limiting symmetry group: ∞/∞/μ−μ−μ (the sphere has axes and symmetry planes of infinite order) ↩
S-classifications cells of 5, 10 and 15 orders of magnitude
Recall that the S-cells in our work are the scale intervals in which the scale class of systems under consideration exists.
The boundaries of these cells are defined by the intersections of the model sinusoid of SWS with the S-axis. These boundaries separate thirteen main scale classes of universal systems (see Fig. 1.7). Like any other boundaries, they possess their own width, and scale boundaries are no exception. They form vestigial, transitional regions along the S-axis, spanning a length of one order.
The objects located in these “vestibules” can be attributed both to the previous scale, or size class, and to the subsequent one. Therefore, if in the dimensional zones of the corresponding intersections of the S-axis with SWS it is possible to establish the presence of any disputable (from the classification point of view) objects, it will be an indirect evidence of objectivity of SWS-classification.
So, SWS is only a model, but are there limits to the size of objects in reality? To answer this question, it is necessary to consider an array of empirical data.
LET’S START WITH BIOSYSTEMS. Precisely because the data on the boundary sizes of biosystems are the best known to science among all the objects along the S-axis.
Even V.I. Vernadsky was interested in the question of size limits for living systems. He took a virus as the smallest particle of living things. This choice is far from accidental and still has scientific force. The point is that the most important feature of living, distinguishing it from non-living, is the ability to reproduce a copy of itself, which is impossible without DNA (or RNA). It is viruses that are the minimum possible living systems - “a small amount of genetic material (DNA or RNA) enclosed in a protective protein shell.“33 Separately existing proteins are unable to reproduce, and there is no “naked”, separately existing DNA or RNA in nature either.
The smallest virus known to science, tobacco mosaic virus (TMV), is 1.5 × \(10^{-6}\) cm in size.
Viruses were practically the first to be discovered in 1852 by the Russian botanist Dmitiri Ivanovsky.
The size of the largest virus known to science is 5.3 × \(10^{-6}\) cm.³⁴ We see that in terms of size, these objects fall within the size range of the transition class (\(10^{-5} \times 10^{-6}\) cm), between class five and six, where the S-axis intersects with the SWS. Our approach suggests that all objects in this size range belong to the transitional “vestigial” class.
This is why there are still debates about whether viruses should be considered living or non-living systems. After all, “viruses… have only some, but not all, of the features characteristic of living organisms.”1 In particular, viruses cannot reproduce on their own; they need the environment of another, larger biosystem for this purpose.
So, since viruses are the smallest known protein-based living systems, we can define the lower dimensional limit for biosystems as \(10^{-5.5}\) cm (100–1000 angstroms).
Determining the size of the largest protein system, V.I. Vernadsky wrote: “The size of an organism is not accidental… The upper boundary is not accidental either: during the whole geological history it did not go beyond 200-300 m… we do not know the reason for it.”2
V.I.Vernadsky does not specify in this work what kind of bio objects he had in mind. However, it is known that some species of whales have the highest size nowadays - 28 m. The remains of diplodocs3 have been found, which were about 30 m. in size. It is obvious that no animal reached the sizes indicated by V.I. Vernadsky. Most likely, he meant plants. Indeed, the height of sequoias4 can reach 110 m, brown algae up to 100 m long and lianas up to 240 m long are known.
If we convert these sizes into logarithms, we almost exactly get the upper limit for integral biosystems equal to \(10^{4.5}\) cm. Thus, all protein holistic systems occupy the size range from \(10^{-5.5}\) to \(10^{4.5}\) cm (see Fig. 1.11).
The length of this range on the S-axis is exactly equal to ten orders of magnitude!
Another surprising thing is also surprising. If we consider as biosystems also their all kinds of “clusters”: herds, flocks, biocenosis and biosphere (as a functionally closed and integral system uniting everything), it turns out that they occupy five more orders on the S-axis.
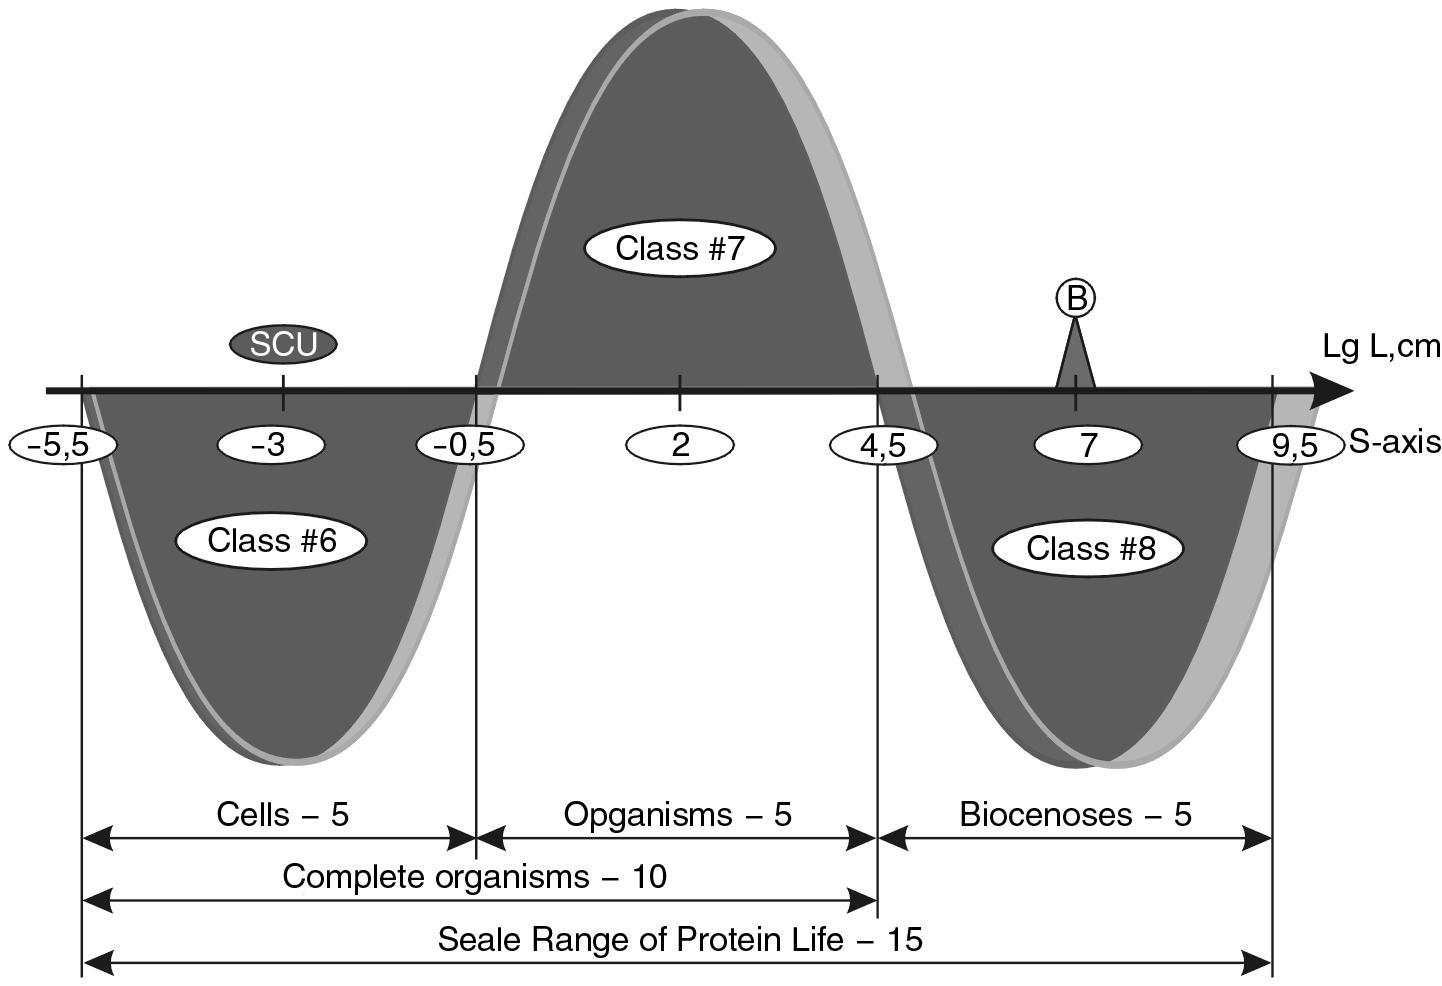

Fig. 1.12. Man by his size occupies the central place in the scale range of protein life on Earth. He is as many times larger than the smallest particle of life - virus, as many times smaller than the upper limit of life on Earth - Biosphere
After all, the “diameter” of the Biosphere is equal to the diameter of the Earth, including its atmosphere - 1.3 × \(10^{9}\) cm. If we take into account that viruses can survive outside the atmosphere, up to the magnetosphere, the size of the Biosphere reaches the theoretical classification boundary at the Stability Wave - \(10^{9.5}\) cm.
So, the whole scale range of protein life on the Earth occupies 15 = 10+5 orders of magnitude. Let us call this S-axis range the S-BIOLOGICAL SCALE DIAPASON (SBSD)
In the most general terms, the three intervals in the biological scale range can be labeled as cellular, organismal, and biocenosis scale classes of biosystems. The SBSD is divided into three areas (see Fig. 1.11) with five orders in each. The figure shows how clearly the dimensional boundaries of the classes commonly accepted in science coincide here with the boundaries of our model (points of intersection of the SWS with the S-axis).
The following scale structure (5+5)+5=15 can be distinguished on the example of consideration of the scale range of protein life. It can also be found in the scale ranges of other types of systems, as we will see in the future. This will serve as another confirmation that life is not something random in the Universe, since it is organized according to such global laws. So, the highest classification level is fifteen orders of magnitude. The boundaries of this scale interval determine the scale of existence of all forms of life in the Biosphere.
The next level is ten orders of magnitude, from viruses to algae in the Biosphere there are holistic organismal protein systems that have rigid internal structures, forms and contents.
Fundamentally different from them is the next largest class of protein systems, which occupies five orders of magnitude - these are biocenoses, which do not have rigid structures, forms and contents.
The same intervals on the S-axis, 5 orders of magnitude each, are occupied by cells - from viruses (\(10^{-5.5}\) cm) to large unicellular organisms (\(10^{-0.5}\) cm); and organisms - from primitive multicellular organisms (\(10^{-0.5}\) cm) to algae (\(10^{4.5}\) cm) (Fig. 1.11). Separately, it should be noted that man occupies on this scale interval of life an absolutely central position (see Fig. 1.12), since he is 7.5 orders of magnitude larger than viruses and the same number of orders of magnitude smaller than the Biosphere. We can speak all we want about the inadmissibility of anthropocentrism, but if in the HIERARCHICAL STRUCTURE OF THE BIOSPHERE HUMANITY occupies the CENTRAL PLACE, then this objective fact must be reckoned with. Let us consider to what extent the regularity revealed for biosystems is true for other large classes of objects of the Universe: stars, galaxies and atoms. Let us start with stars.
STARS (CLASS #9). According to the S - Wave of Stability - SWS model, all stars should be located in the scale interval \(10^{9.5}\)–\(10^{14.5}\) cm (Fig. 1.13). Let us see whether it is so in reality.
The diameter ranges for stars of different types can be determined from the data of the C. W. Allen handbook5:
- Supergiants - \(10^{12}\) to \(10^{14}\) cm;
- Giants - \(10^{11.5}\) to \(10^{12.5}\) cm;
- Dwarfs - \(10^{10}\) to \(10^{12}\) cm.
Thus, the size range for ordinary stars on the S-axis occupies 4 orders of magnitude from \(10^{10}\) to \(10^{14}\) cm. The mean scale value is \(10^{12}\) cm, which coincides exactly with the model stellar half-wave crest (see Fig. 1.7).
This range characterizes the bulk of stars. If we take into account that there are also very rare stars with smaller and larger (for example, the VV of Cepheus has a diameter of 4.7 × \(10^{14}\) cm.) sizes, the range can be extended in both directions by 0.5 orders of magnitude.
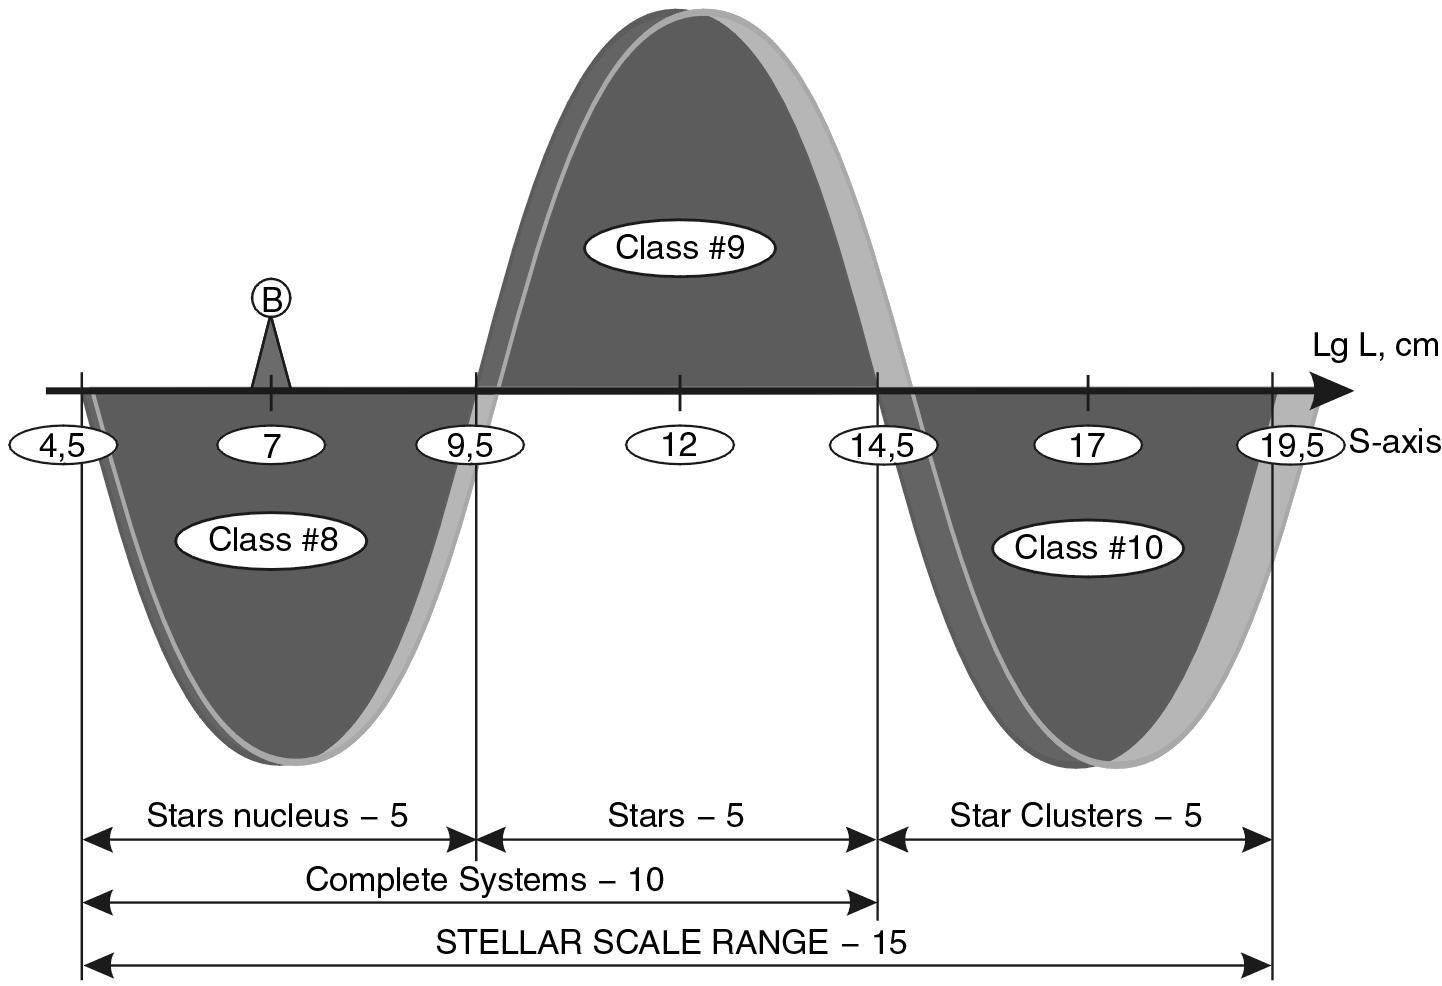
Fig. 1.13. Classification boundaries in the scale structure of the Universe
STAR SYSTEMS (CLASS #10). “Within the vast stellar system that is the galaxy, many stars are organized into smaller systems. Each of these systems can be thought of as a collective member of the galaxy. The smallest collective members of a galaxy are double and multiple stars. These are groups of two, three, four, etc. up to ten stars in which the stars are held close together by mutual attraction according to the law of universal gravitation”6. The larger collective members, which contain dozens or more stars, are clusters.
Stars in other galaxies also have the property of forming various systems from groups to clusters.
The distances in groups of stars are extremely different7: from close pairs (\(10^{12}\) cm) to wide pairs (\(10^{17}\) cm). There are two types of clusters: globular and diffuse. The diameters of scattered clusters8 range from \({6}\cdot{10^{18}}\) cm to \(10^{20}\) cm, and the number of stars in them from 20 to 2,000. Globular clusters have more stars: from \(10^{5}\) to \(10^{7}\), and their diameters range from \(10^{19}\) to \(10^{20}\) cm.
Thus, the extremely large star clusters have a size of \(10^{20}\) cm, which is exactly 10 orders of magnitude larger than the smallest stars.
It may seem that the author has arbitrarily limited stellar systems to clusters, since galaxies also consist of stars. However, the point is that a galaxy as a type of system differs from a star cluster in several fundamental respects.
- Star clusters do not have their own distinct structures (arms, disks, nuclei, halos, etc.). They are, figuratively speaking, swarms of stars, or colonies. Galaxies, like multicellular organisms, have their own life, which is not reducible to the combined functioning of individual stars.
- Star clusters are never found outside galaxies, although the sizes of some of them reach the size of dwarf elliptical galaxies. Galaxies, on the other hand, exist independently in outer space. To take an analogy. All systems are made up of atoms, but we clearly distinguish atomic assemblages in the form of a complex molecule or even a cell from a simple crystalline structure. Although galaxies are also ultimately made of atoms, it does not occur to us to call galaxies clusters of atoms.
In the following we will show that the boundary between star clusters and galaxies on the S-axis is common - it is the point of over S-axis cross-section with S - Wave of stability - SWS - \(10^{19.5 \pm 0.5}\) cm.
STAR NUCLEI (CLASS #8). Let us now consider the nuclear stars class. According to the S - Wave of stability - SWS model, it occupies the range from \(10^{4.5}\) to \(10^{9.5}\) cm. The characteristic point of the highest stability is the size of \(10^{7}\)- \(10^{8}\) cm (see Fig. 1.13).
The cores of stars can only be discussed theoretically, since even the core of the Sun, the closest star to us, has not yet been studied with instruments. However, since all stars sooner or later die, their remnants are always divided into two parts: outer and inner. The outer part, the envelope, collapses at different rates for stars of different masses. The inner part is compressed to a certain threshold, forming the dead (or dying) remnants of stars.
It can be conventionally assumed that these remnants are the nuclear formations of stars. They are divided mainly into three types: white dwarfs (WD), neutron stars (NS), and black holes (BH).
Small stars (with masses from 0.2 to 1.2 solar masses), shedding their envelopes, which gradually turn into planetary nebulae, become white dwarfs (WDs), whose sizes vary9 10 in the range of \(10^{8}\)-\(10^{10}\) cm.
More massive stars (with masses between 1.2 and 2.0 solar masses) explode as supernovae and their cores shrink to neutron stars (NSs), with average size estimates close to \(10^{7}\) cm.
The most massive stars (with masses greater than two solar masses) can form black holes (BHs) after the explosion; their sizes are estimated11 from \({3}\cdot{10^5}\) to \(10^{7}\) cm.
All of these objects are fundamentally different in their properties from ordinary stars. First, they no longer consist of atoms, but of their nuclei or elementary particles. Second, their radiation energy is no longer associated with thermonuclear synthesis, the main energy source of stars. The luminosity and color of these objects are also completely different from the luminosity and color of ordinary stars.
The bare nuclei of stars are a fundamentally different scale class (CLASS #8). Within this class, three types of bare nuclei occupy three regions:
- \(10^{5}\)-\(10^{7}\) cm - black holes (BHs);
- \(10^{7}\)-\(10^{8}\) cm - neutron stars (NS);
- \(10^{8}\)-\(10^{10}\) cm - white dwarfs (WD).
It is curious that the large-scale arrangement of stellar remnants on the S-axis mirrors the arrangement of the stars that produced them: the largest stars leave the smallest nuclei - BHs, and the smallest stars leave the largest of the nuclei - BCs.
So, the size limits for stellar nuclei occupy 5 orders of magnitude: from \(10^{5}\) to \(10^{10}\) cm. These limits are shifted relative to the model by 0.5 orders of magnitude to the right. The reason for this shift is probably due to the general rightward shift of all megamir dimensions, but we will consider this regularity further on. In general, the classification scheme for stars, like the biological scheme, consists of three intervals of 5 orders (see Fig. 1.13).
This range of 15 orders of magnitude can be called the stellar mass range, which is divided into three classes of 5 orders each: nuclear, stellar proper, and systemic stellar.
The above range characterizes the bulk of stars. If we take into account that there are also very rare stars with smaller and larger (For example, the VV of Cepheus has a diameter of 4.7 × \(10^{14}\) cm) sizes, the range can be extended in both directions by 0.5 orders of magnitude.
The reason for this shift is probably a general shift of all megaworld sizes to the right, but we will consider this regularity further on. In general, the classification scheme for stars, like the biological one, consists of three intervals of 5 orders (see Fig. 1.13).
This range of 15 orders of magnitude can be called the stellar scale range, which is divided into three classes of 5 orders of magnitude each: nuclear, stellar proper, and systemic stellar.
It should be noted that stellar pairs and groups (systems) actually begin with sizes of the order of \(10^{12}\) cm, which is 2.5 orders of magnitude to the left of their class boundary. However, this violation is apparent. After all, organisms also join into families, groups, herds and flocks, the sizes of which begin practically from the meter range (\(10^{2}\) cm). Which corresponds to the highest point of the crest of the wave of life (compare the two beginnings: for stars and for protein systems). Stars can form very close pairs too. This is a general systemic property to create all kinds of combinations of objects, and it does not depend on the size threshold.
We emphasize another thing: it was important for us to establish the size threshold to the left of which organisms (stars) could still exist on the S-axis, and to the right of which only their systems - biocenosis (star clusters) - can exist. Here we see that in the case of stars and in the case of organisms this threshold is modeled at the point of intersection of the right boundary of the middle class of the corresponding range with the S-axis (see Fig. 1.13).
Therefore, the interval of 15 orders of magnitude for both the Biosphere and the stars has an internal structure of 15 = 10+5 = (5+5)+5 and the same appearance: a central ridge and two half-waves on the left and right. This once again shows the fruitfulness of the wave model we have chosen.
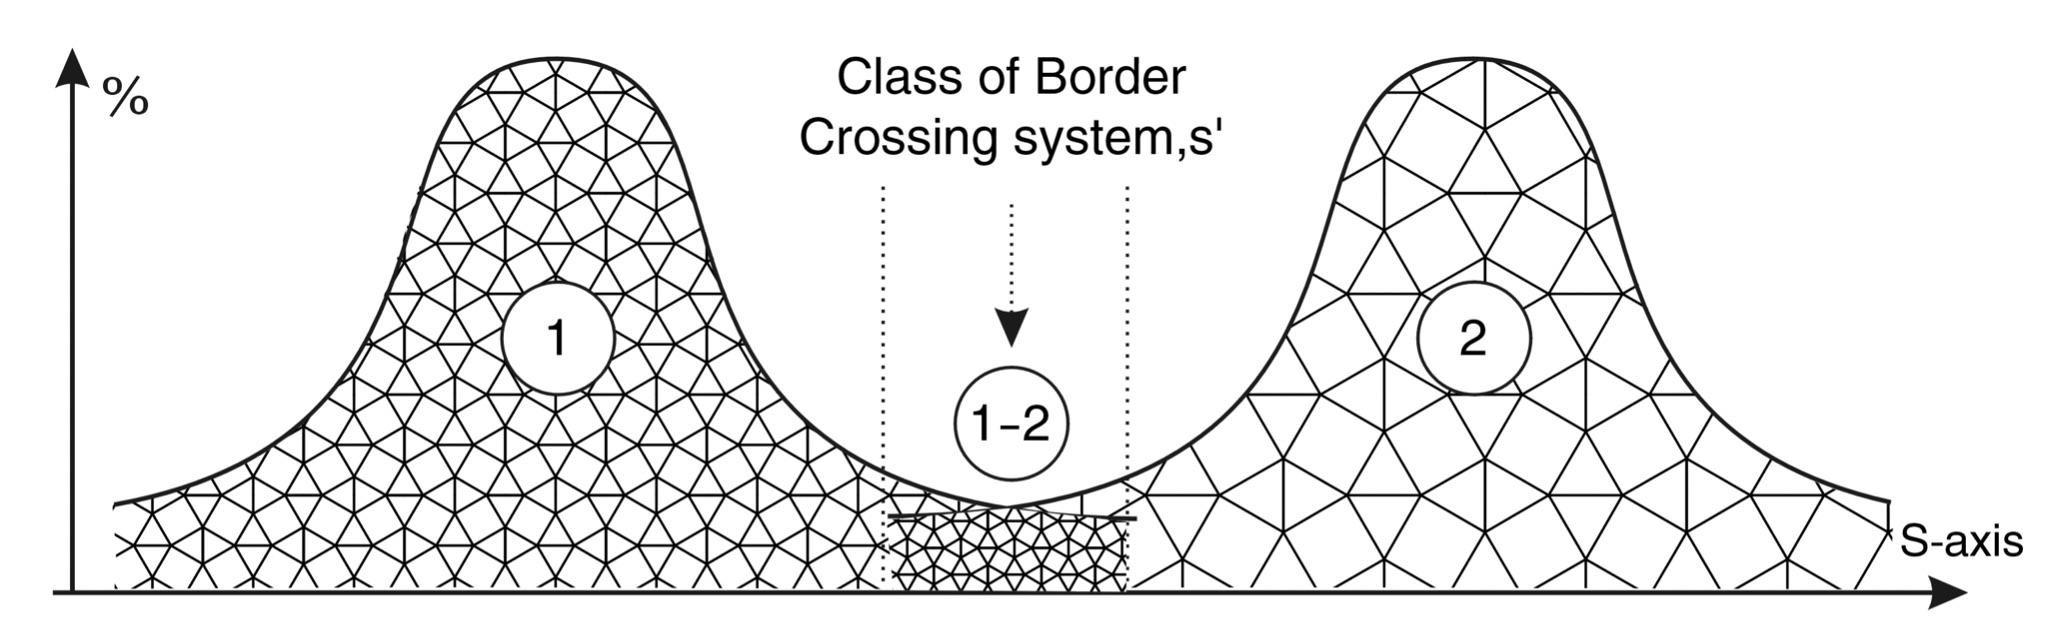 Fig. 1.14. Model of size distribution of objects in two boundary size classes. As a rule, there is a transition zone of one order of magnitude width at the boundary of classes, which is “populated” by disputable objects
So far we have considered scale intervals of classes. Let us now consider the boundary, for example, between two of them: No. 8 and No. 9. This will allow us to see the degree of accuracy of the S-classification proposed here.
We have already noted that astronomers do not find stars smaller than \(10^{10}\) cm. Such small stars are very difficult to see in the sky, so it is not excluded that it is still possible to meet a star whose size will be \(10^{9.5}\) cm. Especially since the determination of the diameters of stars is largely a theoretical rather than observational procedure. Consequently, we can PROPOSE that the point of intersection of the baseline SWS with the S-axis is the exact lower classification limit of the existence of stars.
A small methodological digression is necessary here. The point is that any classification boundary between neighboring classes in any parameter space, as we have already pointed out, is not a line but a strip. This means that there exists a region within such a parameter space in which one can find representatives shared by the class boundary (see Fig. 1.14).
The same is true for dimensions. Each of the neighboring classes has its own size range, the junction of these ranges represents a certain band on the S-axis - a Tambour Scale Interval of one order of magnitude. In such a tambour scale interval one can find both the largest representatives of the lower class and the smallest representatives of the upper class. It is almost obvious that the width of the transitional, vestigial class will depend on the sizes of the bordering classes. It is natural that for the analysis the selection of neighboring classes should be based on the principle of their identical scale extent.
Thus, for example, stars occur practically over 5 orders of magnitude. Their nuclei (white dwarfs, neutron stars and black holes) - also over 5 orders of magnitude. Hence, we are dealing with neighboring classes at scale levels. The boundary between these classes, as between any other classes, has a scale width of about 1 order of magnitude: from \(10^{9}\) to \(10^{10}\) cm, or \(10^{9.5 \pm 0.5}\) cm. This means that in this size range one can detect some stars that are almost not stars and some objects that are almost stars.
Consider, for example, the upper boundary of the nuclei of stars - white dwarfs, which, as we mentioned, have sizes differing by 2 orders of magnitude. The largest of them (\(10^{10}\) cm) “enter” an alien class - the stellar class. It is the largest of the white dwarfs, according to many astrophysicists, are in an intermediate state between stars and their cores. After all, it is in these stars that “hydrogen nuclear reactions occurring in a very thin spherical layer at the boundary of the dense degenerate matter of their interior and atmosphere,”12 are still going on.
The main energy of all white dwarfs is “only the result of the expenditure of thermal energy of atomic nuclei.” Thus, large white dwarfs, which belong to the size range \(10^{9}\)-\(10^{10}\) cm, are intermediate transitional systems, because they, on the one hand, are exhausted stars. On the other hand, they partially continue to emit stellar (nuclear) energy. This fact confirms the correctness of the theoretically defined classification boundary between stars and their nuclei.
Besides this example, there is another fact that shows the reality of the size threshold between the two classes revealed in the model. It is interesting that this fact refers to completely different space systems - planets.
PLANETS (CLASS # 8). We only have the opportunity to study the planets of the solar system. Therefore, the statistical generalization we can make is not very representative. However, because of the importance of these astronomical bodies to us, we will still look at how their sizes are related to Stability Wave (SW).
The smallest independent planet is Mercury with a diameter of 0.38 × \(10^{9}\) cm, the largest is Jupiter, its diameter is just over \(10^{10}\) cm. According to the location of orbits around the Sun (inside or outside the asteroid ring), all planets can be subdivided into two groups:
Earth-group planets
- Mercury 0.485 × \(10^{9}\) cm
- Venus 1.210 × \(10^{9}\) cm
- Earth 1.276 × \(10^{9}\) cm
- Mars 0.679 × \(10^{9}\) cm
The planets of the Jupiter group
- Jupiter 1.426 × \(10^{10}\) cm
- Saturn 1.202 × \(10^{10}\) cm
- Uranus 0.490 × \(10^{10}\) cm
- Neptune 0.502 × \(10^{10}\) cm
- Pluto 0.640 × \(10^{9}\) cm
Between the orbits of these two groups there is an “empty” orbit filled with asteroids and rocks, which serves as a natural “natural boundary” separating the two types of planets. The laws of diameters of planetary orbits are a separate topic. Here we will turn to the fundamental physical difference between the planets of these two groups. Planets of the Earth group are solid bodies with a density greater than 2 g/cm3 (up to 5.5 g/cm3 ). The planets of the Jupiter group can be divided by physical properties into giant planets (gas balls with a density up to 2 g/cm3, close to the density of water) and the small solid planet Pluto.
If we arrange all the planets of the Solar System according to their sizes on the S-axis, they will occupy there two almost identical intervals of 0.5 orders of magnitude (see Fig. 1.15). Common for all solid planets is that their diameter does not exceed the value of \(10^{9.5}\) cm, the model boundary on the SW between dense nuclear formations and rarefied gaseous star formations. All planets in the Jupiter group are larger than this value -- except Pluto, and it is Pluto that is the exception in group II. It has a solid surface and a density greater than 2 g/cm3.
Here an interesting PROPOSITION arises. The fact is that Pluto is the outermost planet in the solar system. From Jupiter onward from the Sun, all planets are composed of light elements of the PERIODIC TABLE OF ELEMENTS (PTE) - all except Pluto, which is composed of heavy elements. This planet falls out of the general pattern of differentiation of protoplanetary cloud matter (light elements from outside the asteroid’s ring) that many cosmogonic theories recognize. There is a problem with the appearance of Pluto’s solid matter at the boundary of this gas region. We have to invent versions of Pluto’s capture from other stellar systems.
However, we note that Pluto’s physical properties do not fall out of the scaling pattern at all (see Fig. 1.15).
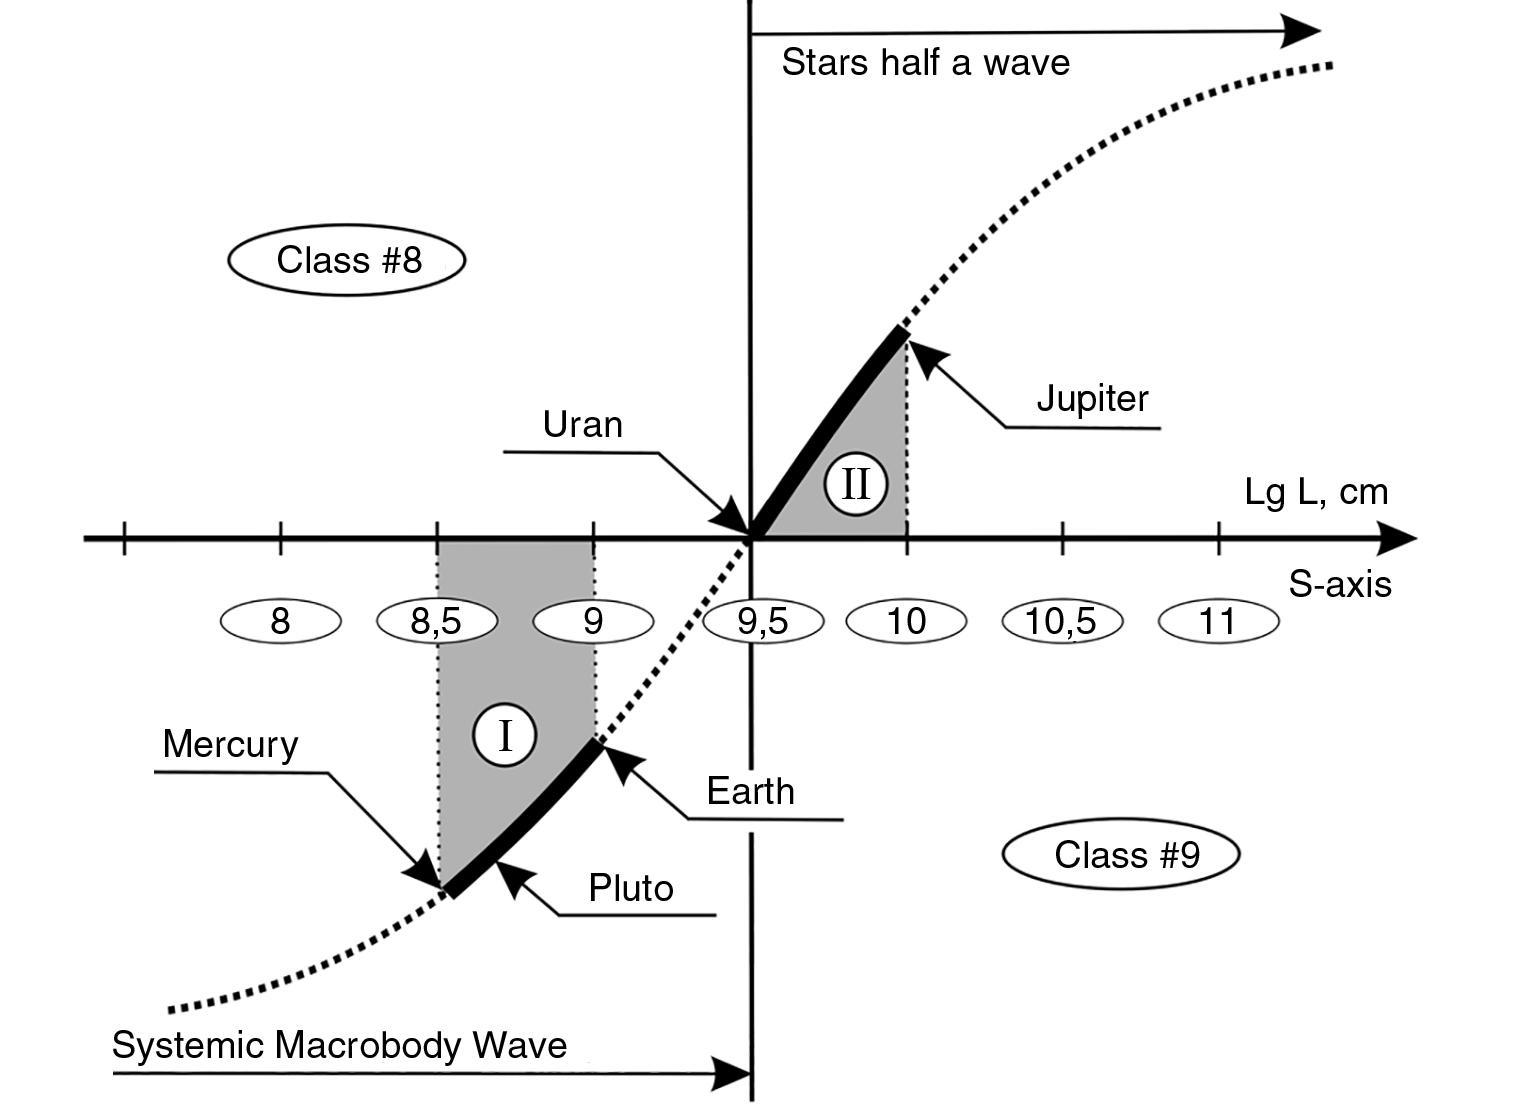 Fig. 1.15. S-classification of the planets of the Solar System. I - group of solid planets with density higher than 2 g/cm3. II - group of gaseous planets with density below 2 g/cm3. A scale periodicity of 0.5 orders of magnitude is evident
The question arises: is it a coincidence that the solar system is so organized that, regardless of orbit, all planets with sizes less than \(10^{9.5}\) cm are solids and those with sizes greater than \(10^{9.5}\) cm are gaseous (star-like)?
So, our PROPOSITION is reduced to the following: the place of a planet in three-dimensional space does not play the same essential role as its position in scale space. According to our model, if the size of the planet corresponds to the class of star nuclei, it is a solid bod. If its size refers to the class of stars themselves, it is a gaseous body.
Our model also reveals an additional regularity (see Fig. 1.15), which is very difficult to explain from the standpoint of the traditional theory of planetary formation in the solar system. It consists in the fact that the location of both groups of planets on the S-axis clearly shows 3 scaling intervals of about 0.5 orders of magnitude each. The first half-order is populated by planets of the Earth group (I) and Pluto, the second half-order is absolutely empty, the third half-order is populated by planets of the Jupiter group (II). The smallest planet of the Earth group - Mercury is close to the left boundary of the interval of Group I planets, i.e. to the S-axis point - 5 × \(10^{8}\) cm. The smallest of the gaseous planets of the Jupiterian group - Uranus is also close to the left boundary of the interval of group II planets, i.e. to the point of S-axis - 5 × \(10^{9}\) cm. Therefore, we can confidently assert that the left boundaries of the two planetary groups, according to empirical data, are located on the S-axis through one order of magnitude. Similarly, the largest planet of the inner group, the Earth, closes the interval I on the right, with its diameter 10 times smaller than that of Jupiter with an accuracy of 1%. Consequently, the right boundaries of intervals I and II on the S-axis are also 1 order of magnitude apart and with good accuracy.
Based on traditional approaches, how can the obvious fact that the sizes of the two types of planets occupy on the S-axis two intervals of 0.5 orders of magnitude with an empty gap between them of another 0.5 orders of magnitude be explained? Could the fact that the S-axis crosses the EI at the point where solid planets like the Earth no longer occur and gaseous, star-like planets like Jupiter begin be passed by?
Summarizing everything, we can PROPOSE that not only the planets of the Solar System, but also the planets of all systems of the Universe are divided into two classes similarly to the planets of the Solar System. And ALL PLANETS OF THE UNIVERSE WHICH SIZE IS LESS THAN \(10^{9.5}\) cm, WILL BE LIKE PLANETS OF THE EARTH GROUP, AND ALL PLANETS WHICH SIZE IS LARGER THAN THIS RANGE, WILL HAVE A GAS-BRASED COMPOSITION.
By the way, Jupiter emits 60% more energy than it receives from the Sun, which is why it is often called “almost a star”. This is not surprising from the point of view of the classification boundaries of the Stability Wave, because in terms of its size it already belongs to the star class (CLASS #9: from \(10^{9.5}\) cm to \(10^{14.5}\) cm).
Our Earth is the largest planet of the first group, and its diameter is approaching star class. This, on the one hand, is remarkable, because it distinguishes it among other planets. However, it is worth considering whether there is no danger for the Earth in the fact that its size is very close to some transitional boundary of steady state for cosmic bodies. Thus, having examined “in a magnifying glass” one of the model classification boundaries, i.e., the point of intersection of the SW with the S-axis, we are convinced that it reflects quite well the real classification boundaries in the Universe.
Turning to the protein range, we recall that the dimensional boundary for the lower threshold of living systems is filled with viruses, which are still treated by various researchers as living or non-living systems. This indicates that this point of intersection of the SWS with the S-axis is also a real classification barrier for fundamentally different systems.
GALACTIC CLASSES #10, 11, 12. According to the SWS model, their objects occupy the interval from \(10^{14.5}\) to \(10^{28.2}\) cm (see Fig. 1.16). With \(10^{14.5}\) cm to \(10^{19.5}\) cm being the nuclear class, or the class of galaxy nuclei - and \(10^{19.5}\) cm to \(10^{24.5}\) cm being the class of galaxies themselves, or the structural class. Then come a few more orders, like star clusters and biocenoses, which should be filled with some non-rigid and open systems of galaxies.
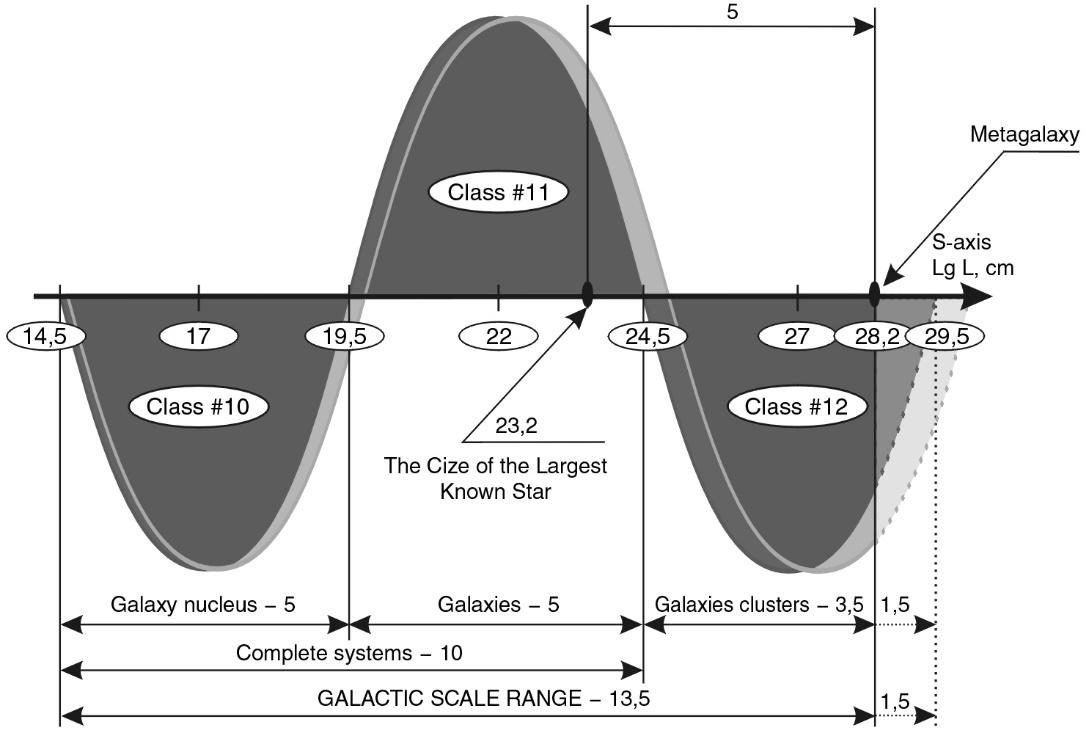 Fig. 1.16
Let us consider whether such a model division of the S-axis corresponds to the real difference in the properties of galaxy-class objects.
The total number of galaxies in the Metagalaxy is \(10^{10}\), which coincides surprisingly precisely with the main scale periodicity coefficient. The sizes of the most typical galaxies are enclosed in the range \(10^{21}\)-\(10^{23}\) cm 13. Hence, the average scale size for galaxies is \(10^{22}\) cm. Our own Galaxy belongs to very large systems. The diameter of its halo (a spherical cluster of tens of billions of stars) is \(10^{23}\) cm, and the thickness of the spiral disk is 15 times smaller: 6 × \(10^{21}\) cm 14.
Astronomers know several galaxies whose sizes are larger than ours: according to V. Zonn 15 - this is galaxy M101, its diameter is equal to 1.5 × \(10^{23}\) cm; according to B. A. Vorontsov-Velyaminov 16 - this is galaxy M31, its diameter is equal to 1.8 × \(10^{23}\) cm.
The mentioned sizes are the limit for the possible size of galaxies. Only hypergalaxies - several galaxies united by a common corona - have even larger sizes; B. A. Vorontsov-Velyaminov calls them “nests of galaxies”. Their sizes, however, are not much larger than the specified limit; according to B. A. Vorontsov-Velyaminov, they do not exceed 3 × \(10^{23}\) cm.
Thus, on the S-axis, ordinary galaxies occupy only 2 orders of magnitude from \(10^{21}\) to \(10^{23}\) cm. If we go toward even larger scales, the nests of galaxies are followed in size by groups with an average size of \(10^{24}\) cm and clusters with an average size of \(10^{25}\) cm. Clusters are the limit for the galactic class of systems, for they can still be formed by the galaxies’ own gravitational interaction. Beyond this threshold, the world of the Metagalactic substructure begins, the world of super clusters (\(10^{26}\) cm).
Let us now analyze the systems that are located on the S-axis to the left of the galactic “ridge.” In the range \(10^{20}\)- \(10^{21}\) cm there are so-called dwarf galaxies 17. Taking into account that the smaller the galaxy, the more difficult it is to detect on the sky, it is purely theoretical that galaxies with sizes smaller than \(10^{20}\) cm can be encountered. However, astronomers already in the size zone of the transition class \(10^{19}\)- \(10^{20}\) cm are hesitant to assign systems of such sizes to different classes.
There are dwarf galaxies that look more like giant globular clusters of stars - they can be attributed both to the class of galaxies and to the class of star clusters located in intergalactic space. According to some features: the presence of gas and very hot stars, astronomers still refer these controversial systems to the class of dwarf galaxies, not to the class of globular clusters. However, according to the testimony of B. A. Vorontsov Velyaminov18, there are stellar systems of such sizes that have neither gas nor hot stars.
On the other hand, giant globular clusters reaching sizes of \({1.5}\cdot{10^{20}}\) cm are found within galaxies, i.e., giant clusters “enter” the purely galactic class by their size (#11). Therefore, stellar systems from this size region clearly belong to the controversial “transitional class.”
Thus, in the transition zone with a length of one order of magnitude, we have giant globular star clusters on the side of smaller systems, and dwarf galaxies on the side of larger systems. This confirms the correctness of the choice of the classification boundary in the SW model at \(10^{19.5}\) cm. “To the left” and “to the right” of this boundary within half an order of magnitude, we find controversial systems.
In addition, we should also note a very important “gap” of properties at this boundary: “…It is clear that there is a great difference between elliptical galaxies and globular clusters. It is certain that there is no reason at all to believe that globular clusters are extensions of elliptical galaxies. On the contrary, the fact that the average density of globular clusters is much greater than that of elliptical galaxies simply indicates that these clusters must have originated in lower density systems. If one cluster were an extension of another, we should find globular clusters with the same density as in the systems themselves…”19
So, within the galactic ridge (CLASS #11), we have galaxy-type systems whose origin and basic properties may have a common basis.
Descending from the ridge (\(10^{22}\) cm) to the left, as we pass through the \(10^{19.5}\) cm dimension, we enter the region of systems of a completely different property - star clusters.
Descending from the ridge to the right, we find that literally one order of magnitude later, the existence of galaxies ends and the region of existence of close pairs, nests, and other complete systems of galaxies begins.
Not a single galaxy has been found so far whose size would reach \(10^{24.5}\) cm - the upper model limit of their existence. This discrepancy between the model and the actual facts somewhat breaks the above-mentioned regularity, according to which the structural galaxy class should occupy about five orders of magnitude. However, if we remember that supergiant stars, like super long algae and vines, are extremely rare phenomena in their classes, it is possible that superlarge galaxies, whose sizes should be 10 times larger than such a giant as M31, have not yet been detected or have some unusual, for example elongated, shape (remember about vines). By the way, chains of galaxies are indeed detected by observers, so we may not draw final conclusions here yet. Also remarkable is the fact that the largest protein organisms do not exceed the size of 3 × \(10^{3}\) cm (hence, they are located 1.5 orders of magnitude to the right of the upper point of the model SW ridge). Similarly, the largest galaxies do not exceed by 1.5 orders of magnitude the coordinate of the top ridge of their class: the nests of galaxies have a maximum size of 3 × \(10^{23}\) cm, and the top point of the ridge is \(10^{22}\) cm.
Here we see a similar classification pattern with a coefficient of 20 orders of magnitude.
Now let’s get down to the galactic “basement”.
NUCLEI OF GALAXIES (CLASS #10). According to the model, on the S-axis it occupies five orders of magnitude from \(10^{14.5}\) cm to \(10^{19.5}\) cm. The average size of galaxy nuclei is \(10^{17}\) cm (see Fig. 1.16). Let us analyze the astrophysical data to understand which real systems have such sizes and what are their main distinguishing properties. According to E. J. Vilkovisy20, galaxy nuclei consist of an inner structure (the nucleus proper), whose dimensions lie in the range \(10^{17}\)- \(10^{18}\) cm, and an outer shell (3 × \(10^{18}\)- \(10^{20}\) cm). According to B. Balik and R. Brown21, the nucleus of our Galaxy is a very compact radio source with dimensions of the order of \(10^{16}\) cm. It should be noted that galactic nuclei are not just central clusters of stars, but special objects with specific properties that cannot be explained only from the assumption that they are filled with clusters of stars. For example, in the Andromeda Nebula, the nucleus, with a size of about \(10^{19}\) cm, has a density 1,000,000 times higher than the galactic average22. In addition, active galactic nuclei are sources of powerful radiation and matter ejections, and it is assumed that giant galactic black holes are located in them.
In younger galaxies, such as the Seyfert galaxies, the nuclei “are covered by violent gas movements… Here the phenomena are played out in their entirety, which in galactic nuclei and the Andromeda Nebula have already subsided and are preserved in incomparably smaller volumes.”23 V. L. Ginzburg24 notes that “galactic nuclei and quasars may well be supermassive plasma bodies (M ~ 109 M☉; r ~ 1017 cm) with large internal rotational motions and magnetic fields…” The youngest galaxies at the greatest distance from us are the so-called quasars (QSOs - quasi-stellar objects). The brightness of their luminescence indicates the activity of the processes going on there and overshadows the galaxy itself, the core of which are quasars. Their sizes, according to B. A. Vorontsov-Velyaminov25, lie in the range \(10^{15}\)- \(10^{17}\) cm, and according to Vilikovisky26 - \(10^{14}\)- \(10^{17}\) cm. According to other data27, the sizes of quasars can reach even larger values: quasar 3C345 has a cross section of 6 × \(10^{18}\) cm, and typical sizes lie in the range 3 × \(10^{18}\)- 6 × \(10^{19}\) cm. This discrepancy in the estimate of the average size of quasars is probably due primarily to the fact that they represent a heterogeneous multilayer formation with a sparse envelope, nuclear region and core. Each of the experts choose one or another formation as the boundary. However, it is important to note, according to the most extreme estimates, the values of quasar diameters do not go out of the range \(10^{14}\)- 6 × \(10^{19}\) cm, which practically coincides with the boundaries of the class of galaxy nuclei (CLASS #10), determined with the help of the SW (see above).
The coincidence of astrophysical classifications and the SW model is especially clear in the boundary sizes. It is far from accidental that quasars, whose sizes sometimes fall in the range of the boundary range with stars (on the left boundary of CLASS #10: \(10^{14}\)- \(10^{15}\) cm), were called quasi-stellar objects, and there is still a discussion about their belonging to our Galaxy and their possible stellar nature. In any case, it is not without reason that V.L. Ginzburg’s assumption that quasars are plasma bodies (which relates them to stars) appeared.
On the right boundary of CLASS #10 there are very large and active galaxy nuclei (\(10^{19}\)- \(10^{20}\) cm), which many astronomers define as transitional forms - galaxy embryos. The presence of these controversial objects at the intersection points of the SW and S-axis is a sure sign that the transition ranges are defined in the model correctly enough.
Thus, all astronomical data indicate that nuclear-galactic formations, including quasars, by their sizes fit exactly into the interval assigned to them in the model: from \(10^{14.5}\) to \(10^{19.5}\) cm, and their average size corresponds to the lowest point of the model half-wave (see Fig. 1.16). Thus, the classification scheme 10 = 5+5 is also acceptable for galaxies (although, perhaps, with a slight deviation), and its boundaries are associated with the S-axis intersection points of the stability Wave. Is the scheme 10+5 correct here, as in the Macro-interval?
If we add 5 orders of magnitude to the upper theoretical limit of the galactic ridge, we get a size of \(10^{29.5}\) cm, which is far beyond the size of the Metagalaxy, hence the scheme is incorrect. However, if we add the same 5 orders of magnitude (see Fig. 1.16) to the size of the largest known galaxy, M31, with a diameter of 1.8 × \(10^{23}\) cm, we get a size of 1.8 × \(10^{28}\) cm, which is close to the size limit for the entire system of galaxies, the Metagalaxy, to within a factor.
It is possible that the obtained ratio of \(10^{5}\) between the maximum galaxy size and the size of the Metagalaxy is a purely random coincidence. It is possible that there is some regularity in it, about which we cannot say anything yet. Since the galactic CLASS #11 proper is almost the rightmost class for the whole of our Universe, the edge features may impose their imprints on its structure.
Let us consider two possible variants of the classification partitioning of the S-range (SR) for galaxies.
The first variant: (5+5)+3, 7 is actual, but with broken periodicity in the third five-order block.
The second option: (5+5)+(3,7-5). What does the scale interval (3.7-5) mean?
We proceed from the FORMAL PROPOSITION that the last five-order class of galactic MD, which does not fit completely on the S-axis due to the natural boundary of the Metagalaxy, can be postponed according to the scheme (3,7-5). Moreover, the fragment (-5) is postponed from the Metagalactic 28.2 boundary in the opposite direction, which gives a point on the S-axis (28.2-5=23.2) corresponding to the maximum size for galaxies (see Fig. 1.16). Taking into account that science has practically only just begun to study galaxies, we can take our time with final conclusions and tentatively accept, albeit with some distortions and deviations, that for galaxies, the use of the SW classification model with all its characteristic points is valid.
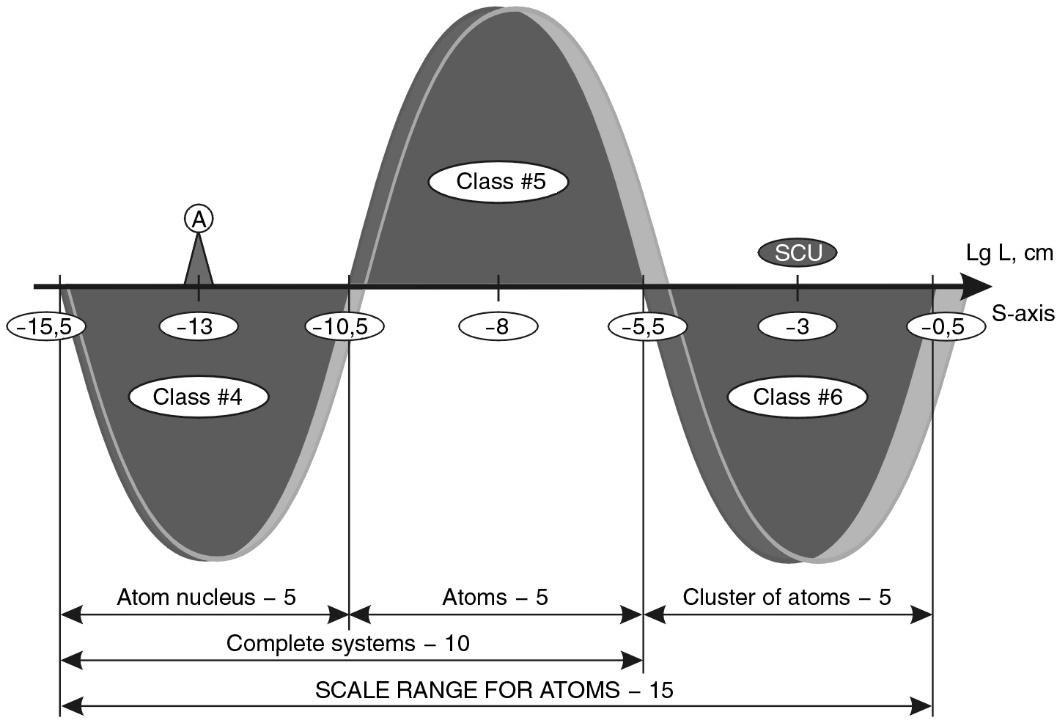 Fig. 1.17
Let us call the scale range from \(10^{14.5}\) to \(10^{28.2}\) cm the galactic scale range, which is divided into two intervals of 5 orders and one interval of 3.7 orders.
ATOMS (CLASSES #4-6). In accordance with the scheme adopted above and the position on the S-axis of the central element of the atomic class proper - the hydrogen atom - the atomic scale range should have boundaries from \(10^{-15.5}\) to \(10^{-0.5}\) cm (see Fig. 1.17) and be subdivided into three classes of 5 orders of magnitude each:
- #4. Class of atomic nuclei: \(10^{-15.5}\)- \(10^{-10.5}\) cm;
- #5. Properly atomic: \(10^{-10.5}\)- \(10^{-5.5}\) cm;
- #6. Systemically atomic: \(10^{-5.5}\)- \(10^{-0.5}\) cm.
The sizes of transient objects found in various traditional classifications should be related to our model points: \(10^{-15.5}\), \(10^{-10.5}\), and \(10^{-5.5}\) cm. Let’s see if this is the case?
Let’s start with CLASS #5 - the PROPERLY ATOMIC CLASS. Its center according to the model corresponds to the size \(10^{-8}\).
By the way, this size (\(10^{-8}\) cm) is so characteristic of atomic physics that it got its own name - “angstrom”
The right boundary - \(10^{-5.5}\) cm, the left boundary - \(10^{-10.5}\) cm. Recall that the most common element in the Universe is hydrogen. The diameter of a hydrogen atom is approximately 1.4 × \(10^{-8}\) cm. Several other most common chemical elements have the same atomic diameter.
The diameters of atoms of all other elements do not exceed \(10^{-7}\) cm. Atoms to the right of this size are not found in nature. The class boundary expected by the model is \(10^{-5.5}\) cm. The deviation is significant - one and a half orders of magnitude. These one and a half orders of magnitude are filled in nature with molecules of all levels of complexity: from simple to protein and high polymers.28
Let us now consider the left dimensional limit of the existence of atoms - \(10^{-10.5}\) cm. On Earth, atoms with this size can be obtained only in artificial conditions, when one of the electrons is replaced by a negative meson. Such systems are called mesoatoms29. Their diameters are very close to the transition size: for mesohydrogen - about 5 × \(10^{-11}\) cm (or \(10^{-10.5}\) cm).
“The main feature of mesohydrogen is that the radius of the meson orbit is about 200 times smaller than the Bohr radius. Therefore, the positive charge of the proton is very shielded, and mesohydrogen in many respects behaves as a neutral particle similar to the neutron.”30 Here the transitive essence of mesoatoms is clearly manifested: on the one hand it is an atom, and on the other hand - a particle, as if a neutron.
In space in the region of transitional sizes (\(10^{-10.5}\) cm) there are atoms compressed in the interior of white dwarfs. Calculations show31 that the distances between atoms decrease when atoms are compressed in the interior of white dwarfs. At distances of about \(10^{-10}\) cm, the electron shells of atoms no longer exist - they are “stripped off”, and the nuclei of atoms become “bare”. It is at such distances between atoms that the degenerate state of gas32 described by Fermi statistics occurs.
Thus, the scale limits of the existence of atoms in their simple and molecular forms coincide with the model ones (\(10^{-10.5}\)…\(10^{-5.5}\) cm). However, if we compare the large-scale range of existence of atoms with the large-scale range of existence of stars, we find a significant difference. For stars, we have some examples of supergiants reaching the upper threshold of the model class by their sizes. For atoms, we see that their sizes do not reach the upper model threshold (\(10^{-5.5}\) cm) by more than one order of magnitude.
Thus, the transition from systems of the atom type to systems of the nuclei type takes place at the boundary of two model classes of SW - \(10^{-10.5}\) cm, and this statement does not raise any objection. The upper model boundary of the atomic class raises certain doubts.
Only the following can be stated with absolute certainty. The right model boundary (about \(10^{-5.5}\) cm) limits in nature the size of systems consisting of atoms with individual differences in composition (biomacromolecules). In these systems, the appearance or disappearance of one atom leads to a qualitative change of the whole system.
NUCLEI OF ATOMS (CLASS #4). Using the technique of determining the radii of atomic nuclei33, we can obtain a fairly accurate diameter of the nucleus of the hydrogen atom proton. It is equal to 1.62 × \(10^{-13}\) cm. In addition to the fact that “…the radius of charge distribution inside the proton is equal to 0.8 × \(10^{-13}\) cm, the radius of magnetic moment distribution in the proton and neutron were approximately the same 0.8 × \(10^{-13}\) cm.”34 The diameters of the nuclei of all other atoms, determined by the simplified formula R = 1.3 × \(10^{-13}\) A1/3 cm adopted in nuclear physics, lie in the range from 2 to 15 fermi (where A is the number of nucleons in the atomic nucleus).
1 fermi = \(10^{-13}\) cm. Similarly to the angstrom (\(10^{-8}\) cm) in the structural class, the central dimension of the nuclear class, i.e., the dimension of highest stability, also has a proper name - “fermi”. This once again indirectly confirms the adequacy of the SW model to the real properties of matter.
As for the lower boundary of the nuclear subclass, according to M. A. Markov35, it belongs to the size of \(10^{-15.5}\) cm, which was the boundary of penetration into the microcosm. The range of sizes from \(10^{-15.5}\) to \(10^{-13}\) cm (according to M. A. Markov) is the world of strange particles, the world of details of the neutron and proton structure.
Strange particles in particle physics are called K-mesons and hyperons.
The maximum energies currently available (we are talking about the 1980s) in the laboratory are of the order of 1000 GeV, to which correspond the minimum distances of about \(10^{-17}\) cm36. The author provides that if experimental physics manages to penetrate into the depth of matter at least to \(10^{-18…20}\) cm, it will come in close contact with the internal structure of electrons. To the right of the center point (-13) of this CLASS #4 are all the nuclei whose maximum size is close to \(10^{-12}\) cm. So, CLASS #4 in the SW model corresponds to the features of the traditional systematization of the particle world. Its model center coincides with an important for physics size - “fermi.” Here also “dwells” the most stable particle of our world - the proton. To the left 2.5 orders of magnitude from the center is the world of strange particles. One order of magnitude to the right of the center is the nuclei of atoms.
It should only be noted that in the size range from 1.5 × \(10^{-12}\) cm to \(10^{-10.5}\) cm on the S-axis there is essentially an empty space, not filled with any natural formations and systems that would be well known to science. This is so strange, because nature does not tolerate emptiness, that there are two assumptions: either in this range is really very low stability of systems, or science has yet to discover a whole range of systems “missed” by it with these dimensions. Purely speculatively, one can PROPOSE that there may exist some giant nuclei or their complex nuclear clusters reaching sizes of \(10^{-10}\) cm. In addition, by analogy with the stellar scale range, one can PROPOSE that in this size range there exist size-limited “clusters” of electrons. After all, there are globular and scattered clusters of stars in a similar place in SWS.
Strange as it may seem, the least we can say about the system-atomic class, which presumably occupies 5 orders of magnitude from \(10^{-5.5}\) to \(10^{-0.5}\) cm (CLASS #6). By analogy with stars, we can PROPOSE that we are talking about some atomic clusters united by electromagnetic interactions, and the sizes of these clusters cannot exceed 5-10 mm.
Thus, we can confidently assert that the atomic scale range occupies at least 10 orders on the S-axis, which are subdivided into two classes of 5 orders each. Whether there is an additional third CLASS (No. 6) for the atomic scale range remains an open question.
Concluding this section, we have an opportunity to present the above-mentioned periodic classification of all systems of the Universe, which is based on the SWS model, but in a slightly different form (see Fig. 1.18).
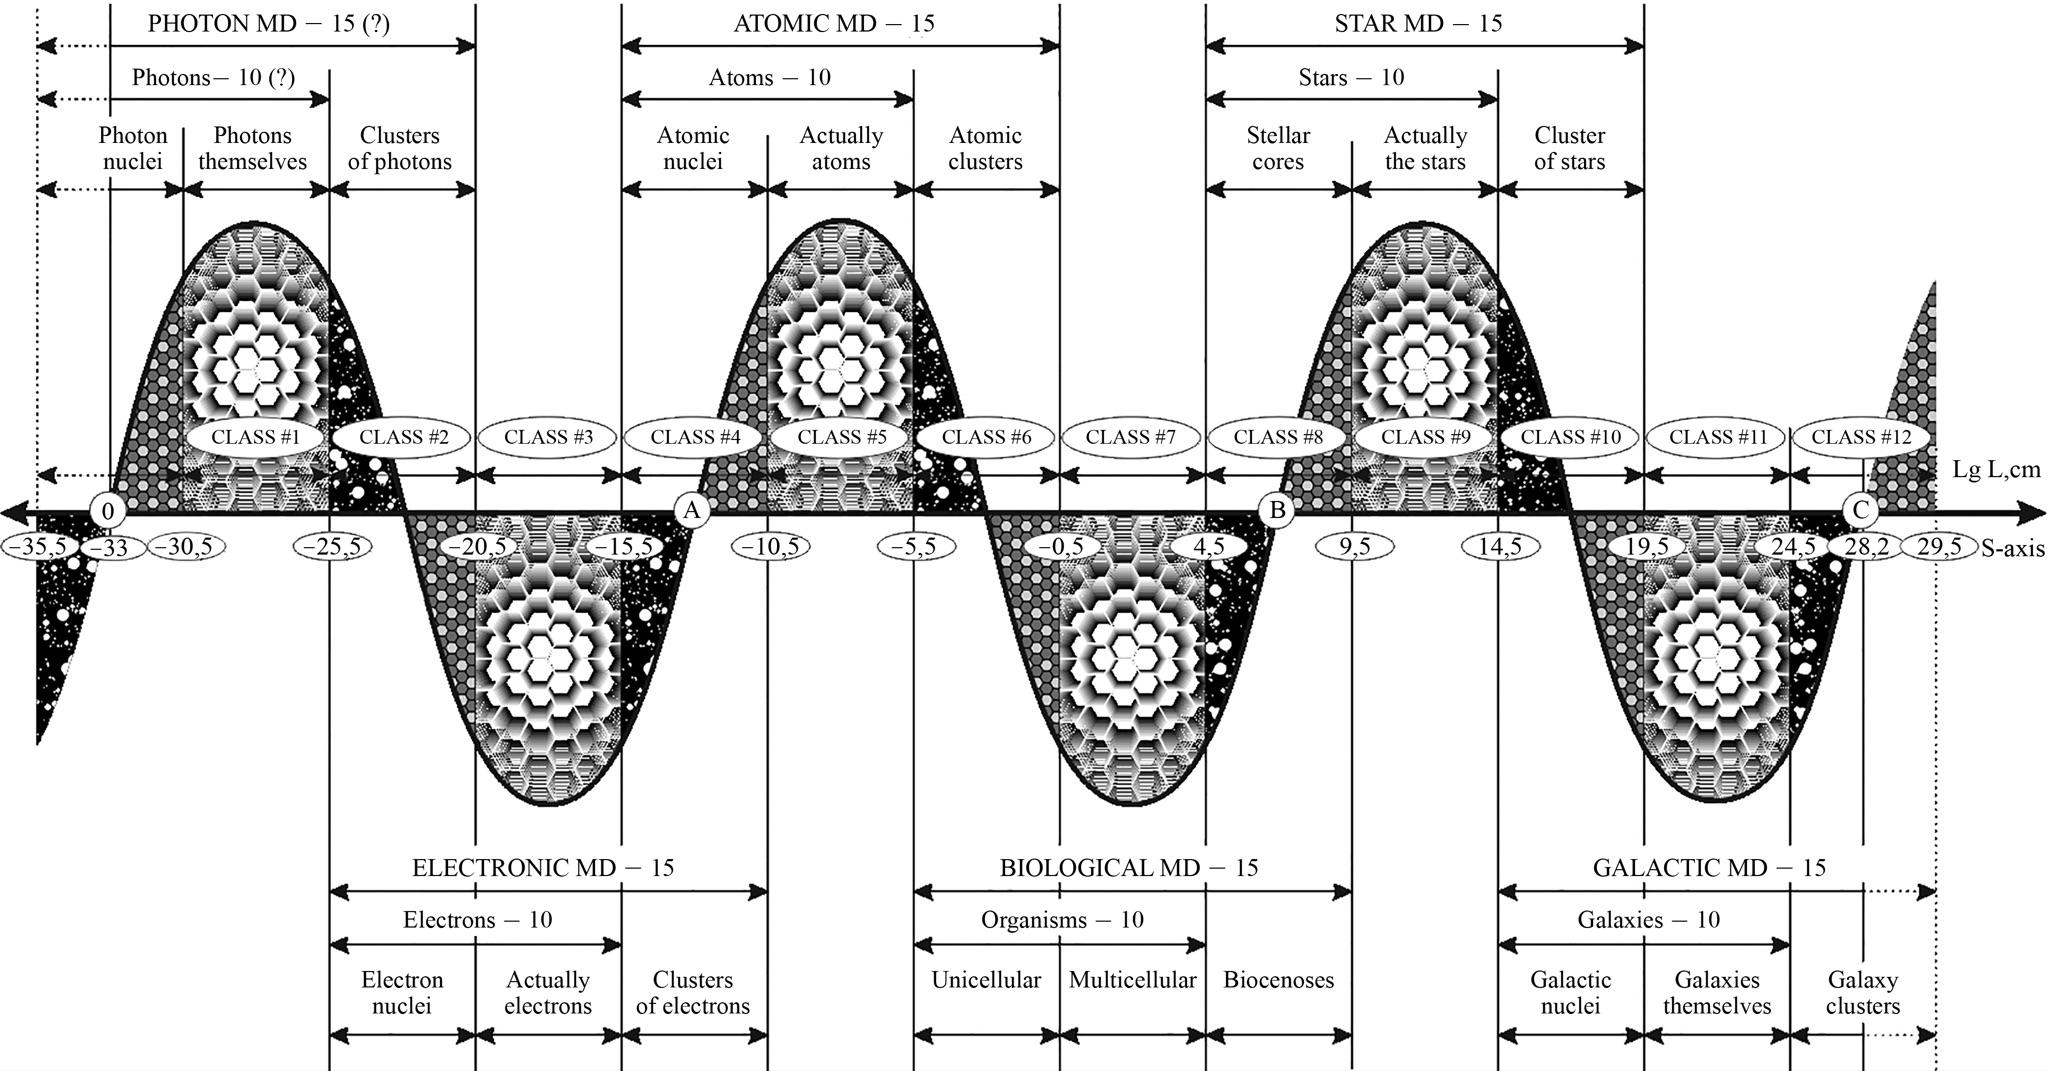 Fig. 1.18. General scale-classification scheme of the Universe objects. To create the best mnemonic image (as suggested by the editor), the sixth harmonic of scale fluctuations was used (see Section 2.5.1). The scaling length of each class is equal to five orders of magnitude. It can be seen that objects of different levels of the Universe can be present in the same scale class. For example, star clusters and galaxy nuclei are present in the same scale class #10, and electron clusters and atomic nuclei are present in the same scale class #4. We see that all 6 scale ranges (MDs) overlap each other, forming a giant scale chain of systems. Points 0, A, B, C are the points of division of the whole M-band into 3 main S-intervals, 20 orders of magnitude each: 0-A - Micro-interval, A-B - Macro-interval, B-C-Mega-interval. Different types of classes: nuclear class; structural class; system class.
Although our classification contains quite a few questions from the microworld dimensions and some relatively controversial boundaries; in general, it does not raise doubts. Since the errors and deviations are quite permissible with such a wide coverage of empirical material, and are not superimposed on each other, but mutually compensated, which leads to the preservation of a uniform periodicity throughout the S-axis. For completeness of the picture we will try here to fill the “holes” in the microworld region and to build in there two more HYPOTHETICAL scale ranges.
SUB-ELEMENTARY PARTICLES (CLASSES # 1-3). Moving along the S-axis to the region of even smaller sizes, we get into the world of structures never experimentally investigated by science. On this way we find a whole class of possible systems, about which we can only say the following.
The structural ridge closest to the atomic ridge has a coordinate of \(10^{-18}\) cm. We believe that it is “populated” by electrons. Most likely, it is in this size range that the structure of the electron can be detected in time. For “the question of the radius of the most “ancient” elementary particle - the electron - is still a mystery. Up to the smallest distances available with modern experimental techniques (\(10^{-15}\) cm), the electron behaves as a point particle.“37
This was written in 1972, and since then physicists have been able to penetrate 2 more orders of magnitude into the microcosm, but the structure of the electron still appears to be point-like.
On the basis of the SW model, its size may be of the order of \(10^{-18}\) cm with a nuclear core of \(10^{-23}\) cm (see Fig. 1.19). Then, by analogy with the previously identified S-Ranges, we can predict the existence of an Electron Scale Range with a length of 15 orders of magnitude. An even lighter, almost weightless particle-wave is the photon. According to the logic of the model, it has the only free place on the last, extremely left ridge of the SWS - \(10^{-23}\) cm.
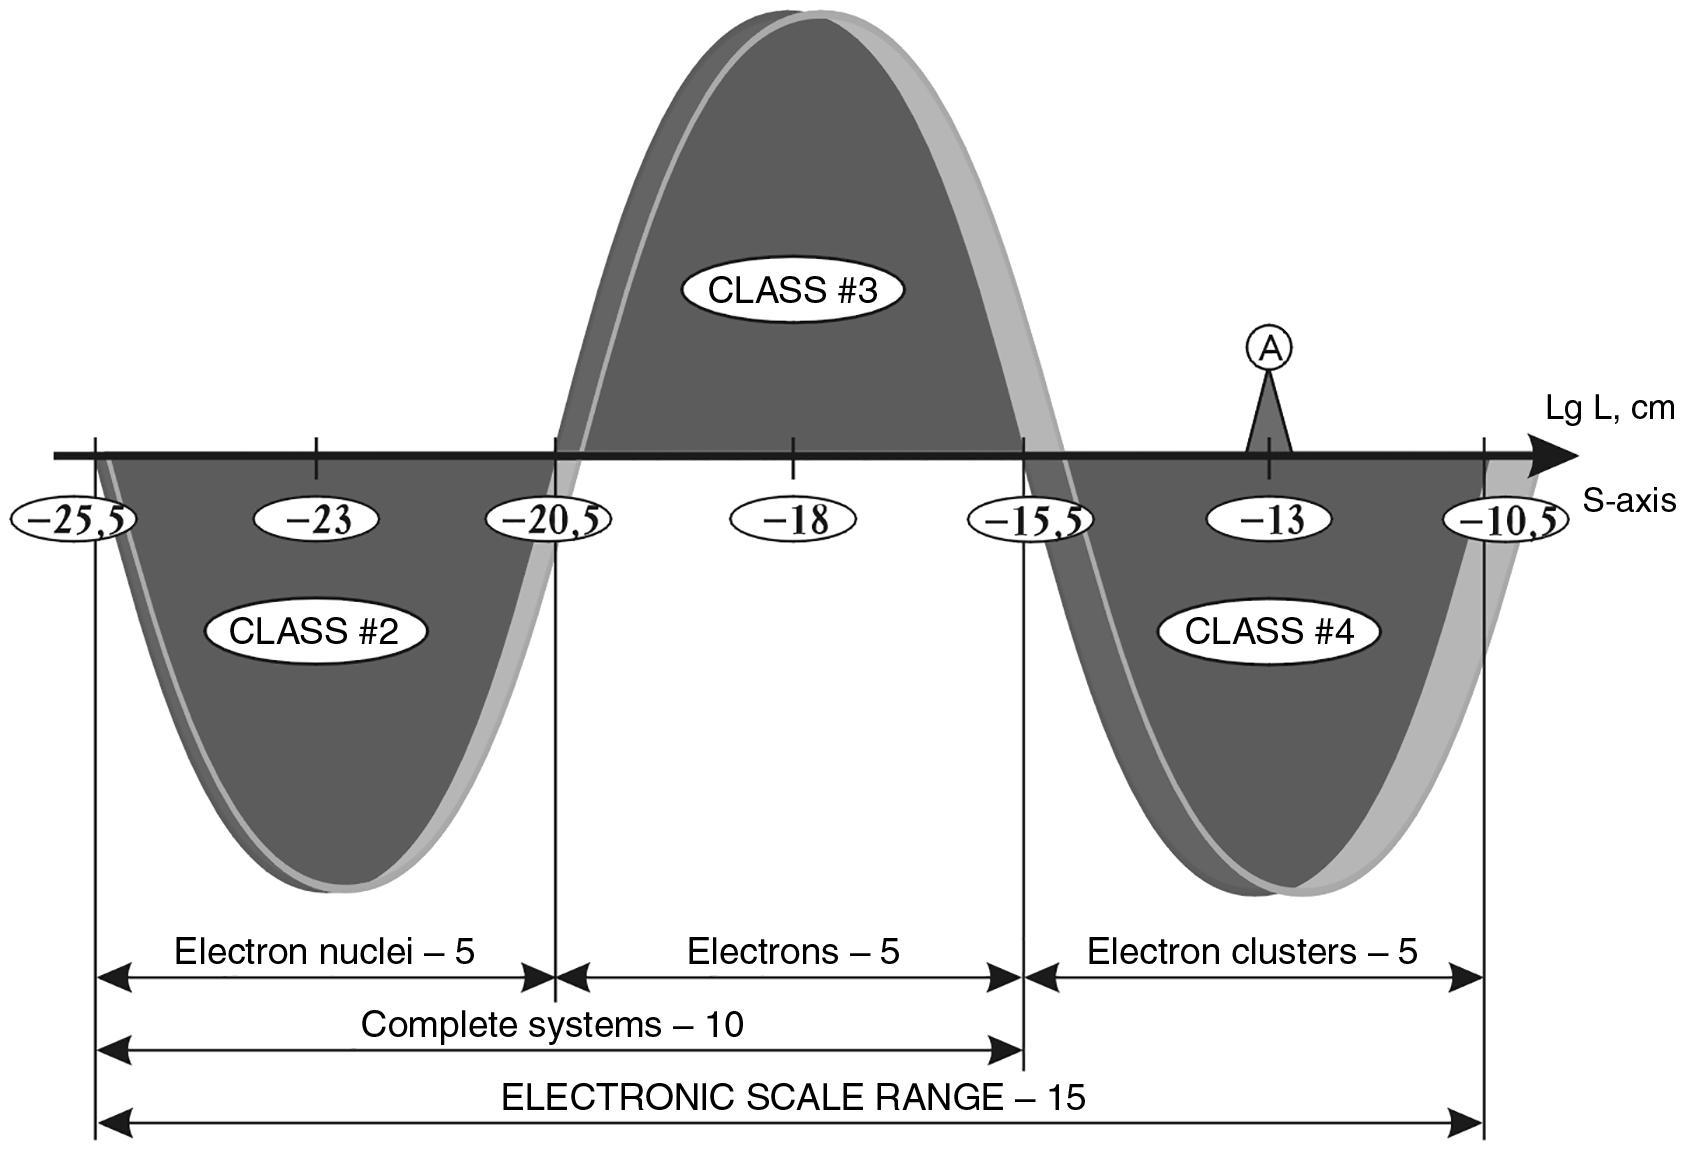 Fig. 1.19
We should not be confused by the fact that the photon, as well as the electron, has a wave structure. We are talking about the size of its corpuscular essence. Then we can PROPOSE that there is a truncated photon scale range from \(10^{-33}\) cm to \(10^{-20.5}\) cm, with the hypothetical maximon acting as the photon nucleus.
However, it should be noted that both photon and electron can be not so much particles with clear boundaries as vortices or excitations (like solitons) in the ether and, therefore, their sizes are still an open question requiring deep theoretical and experimental study. Moreover, the conducted theoretical investigations of this question in the work of N. P. Tretyakov and S. P. Tretyakov and S. I. Sukhonos (“Arithmetic of the Universe” in the book “Man on the Scale of the Universe”, Moscow: New Center, 2004) showed that practically all elementary particles are four-dimensional resonances of the maximon medium. Proceeding from this assumption, it is rather problematic to represent them as similar bodies of macro- and mega-diameter range.
-
Willy K., Dethier V. Biology (biological processes and laws). M.: Nauka, 1979. P. 31. ↩
-
Vernadsky V. I. Biogeochemical Essays. M.-L.: ANS SSSR, 1940. P. 73. ↩
-
Kamshilov M. M. Evolution of the Biosphere. M.: Nauka, 1979. P. 60. ↩
-
Willy K., Dethier V. Biology (biological processes and laws). Moscow: Nauka, 1979. ↩
-
Allen K. W. Astrophysical Magnitudes. M.: Mir, 1977. ↩
-
Aghekyan T. A. Stars, Galaxies, Metagalaxy. M.: Nauka, 1981. P. 64. ↩
-
Aghekyan T. A. Stars, Galaxies, Metagalaxy. M.: Nauka, 1981. P. 64-72. ↩
-
Allen K. W. Astrophysical Magnitudes. M.: Mir, 1977. P. 396. ↩
-
Allen K. W. Astrophysical Magnitudes. M.: Mir, 1977. P. 320-321. ↩
-
Martynov D. Ya. Course of General Astrophysics. M.: Nauka, 1979. P. 202. ↩
-
Shklovsky I. S. Stars. Their birth and death. Moscow: Nauka, 1977. ↩
-
Shklovsky I. S. Stars. Their birth and death. Moscow: Nauka, 1977. P. 161. ↩
-
Baade W. Evolution of stars and galaxies. M.: Mir, 1966. P. 31. ↩
-
Aghekyan T. A. Stars, Galaxies, Metagalaxy. M.: Nauka, 1981. P. 402. ↩
-
Zonn W. Galaxies and quasars. M.: Mir, 1978. P. 59. ↩
-
Vorontsov-Vel’yaminov B. A. Extragalactic Astronomy. M.: Nauka, 1978. P. 222. ↩
-
Vorontsov-Vel’yaminov B. A. Extragalactic Astronomy. M.: Nauka, 1978. P. 184. ↩
-
Vorontsov-Vel’yaminov B. A. Extragalactic Astronomy. M.: Nauka, 1978. P. 184. ↩
-
Baade W. Evolution of stars and galaxies. M.: Mir, 1966. P. 208. ↩
-
Vilkovisky E. Y. Quasars. M.: Nauka, 1985. P. 122. ↩
-
Vilkovisky E. Y. Quasars. M.: Nauka, 1985. P. 146-147. ↩
-
Martynov D. Ya. Course of General Astrophysics. M.: Nauka, 1979. P. 447. ↩
-
Martynov D. Ya. Course of General Astrophysics. M.: Nauka, 1979. P. 447. ↩
-
Ginzburg V. L. Some problems of physics and astrophysics // Physics today and tomorrow. L.: Nauka, 1973. P. 43. ↩
-
Vorontsov-Vel’yaminov B. A. Extragalactic Astronomy. M.: Nauka, 1978. P. 428. ↩
-
Vilkovisky E. Y. Quasars. M.: Nauka, 1985. P. 64, 98. ↩
-
Martynov D. Ya. Course of General Astrophysics. M.: Nauka, 1979. P. 452. ↩
-
Danielson F., Alberti R. Physical Chemistry. Moscow: Higher School, 1967. P. 603. ↩
-
Goldansky V. I., Shantorovich V. P. Current state of research “new” atoms“ // Physics of the XX century. Development and Prospects. M.: Nauka, 1984. P. 136-187. ↩
-
Goldansky V. I., Shantorovich V. P. Current state of research “new” atoms“ // Physics of the XX century. Development and Prospects. M.: Nauka, 1984. P. 139. ↩
-
Martynov D. Ya. Course of General Astrophysics. M.: Nauka, 1979. P. 210. ↩
-
Shklovsky I. S. Stars. Their birth, life and death. Moscow: Nauka, 1977. P. 154. ↩
-
Mukhin K. N. Physics of the atomic nucleus // Experimental nuclear physics. T.1. Moscow: Atomizdat, 1974. P. 50-70. ↩
-
Y. M. Shirokov, N. Yudin. P. Nuclear Physics. Moscow: Nauka, 1972. P. 55. ↩
-
Markov M. A. On the Nature of Matter. Moscow, 1976. ↩
-
Yavorsky B. M., Detlaf A. A. Reference book on physics. Moscow: Nauka. Fizmatlit, 1996. P. 538. ↩
-
Y. M. Shirokov, N. Yudin. P. Nuclear Physics. Moscow: Nauka, 1972. P. 56. ↩
Other classification properties of Stability S-waves
Are other special points of the SWS (e.g., vertices and troughs) classification boundaries? The analysis has shown that the dimensions corresponding to these points are, to some extent, indeed classification boundaries for all systems of the Universe. However, these boundaries separate not so much the objects themselves as the properties of objects within a single class. Let us give some examples.
PLANETS (CLASS #8). We have already described the transition from formless small planets and satellites to spherical planets, which occurs exactly at the lowest point of one of the waves at 7.48 S-axis. Here we see a very sharp boundary, passing through which from left to right we get an infinite jump in symmetry. Note that these properties change within a single class, the class of planets.
NUCLEI OF ATOMS (CLASS #4). We have already considered the boundary between stable particles and atomic nuclei. At the lower point of SWS (-12.8), where nucleons (protons and neutrons) are located, there is a significant change in the properties of the particles of the microcosm.
First, all particles smaller than this size are not as stable as the proton, whose size exactly corresponds to this point.
Secondly, it is from this size that the nuclei of atoms begin to form. The life ages of which, in general, are much longer than those of lighter and smaller particles.
In any case, we can confidently assert the following: at the lowest point of this fragment of the SWS (-12.8), as one moves from left to right, the properties of matter change dramatically. Elementary particles come under the influence of strong interactions, enabling them to form atomic nuclei.The analysis shows that not only the lower, but also the upper points of SWS are the boundaries of changes in properties. However, these changes do not always occur clearly and unambiguously in all slices of the scale hierarchy for all systems. Moreover, careful system analysis has revealed another remarkable characteristic of these points on the S-axis. They occupy a special place in the scale-structural invariant, which will be discussed in the next chapter.
S-similarity of the Universe
The analysis of the previous material suggests an additional hypothesis - about the mutual similarity of the three main intervals of the S-axis with a length of 20 orders of magnitude. After all, if each of them “belongs” to only one force (see Fig. 1.7), it is possible that the laws of action of these forces on matter have a similar character. This may first of all manifest itself in the similarity of the structures of objects belonging to the same parts of the three selected intervals, i.e. in the scale-structural invariant.
This idea first appeared to the author when it was found out that there are objects with similar structures in Macro- and Mega-intervals. First of all, these are atoms and stars. Although the structure of the atom was inspired by Rutherford by the structure of the Solar System as a whole, and not by the Sun separately, the similarity of atoms with stars seemed to the author to be greater.
Indeed, both atoms and stars have a small central nucleus, and they have spherical shells. The most common atom in the Universe, hydrogen, has a spherical shape similar to stars. Astrophysicists are convinced that it is in the cores of stars that the main processes that determine their properties are going on. Atoms are characterized by the dominant influence of the properties of the nuclei on them. Generally speaking, both stars and atoms have a pronounced monocentric structure. However, the solar system (like, apparently, any other system) also has a monocentric structure - the nucleus - the Sun, but still, unlike the atomic system, the structure of the solar system is flat. The decisive factor, however, for me to choose a pair of similar structures was that the average size of stars (\(10^{12}\) cm) is ideally 20 orders of magnitude larger than the size of a hydrogen atom (\(10^{-8}\) cm). When I first became acquainted with the materials on neutron stars1, I was struck by the precision of the similarity even more. After all, neutron stars are made up entirely of naked nucleons. In fact, they are giant atomic nuclei, only they contain \(10^{60}\) times more nucleons. Their size (~\(10^{7}\) cm) is 20 orders of magnitude larger than the size of atomic nuclei (\(10^{-13}\) cm). You can “go around” the entire hierarchical ladder of the Universe up and down many times, but you will not find anything like this on any other scale floor. There are systems of bare, densely packed nucleons (ρ ~\(10^{15}\) g/cm3) only at two scale levels: in atomic nuclei and 20 orders of magnitude higher (to the right along the S-axis) - in neutron stars.
I quickly realized that this could not be a coincidence. Behind this fact there is a large-scale similarity of structure types, similarity with coefficient \(10^{20}\). Checking confirmed the assumption. This similarity is the subject of this chapter. However, before directly dealing with this similarity, it is necessary to make some methodological explanations and introduce a scheme for comparing structures of such a distant nature.
METHODOLOGICAL EXPLANATION
Of course, each scale level has its own unique specificity of natural properties. It is its study that modern science has been engaged in since the Renaissance, and in this it has achieved undoubted success, having accumulated a huge factual material about practically all levels of the Universe organization.
However, much less attention has been paid to phenomena common to all levels. It is natural. After all, to thoroughly study the specifics of each level of the large-scale organization of the Universe, it is necessary to concentrate attention on its inherent features only. If science for 500 years would not reject with unprecedented persistence all attempts of separate thinkers to concentrate attention on general properties of objects, it would hardly reveal all nuances and details of substance structure at each of levels. After all, it was enough to rigidly accept some general scheme of structure, and the study of a large class of phenomena could be stopped there. In this case we would not receive that undoubtedly valuable and gigantic storehouse of information, which at the present stage is already quite “ripe” for generalization at a sufficiently high level of concretization.
Over time, the path of differentiation, for all its necessity, has by now led science into an attitudinal dead end. Having left to philosophy all attempts to find general laws of nature, the Western scientific paradigm for many centuries with a sense of incredulous disdain met any attempts to generalize the laws of different scales. To undertake such work in official science was considered a sign of bad taste, the result of poor education or dilettantism. It was considered impossible to comprehend professionally several disciplines at the same time, and therefore any generalizing theories were met with hostility just because they were generalizing. Meanwhile, this does not contradict the fact that “coryphees in their field” were allowed to write large review works.
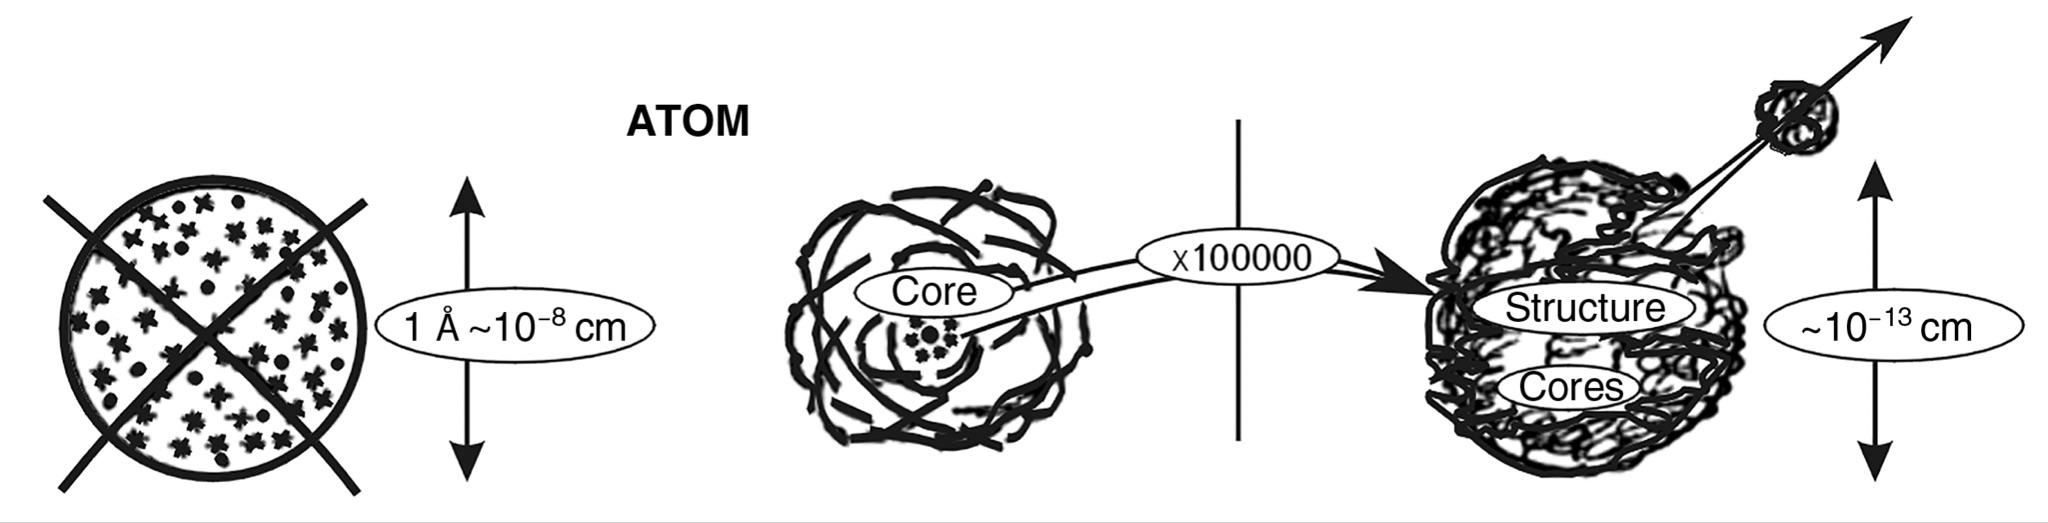 Fig. 1.20. The first (polycentric) model of Thompson’s atom is shown on the left, which was later rejected and replaced by Rutherford’s monocentric model. But the structure of the nucleus was still polycentric (the figure is taken from E. Rogers’ book “Physics for the Curious”)
At the same time, if these works did not belong to one specific discipline, they often had a purely compilation character, and as a result of such “generalization” there never appeared an emergent effect of integrity. The review did not lead to generalization, from which some supra-subject laws would be born.
This, we repeat, could not have happened without a partial loss of specificity, for the general is always poorer in precision and particularity than its parts. In a tradition where the struggle for ever more precise and detailed knowledge had been going on for centuries, any attempt to propose a theory that would lead to the loss of this precision was certainly unnatural. The maximum that science could do was to use indirect large-scale analogies. The most striking example is the story of the model of the atom.
As is well known, Thompson’s model was the first to be proposed, which was a bag of positive and negative charged particles uniformly distributed throughout the volume of the atom (see Fig. 1.20).2
“By 1910, however, this picture was no longer satisfactory. Alpha particles, used as projectiles to investigate the structure of the atom, produced results that could not be explained by the pudding-shaped model of the atom. Rutherford proposed a new model of the atom, almost empty, with a tiny atomic nucleus surrounded by electrons moving in orbits…”3
Here, perhaps for the first time, a S-Analogy was used to solve a global scientific problem, when the structure of the organization of the solar system was fruitfully transferred from the megaworld to the microcosm.
However, the rarity of successful examples indicates that the method of S-Analogies itself did not exist.
Only since the beginning of the twentieth century, the systems approach (A. A. Bogdanov, V. I. Vernadsky) emerged and began to gradually gain weight, within the framework of which a new discipline - THE GENERAL THEORY OF SYSTEMS, or abbreviated “GTS” (L. Bertalanffy, V. N. Sadovsky, Y. A. Urmantsev, etc.) - began to emerge. It was created proactively, by different thinkers in different variants. Each variant practically did not develop the previous one, but appeared as if anew, on an empty place. Each author of “GTS” tried to create anew the whole axiomatics, the whole terminological thesaurus, all the rules. In doing so, he relied on the accumulated knowledge in natural sciences, mainly in sociology and biology, and each author applied his own version of mathematical processing.
Classical physics did not adopt the “GTS”. Unification of all large-scale phenomena physicists tried to carry out on the basis of traditional methods. However, everything has to be paid for. Western science paid for accumulation of detailed information by complete loss of integrity of the world picture. And desperate attempts of its best representatives to gather the fragments into a single whole, at least at the most general level of physics - to create a unified field theory, finally failed by the end of the twentieth century, although the prize for the solution of this problem was not serious, at least the Nobel Prize.
In this work we will follow the way of the system approach. The choice of the structural-system method is conditioned by the fact that it is extremely difficult to construct a general physical theory of large-scale regularities “from scratch.” It is necessary to approach its solution gradually and step by step. It is necessary to start with the search for the most obvious scale invariants, even at the cost of losing the inherent accuracy of physics. We believe that at the first stages of such a path it is impossible to expect the construction of an exact THEORY OF A UNITED FIELD, which would allow us to combine all specific features of various types of interactions in formulas. It is necessary to define at least the most general invariants, even if expressed in the form of any system schemes and qualitative models. Before we start our way along the S-axis, let us arm ourselves with a simplifying scheme of structural analysis.
Its essence is that all structures are divided into two polemical types: monocentric (M-structures) and polycentric (P-structures).
A typical representative of a monocentric structure is an atom, and a polycentric structure is a chaotic asteroid.
Between them we can introduce a continuous transitive series of intermediate structures, which in our presentation will be called MF-structures.
Without pretending to complete the classification, let us propose an eight-digit scheme, which is formed due to binary combinatorics of three levels of any system: outside - the form, in the depth - the center, between them - the intermediate medium (see Fig. 1.21 below).
Hereafter we will use simplified notations throughout the text: P-structures and M-structures, which are introduced for limit forms (No. 8 and 1), and MF-structures for all intermediate forms (No. 2-7).
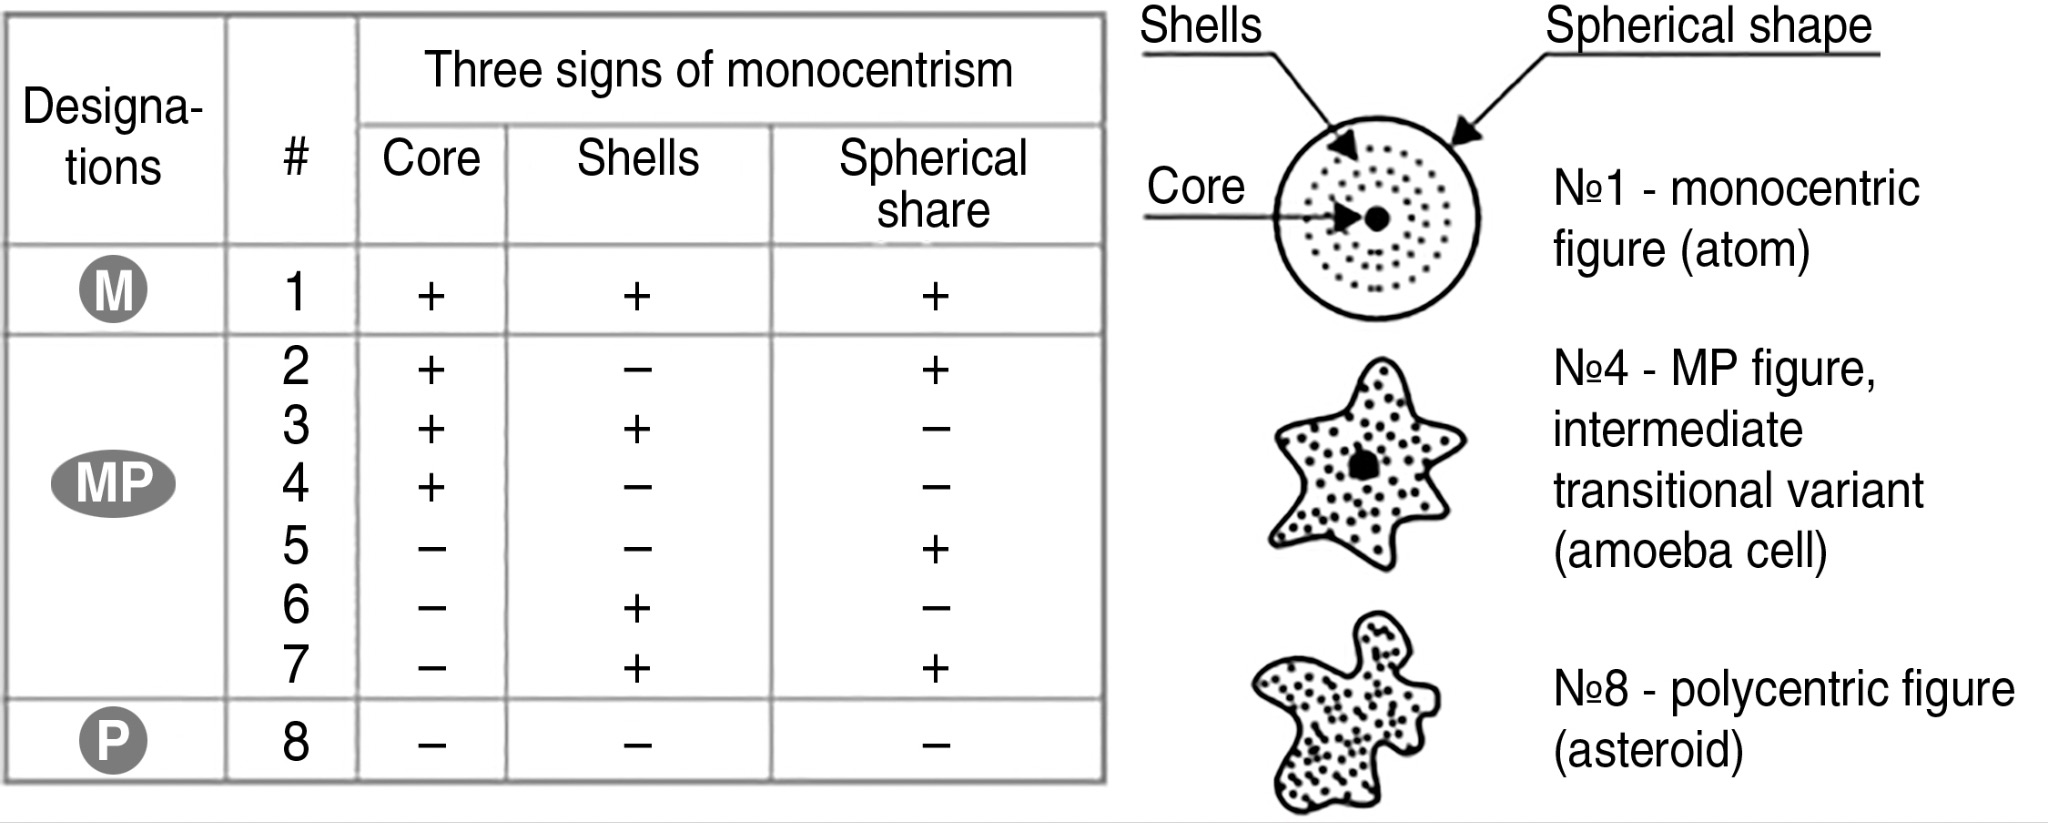 Fig. 1.21. Two poles of symmetry of structures and six conditional intermediate types
All three levels may or may not exhibit signs of monocentricity. For the shape, this refers to the presence of sphericity (or near-sphericity, such as ellipticity). For the center, it involves the presence or absence of a central, system-forming core. For the intermediate medium, it pertains to the presence or absence of a shell structure. An additional, fourth, sign of monocentricity has to do with structurization of the external environment around the object - this sign is the presence of radial-radial symmetry for the external shells of the system.
So, returning to the S-axis, we note the following. The preliminary analysis has shown that the macro-interval of the SW, which we have selected, is in many respects similar to the Mega-interval. If it is really so and the whole S-axis is divided between the fields into three equal sections, then it remains to assume that each of these sections has some invariant structural-dynamic properties. Let us check whether it is so.
-
Shklovsky I. S. Stars. Their birth and death. Moscow: Nauka, 1977. ↩
-
Rogers E. Physics for the Inquisitive. Т. 3. M.: Mir, 1971. P. 445. ↩
-
Rogers E. Physics for the Inquisitive. Т. 3. M.: Mir, 1971. P. 374. ↩
MACRO-interval
Let us begin the sequential analysis of structural laws of systems construction from the middle scale interval - from the interval where electromagnetism dominates in the construction of objects of nature by 20 orders of magnitude.
The macro interval begins at sizes \(10^{-13}\) cm. On this scale, the most significant systems are atomic nuclei (CLASS #4).
Recall that, purely for reasons of convenience, the three intervals of 20 orders of magnitude each were named: the middle interval - Macro-, the left - Micro-, the right - Mega-. Further we will consider them mainly in integer values.
They have predominantly the so-called polycentric structure (see Fig. 1.22)1.
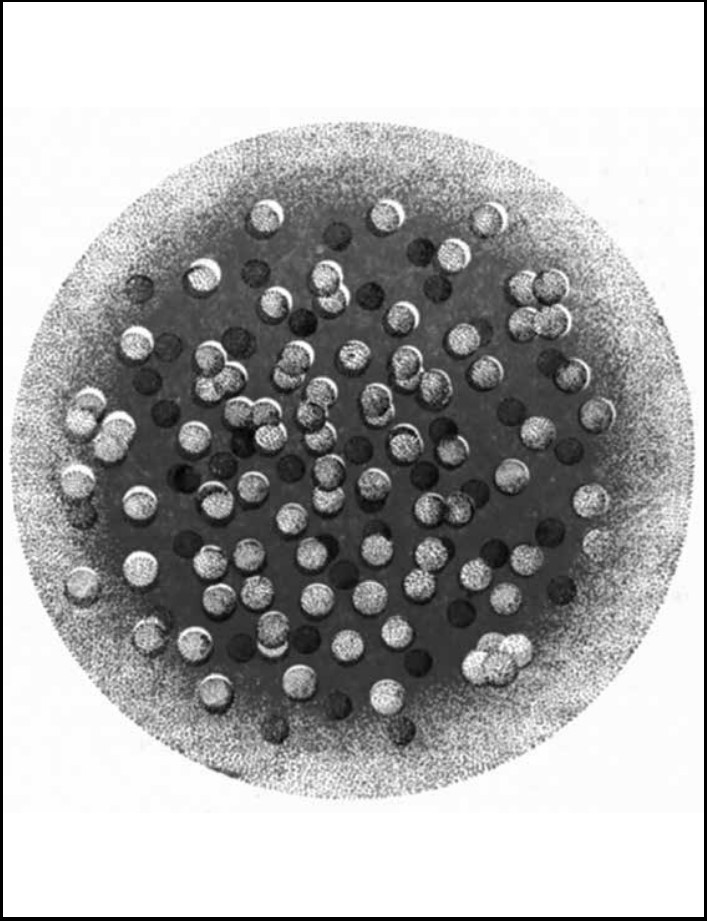
Fig. 1.22. Model of the spherical nucleus of the gold atom. The nucleus has a typical internal polycentric structure and consists of 197 nucleons: protons (light clumps) and neutrons (dark clumps). There is a lot of empty space in the nucleus, as the distance between the centers of the nucleons is about 2 fermi, which is noticeably larger than two nucleon radii. The density of nucleons and the intensity of powerful nuclear forces (thick color) are uniform near the center of the nucleus and gradually fall toward its surface (pale color)
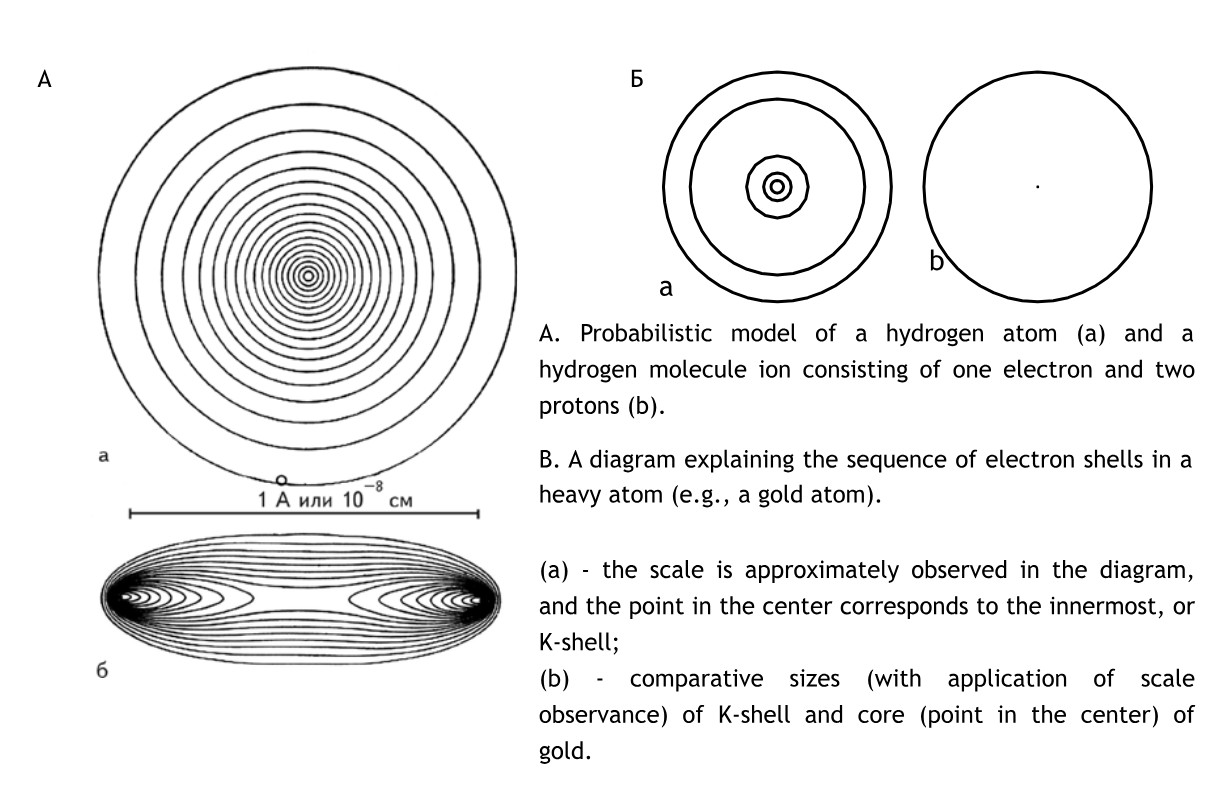 Fig. 1.23. Figures A and B show the clearly monocentric structure of the atom: nucleus, shells, and spherical shape. (From the article “Particles and Forces” by R. Peierls. In the book: Fundamental Structure of Matter. M.: Mir, 1984).
This is the same “Thompson’s pudding”, rejected in its time for the structure of atoms, only \(10^{5}\) times smaller in size, and referring exclusively to the positively charged and neutral particles of the atomic nucleus - nucleons. The sizes of nuclei do not exceed \(10^{-12}\) cm, then, as we have already written, in nature there is an unexplained failure of structures down to the size of mesoatoms - \(10^{-10}\) cm. However, the structure of the atoms themselves, in contrast to the structure of their nuclei, is already fundamentally different - predominantly monocentric (see Fig. 1.23)2.
Thus, if we follow along the S-axis the evolution of matter at the early stages of its formation in the nascent Universe from nuclear scales to atomic scales, we find a certain qualitative jump in the types of systems. Up to a certain threshold of scales the structures are polycentric and have no distinguished nucleus. After the threshold there appear completely different structures - atoms with a pronounced nucleus.
In an atom, it is the nucleus that determines the fundamental properties and has orders of magnitude more mass and binding energy. Such a sharp material separation of the center is a unique phenomenon for nature, especially since the size of the nucleus is negligibly small in relation to the whole atom.
If we transfer the proportions of the atom to the social scale, a person occupying the position of the nucleus will be 200 kilometers away from another “nucleus man”. However, at the same time, each of them will control the situation on a territory of more than 40,000 square kilometers!
The monocentric structure of the atom has an additional feature - the shell structure, because electrons are “spread” on their shells with fixed diameters. Thus, the structure of the atom differs from the structure of the nucleus in that it contains a functionally important nucleus and an internal shell structure.
In principle, it can be argued that the entire S-axis region from nuclei (\(10^{-13}\) cm) to atoms (\(10^{-8}\) cm) is occupied by monocentric structures, and as one moves from proton to hydrogen atom, the degree of monocentricity of the structures increases (from No. 8 to No. 1, see Fig. 1.21). However, the section of the S-axis dominated by monocentric systems occupies a very short interval, about 5 orders of magnitude. The dominance of monocentric structures almost ends after the atomic scale range. If we move a little to the right along the S-axis, we immediately enter the region of polycentricity dominance (see Fig. 1.24)3.
So, let us note an important phenomenological fact: on a short scale interval - from atomic nuclei to atoms themselves - the structure of matter makes a fundamental jump from one pole to another: from polycentrism to monocentrism.
Let us go back and consider in more detail the nature of polycentrism of atomic nuclei.
The nucleus of helium or other elements of the first numbers of the TEM (Mendeleev’s table of elements) is lumpy rather than spherical.
Only a few nuclei have the shape of a sphere, namely those with the number of nucleons close to the magic numbers known in nuclear physics - 8, 20, 28, 50, 82, 126.
Most nuclei, on the other hand, have either a “hard” deformed“ shape or a “soft” shape that is constantly changing.
Apparently, nonspherical nuclei can be divided into two categories…..
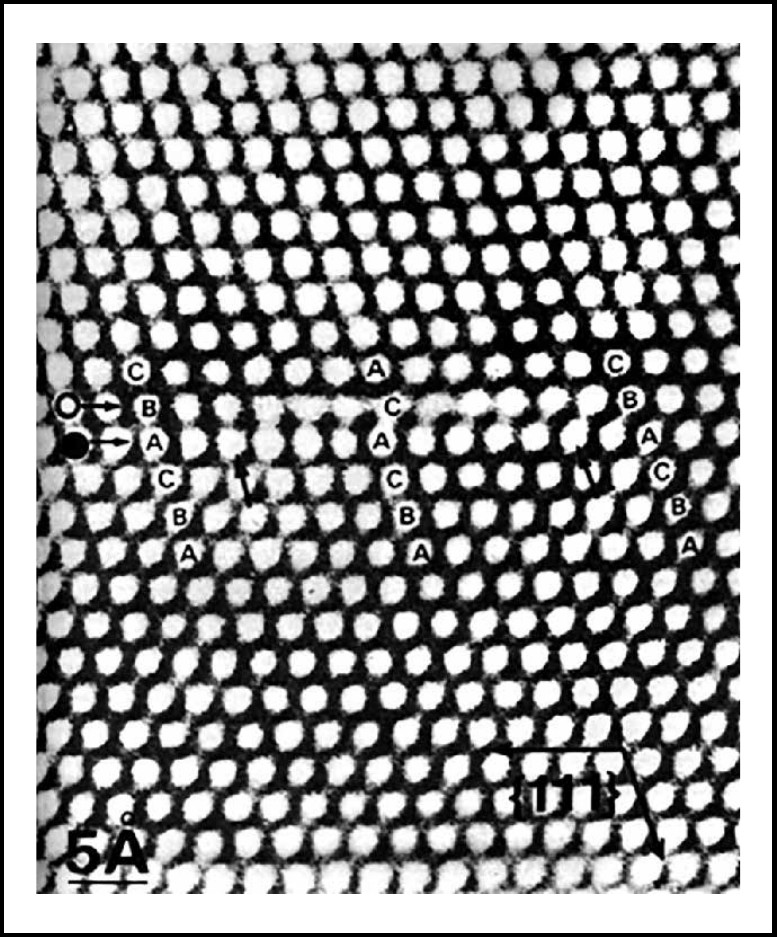
Fig. 1.24: The crystal lattice of gold. Photograph taken with an electron microscope. Each white dot is a gold atom located in the crystallographic plane
The first category includes “rigidly deformed” kernels. These nuclei mostly have a stable cigar shape. They are elongated spheroids with one long and two short axes. The other category consists of ‘soft’ ones, whose shape is highly variable … mainly a variety of asymmetric ellipsoids … as well as some spherical and oblong structures and flattened spheroids … “2
Thus, we see that the shape of atomic nuclei only for some elements acquires a spherical form, and in general there are even elongated (linear) structures among them, and almost flat (two-dimensional). However, all of them have rotational symmetry axes. As for the central core in the nucleus, it simply does not exist. In other words, “the nucleus has no core “4 The density of charges and mass does not increase toward the center (see Fig. 1.22). Inner shells are found only in spherical nuclei, in them “the charge density does not decrease with increasing distance from the center, but fluctuates.”5 Therefore, in atomic nucleus physics two alternative models are successfully used in different cases: drop and shell models.3.
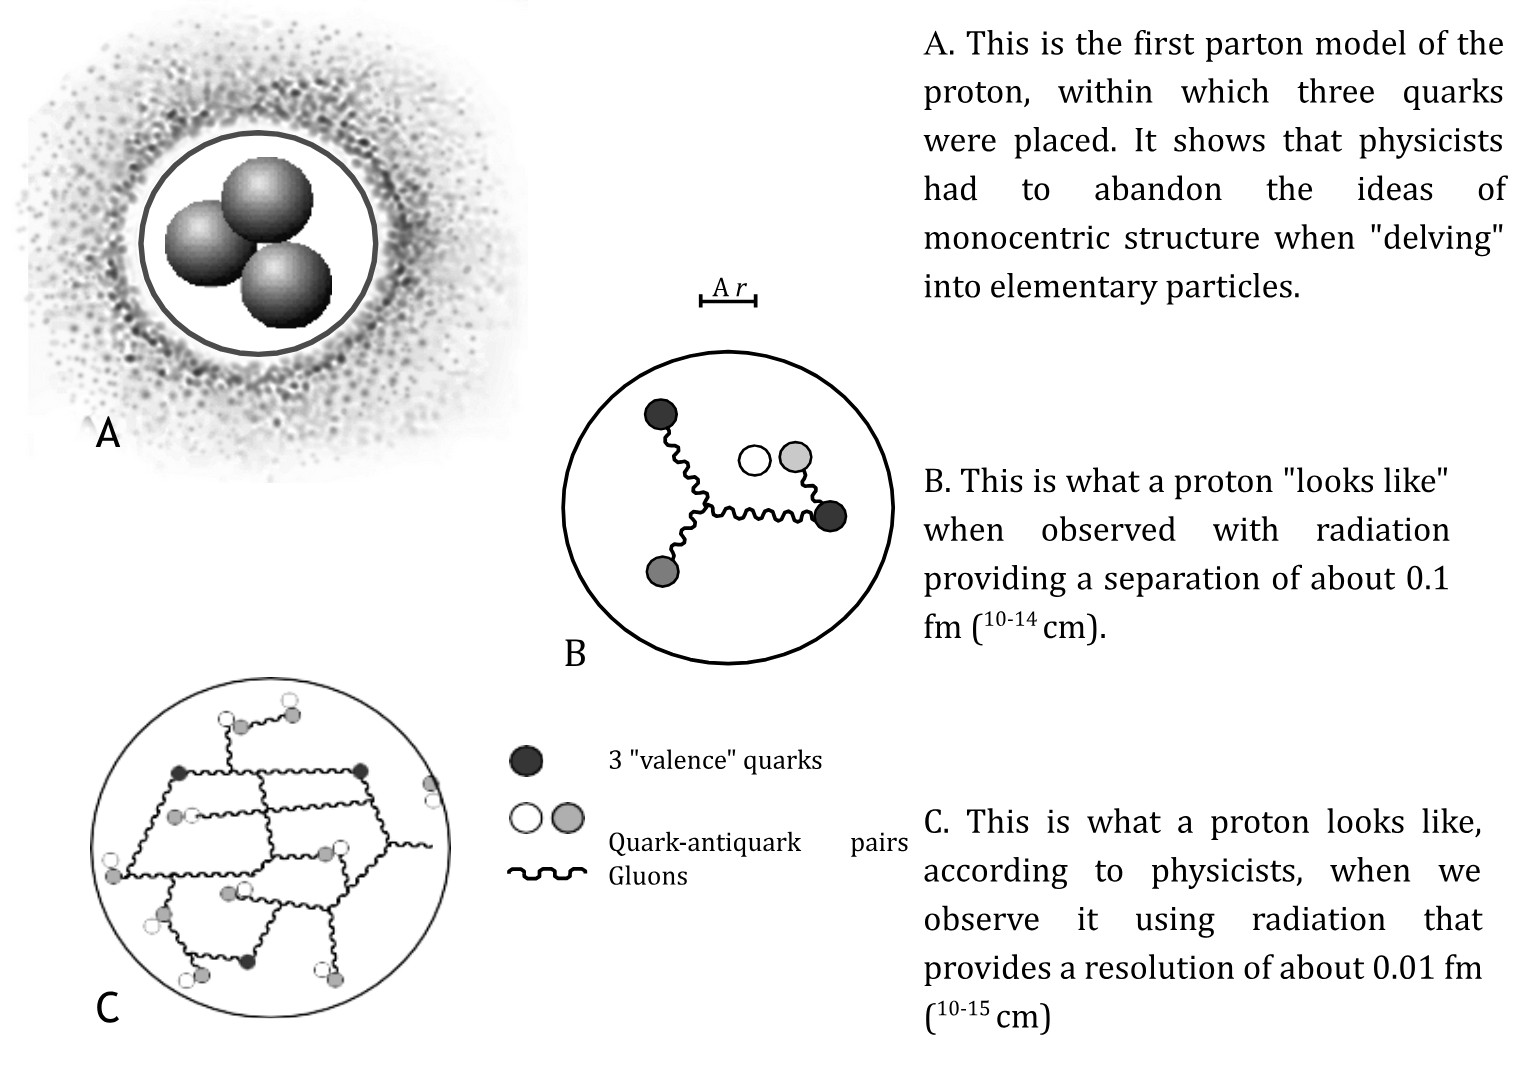
Fig. 1.25. These models show that the degree of polycentricity can increase as the proton penetrates deeper into the proton. However, on a scale of ~\(10^{-13}\) cm, the spherical shape of the proton gives it one of the important features of monocentricity.
However, even large “atomic nuclei do not have a smooth surface; protons and neutrons are not evenly distributed over the surface, but tend to clump into alpha particles, making the surface ‘lumpy.’”5 All this suggests that the polycentric type of structure dominates in the scale region of atomic nuclei, through which monocentric features only rarely “break through”: spherical shape and shell-like internal structure of nuclei with the magic number of nucleons. In general, atomic nuclei should be attributed to the polycentric type of objects.
The simplest representative of nuclei is the hydrogen nucleus - the proton. Such nuclei in the Universe are the overwhelming majority, more than 70% of the mass of the Universe.
How is the PROTON organized? Does it have a central core, spherical shells? Its structure was presented to physicists as such for quite a long time. The inertia of the revolution made by Rutherford, who “beat” Thompson’s polycentric model of the atom with the monocentric model, was the reason. The monocentric model of the proton was called the central core model. However, experimental data soon disproved this model. It was as if nature had mocked the inertia of the physicists’ model thinking. It so stunned them that even the title of the paragraph on the structure of the nucleon in one of the classic books on nuclear physics slipped the appropriate mood: “The end of the core.”6 The way out of the crisis was found by R. Feynman, who proposed the parton model (part - part - part), where the nucleon consists of parts, it has no shells and no core. “According to Feynman, the nucleon in its rest frame is a complex particle consisting of virtual point parts - partons.”7
Obviously, such an internal structure of the nucleon is absolutely polycentric (see Fig. 1.25), although its shape is spherical, which is an external sign of monocentricity. Therefore, the proton can be referred to the MS-Dorm No. 5. So, although polycentrism is still widespread at distances from \(10^{-13}\) cm to \(10^{-12}\) cm, we can find in this range of scales some signs of monocentrism, although it is still very far from being complete. To the right of the \(10^{-12}\) cm point, polycentric structures are already practically impossible either to meet in nature or to form artificially (creation of hypernuclei is a big problem8).
We can say that polycentric structures, apparently dominant up to \(10^{-13}\) cm, manifested as early as in atomic nuclei, completely disappear beyond the threshold of \(10^{-12}\) cm.
Further, up to the size of \(10^{-8}\) cm, exclusively monocentric structures - atoms and their ions - are found in nature. This scale interval of total monocentrism (from \(10^{-10}\) cm to \(10^{-8}\) cm) is accompanied by all its three features: spherical shape, central nucleus and shell structure of electron orbits.
Thus, we note once again that the process of changing the type of structure from polycentric to monocentric occurs in the size range of \(10^{-13}\) cm … \(10^{-12}\) cm, and at the boundary of \(10^{-8}\) cm atoms show us the classical monocentric structure. If we now trace the path of evolution of matter from atoms further along the S-axis (for inanimate matter), then at 15 orders of magnitude (from \(10^{-8}\) to \(10^{7}\) cm) we will meet mainly polycentric structures: molecules, crystals9, microcrystals, particles, grains, stones, meteorites, asteroids, etc., i.e. monocentric structures are practically absent (or extremely rare) in the macrocosm of inanimate nature.
Thus, we see that the Macro-interval of the S-axis is not equally populated by different types of structures; in general, the situation is as follows: monocentrism dominates at the first 5 orders, while polycentrism dominates at the remaining 15 orders (see Fig. 1.26). There are, however, very interesting exceptions.
In the world of inorganic matter, the return of monocentrism (though in a weak form, i.e. not by all signs) is observed exclusively in the size range of 10-100 microns, namely in the lowest point (in the trough) of the given fragment of SWS - the Macro-interval and, as it has already been noted, in the S-CENTER OF THE UNIVERSE (SCU).
For a better associative understanding of the problem, we will further use a new concept - POTENTIAL STABILITY TROUGH, which corresponds to the lower part of the CU between the humps. Then there will be only 7 potential stability troughs (5 full troughs and 2 half-troughs at the edges of the S-interval) on the model of the HU (see Chapter II).
We are talking about the discovered mysterious appearance of spherical shapes both among cosmic dust83 and in the dust of volcanic origin. The fact is that most dust of cosmic origin has an angular fragmentary shape, and meteorites of all sizes have a chaotic shape. In this long range from hundreds of angstroms to hundreds of kilometers, one never found any particular symmetry until one came across balls of cosmic origin (see Fig. 1.27A). It turned out that “the vast majority of background deposition balls are 20-60 μm in size “84 and almost all of them are between 10 and 100 μm in size. The number of balls deposited on Earth is conservatively estimated at \(10^{4}\) tons per year. The same balls have been found on the surface of the Moon. Balls of similar sizes have been found in volcanic dust, although the conditions of their formation are very far from the conditions of formation of space balls. So, nature creates spherical forms in the size range from 10 to 100 microns regardless of the conditions of formation and almost independently of the chemical composition. This is especially surprising against the background of angular and typically polycentric structures for all crystalline matter in the range of 15 orders of the Macro-interval.
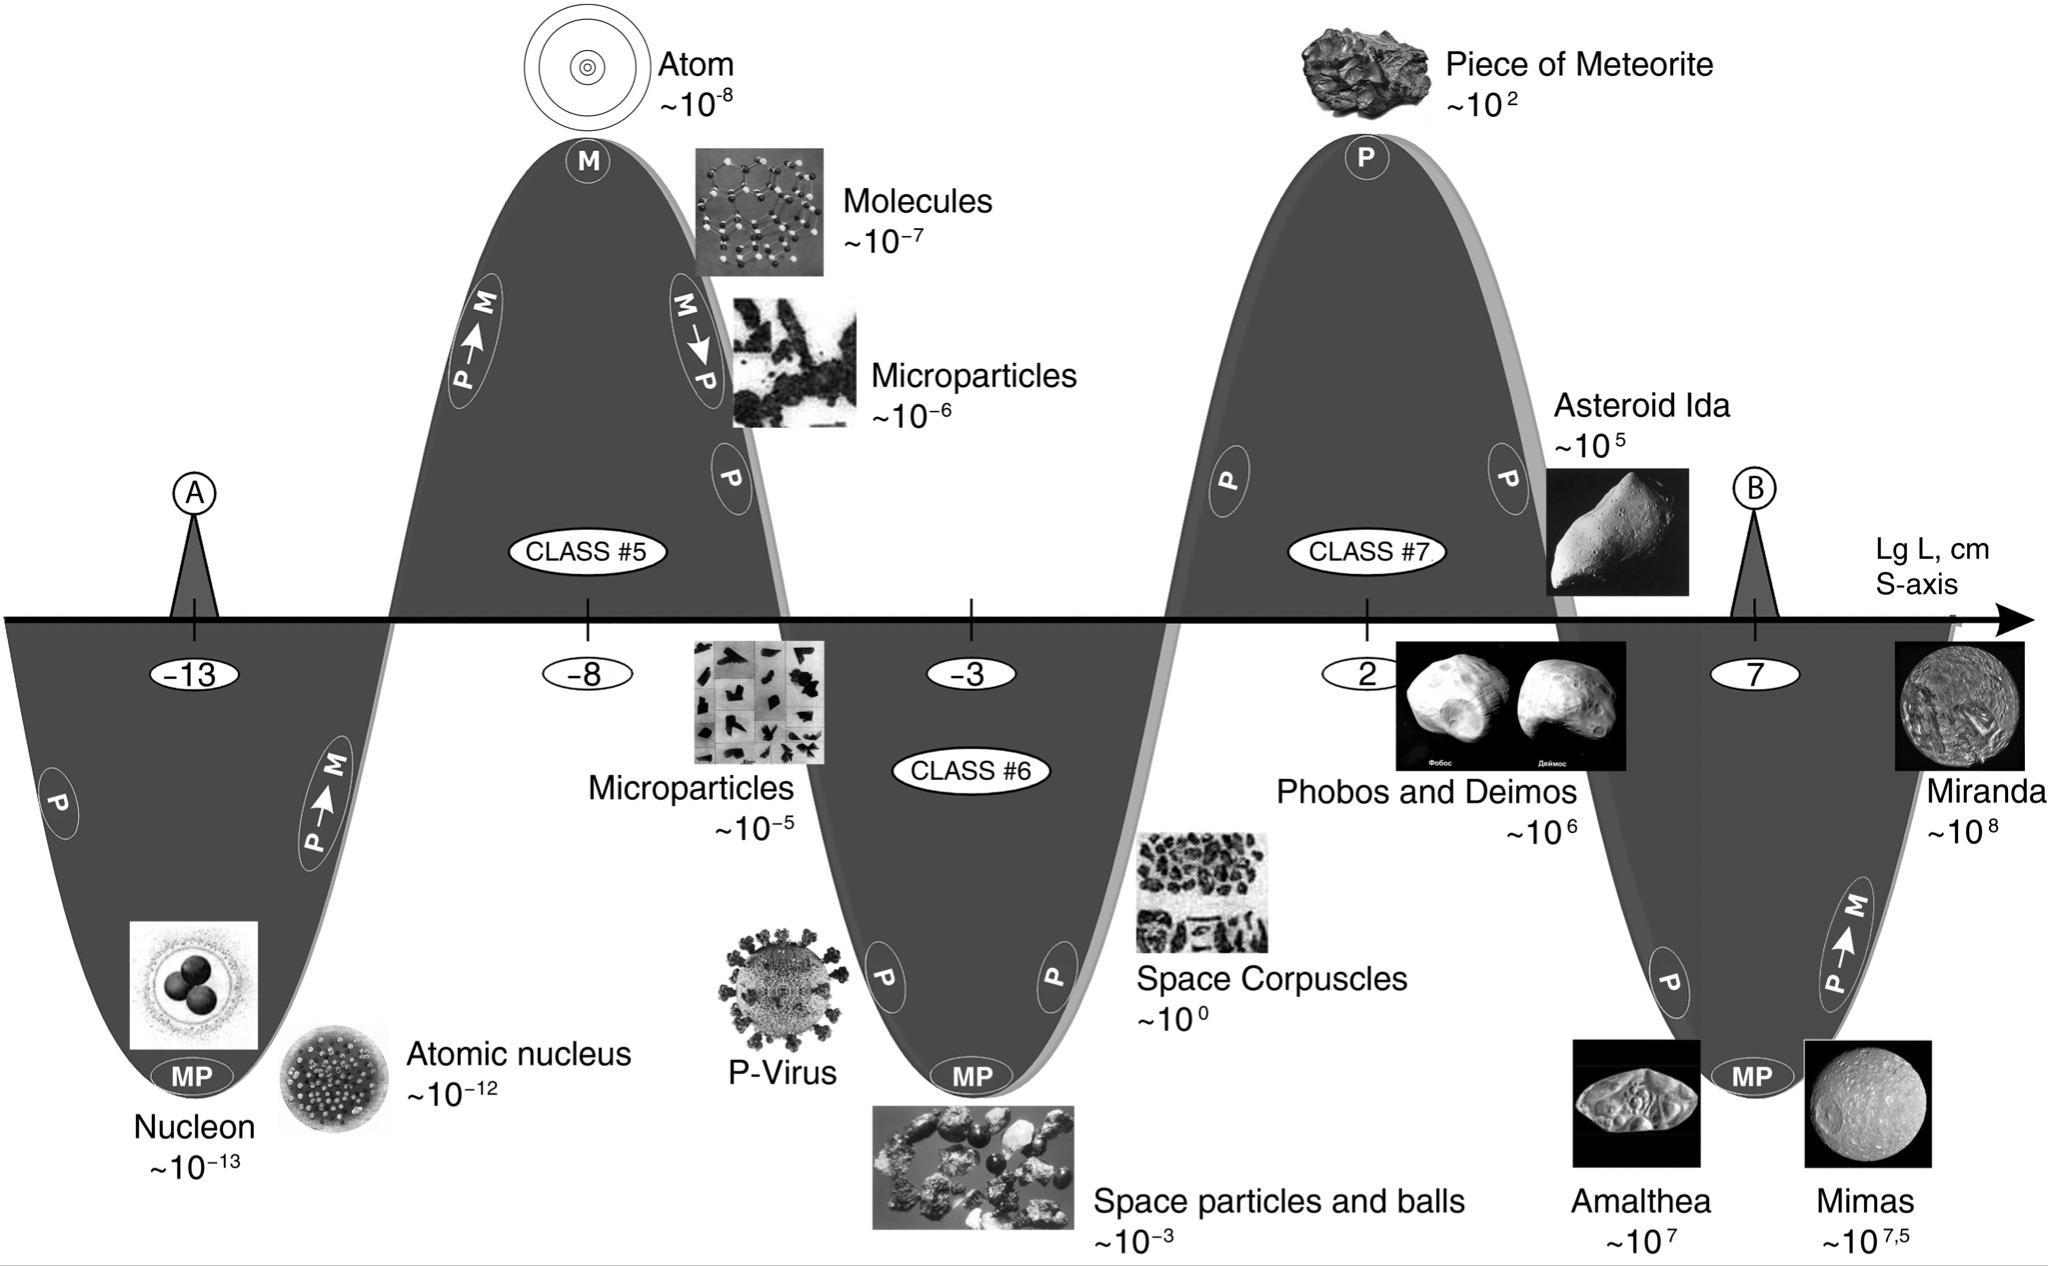 Fig. 1.26. Monocentrism and polycentrism at 20 orders of the Macro interval (from A to B electromagnetic interactions dominate). Dimensions are given in cm
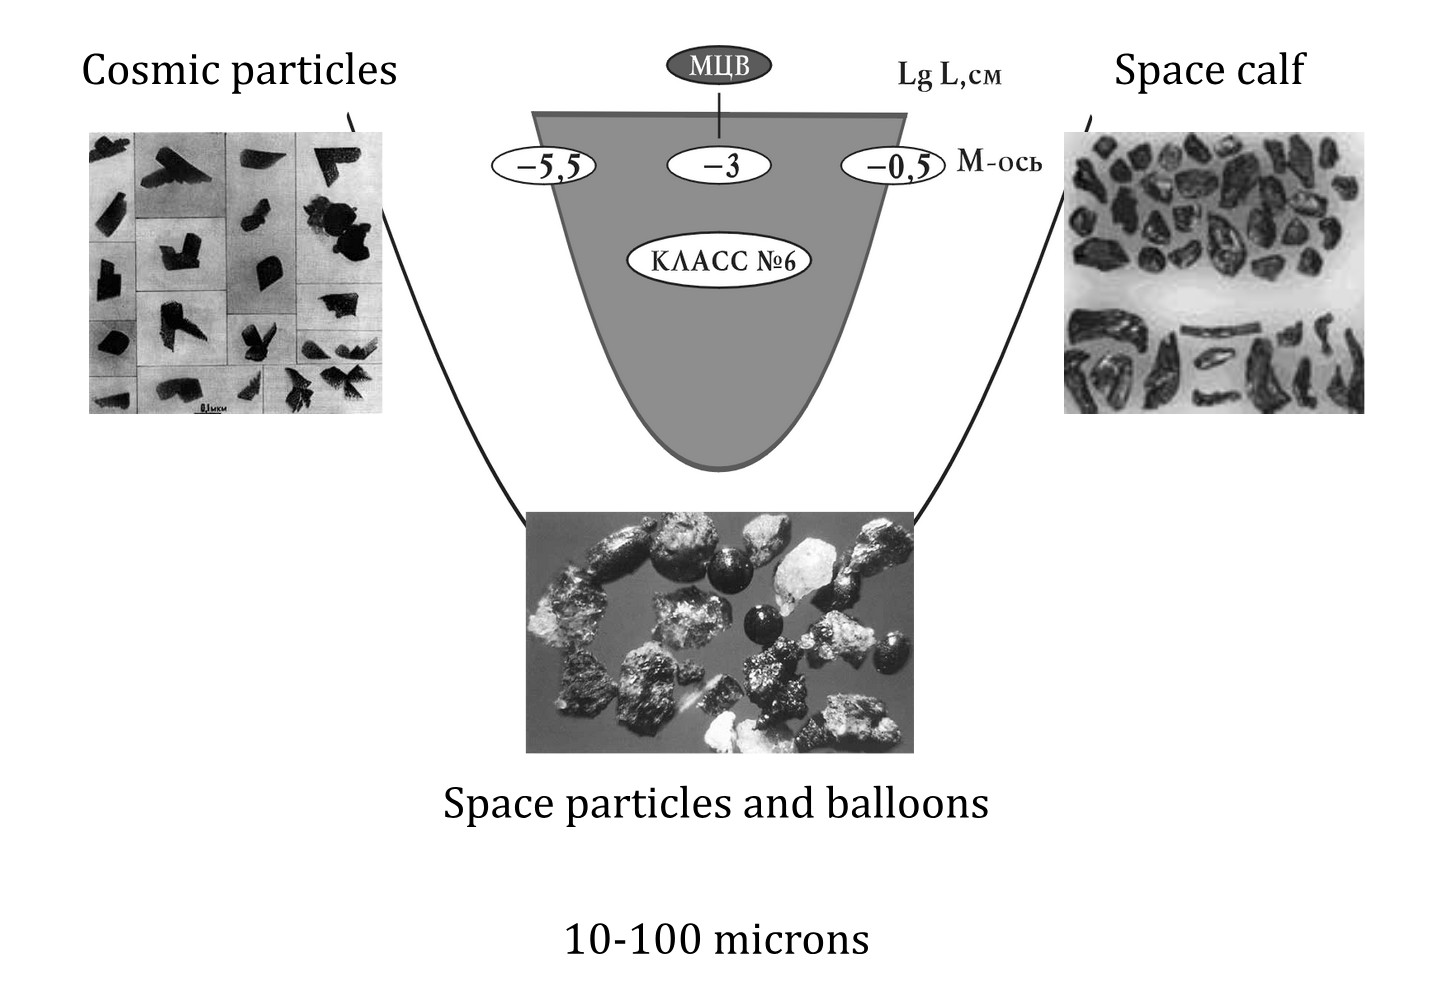 Fig. 1.27A. For reasons still unclear to science, cosmic and volcanic dust particles in the size range from 10 to 100 μm often acquire a spherical perfect shape, although their “neighbors” in size, both to the left and to the right, never occur in the same spherical shape
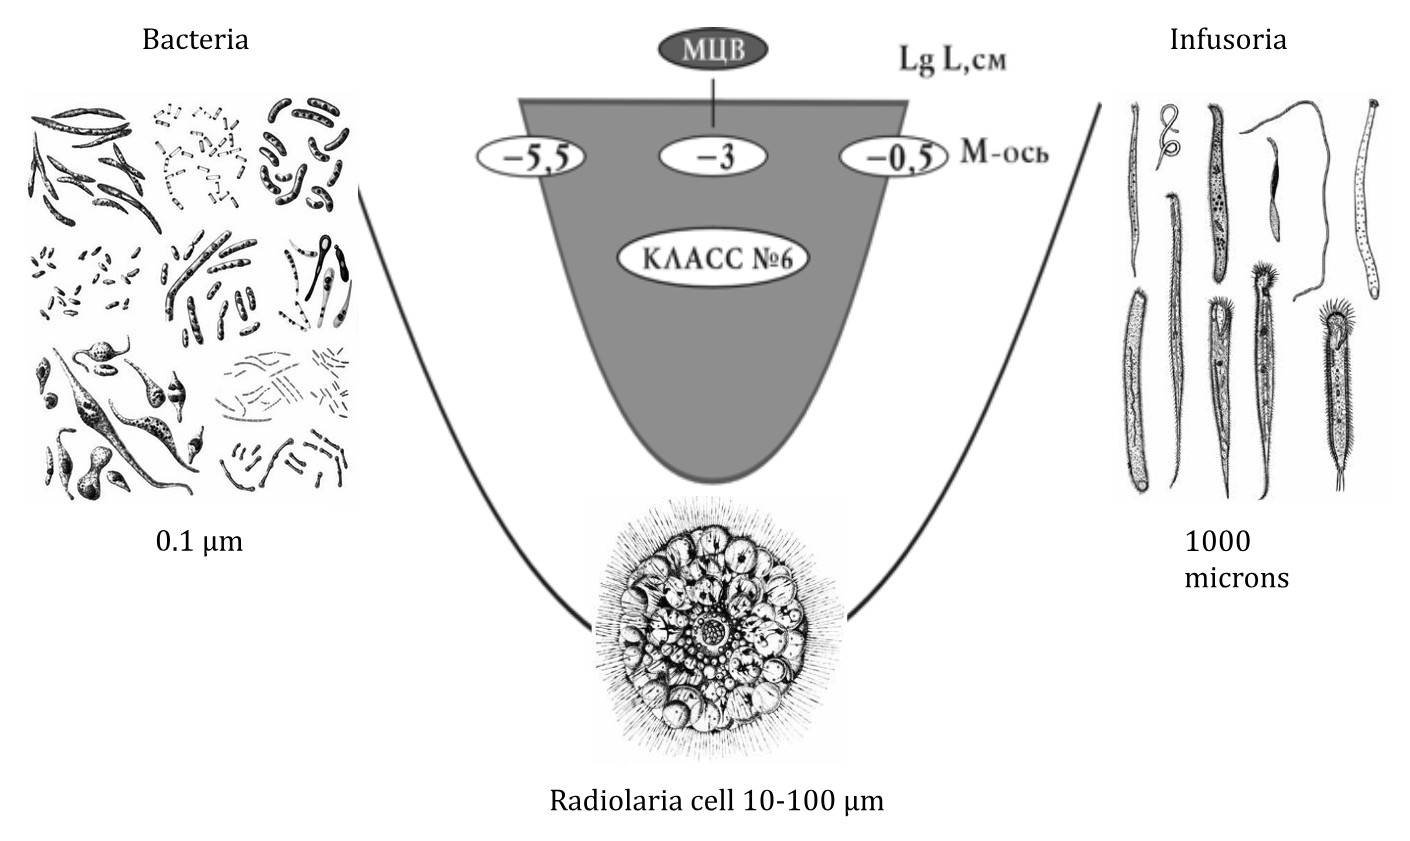 Fig. 1.27B. As one moves along the S-axis from left to right in the “nuclear” class of the life wave, the symmetry of biosystems increases from the simplest types to the limiting ones (spherical and radial) in the region of the ICV (10…100 μm). Then, after passing the zone of ICV, it gradually decreases until it reaches the simplest form - mirror symmetry in the size region for animals, fish, birds, etc.
We failed to find any mention of nuclei and shells in marbles. It can be assumed that in some cases other features of monocentrism may appear in balls, but it is unlikely to expect the presence of all three features in their structure.
Thus, we note that the rare manifestation of monocentrism in the macrocosm coincides with the presence in this range of sizes of the stability trough on the SW, and, moreover, its exact coincidence with the scale center of the Universe. Obviously, the unique appearance of the spherical shape of balls in this range of scales is related to these factors, because it is known: the more symmetric the shape, the more stable the object.
BIOSYSTEMS (CLASSES #6, #7, #8). If we consider the S-interval for biosystems, at its beginning we have the same “primary bricks” as for non-living systems - atoms. Then the “fork” begins.
In non-living systems atoms and molecules form crystalline, amorphous and other simplest systems dominated by the principles of repetition symmetry that form ordered and homogeneous structures. The complication of structures for non-living systems is suspended at this stage.
For biosystems, the complication of structures continues further almost without interruption. Biomolecules evolve into protein molecules, followed by viruses, protozoa, plants and multicellular animals.
However, like a large-scale series of non-living systems, a number of protein systems (except for cells, which occupy a rather narrow interval of the S-axis) are represented mainly by P-structures (see Fig. 1.27B). Let us take a closer look at perhaps the only exception to this series of P-centered structures, the eukaryotic cell (a cell with a nucleus) (see Fig. 1.28). As already mentioned, the average size of eukaryotic cells of almost all species is in the range from 10 to 100 µm.
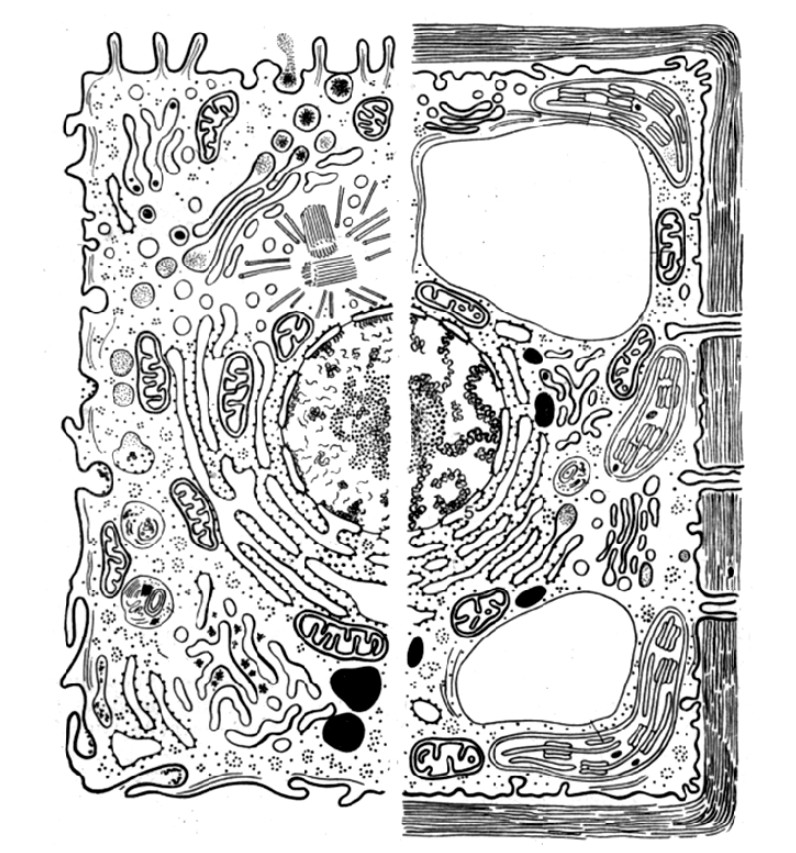
Fig. 1.28. MP structure of a eukaryotic cell (there is a central nucleus)
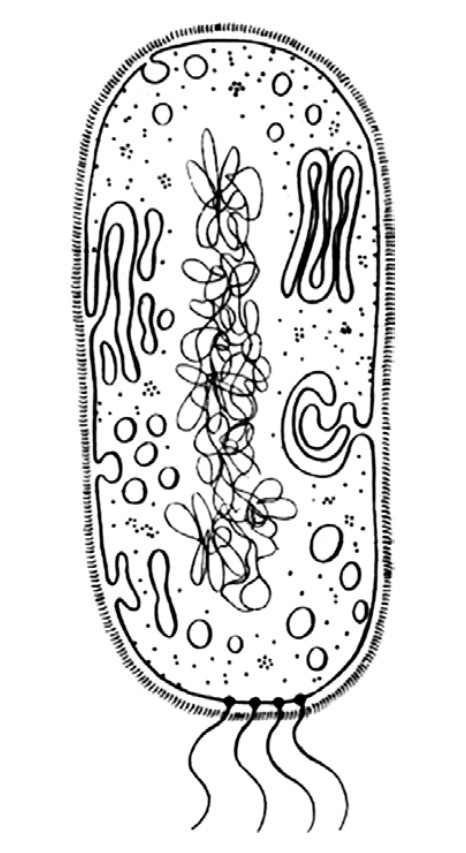
Fig. 1.29. Polycentric structure of a prokaryotic bacterial cell (no spherical shape, nucleus and shells)
They have a nucleus, which contains all the genetic material and controls their development. This is the first thing that distinguishes them structurally from prokaryotic cells (see Fig. 1.29), although, of course, they have many other differences85. In prokaryotes, the genetic material is located in the cytoplasm and is not protected by anything. There is no true nucleus and no nucleolus. In eukaryotes, the genetic material is located in chromosomes inside the nuclei.
What is important for us in this case is that prokaryotes are mainly 0.5 to 5 microns in size, while eukaryotes are usually up to 40 microns. Consequently, the nucleus - as a sign of monocentricity - appears in cells (eukaryotes) whose size exceeds 10 µm.
This does not mean that cells with a nucleus are never less than 10 µm, but most of them are still in the size range of 10 to 100 µm.
Obviously, the cell nucleus, the size of which is on average close to 10-30 µm, is a striking sign of M-structure for living systems. However, there are practically no other signs of monocentricity in them. All cells (eukaryotes) by definition have at least one sign of monocentricity - the nucleus (see Fig. 1.28), but their shape is mostly non-spherical. However, the absence of spherical shape of a cell may be a consequence of the fact that neighboring cells closely adjoin it, and they distort the natural potentially spherical shape of a single cell of a multicellular organism. In fact, many simplest organisms have a much more centrosymmetric structure - cells that exist autonomously, such as radiolaria (see Fig. 1.30), their sizes lie mainly in the range of 40-100 microns. It is not for nothing that they got their name; their radius-radius structure is the 4th additional sign of monocentricity. In addition, many of them have a spherical shape, a central core and sometimes shells.
“A characteristic feature of the structure of radiolarians is the presence of a central capsule … In some species are formed not one, but several balls, nested in each other and connected by radial needles.”
Animal life. Invertebrates. Т. 1 // Edited by L. A. Zenkevich. - Moscow: Enlightenment, 1968. С. 88, 90.
After the size of 100 µm, monocentricity practically recedes (see Fig. 1.27B). Even radiolarians with larger sizes can take an already not so spherical shape or completely non-spherical and even polycentric (see Fig. 1.31). For unicellular organisms with sizes greater than 100 µm (e.g., infusoria), only one of the three main features of monocentricity is inherent in the presence of a nucleus.
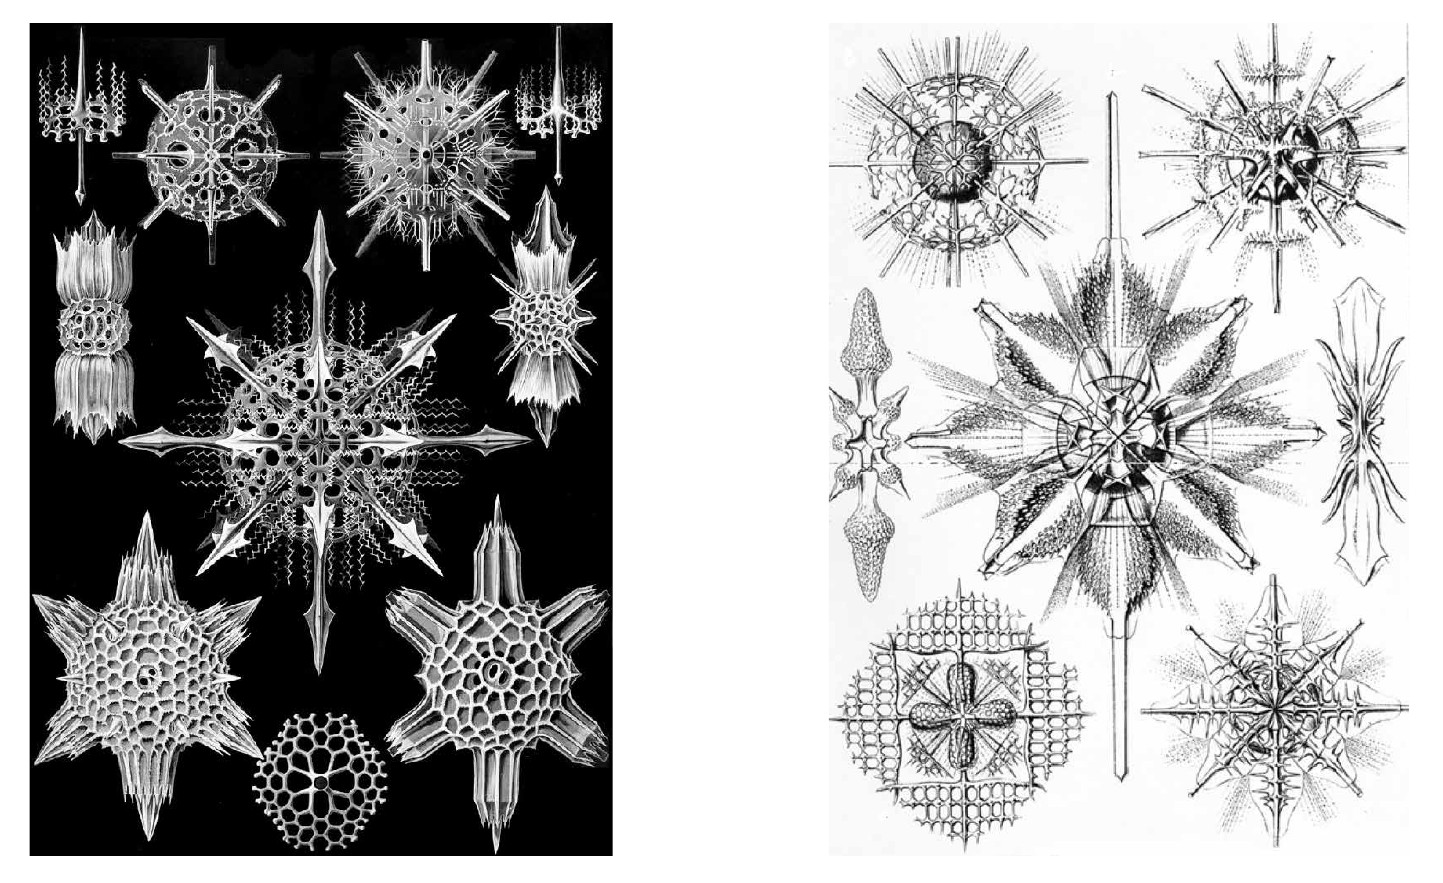 Fig. 1.30. Radiolarians with sizes up to 100 µm possess radial-radial symmetry and have a central nucleus. The figure shows the “skeletons” of these radiolaria
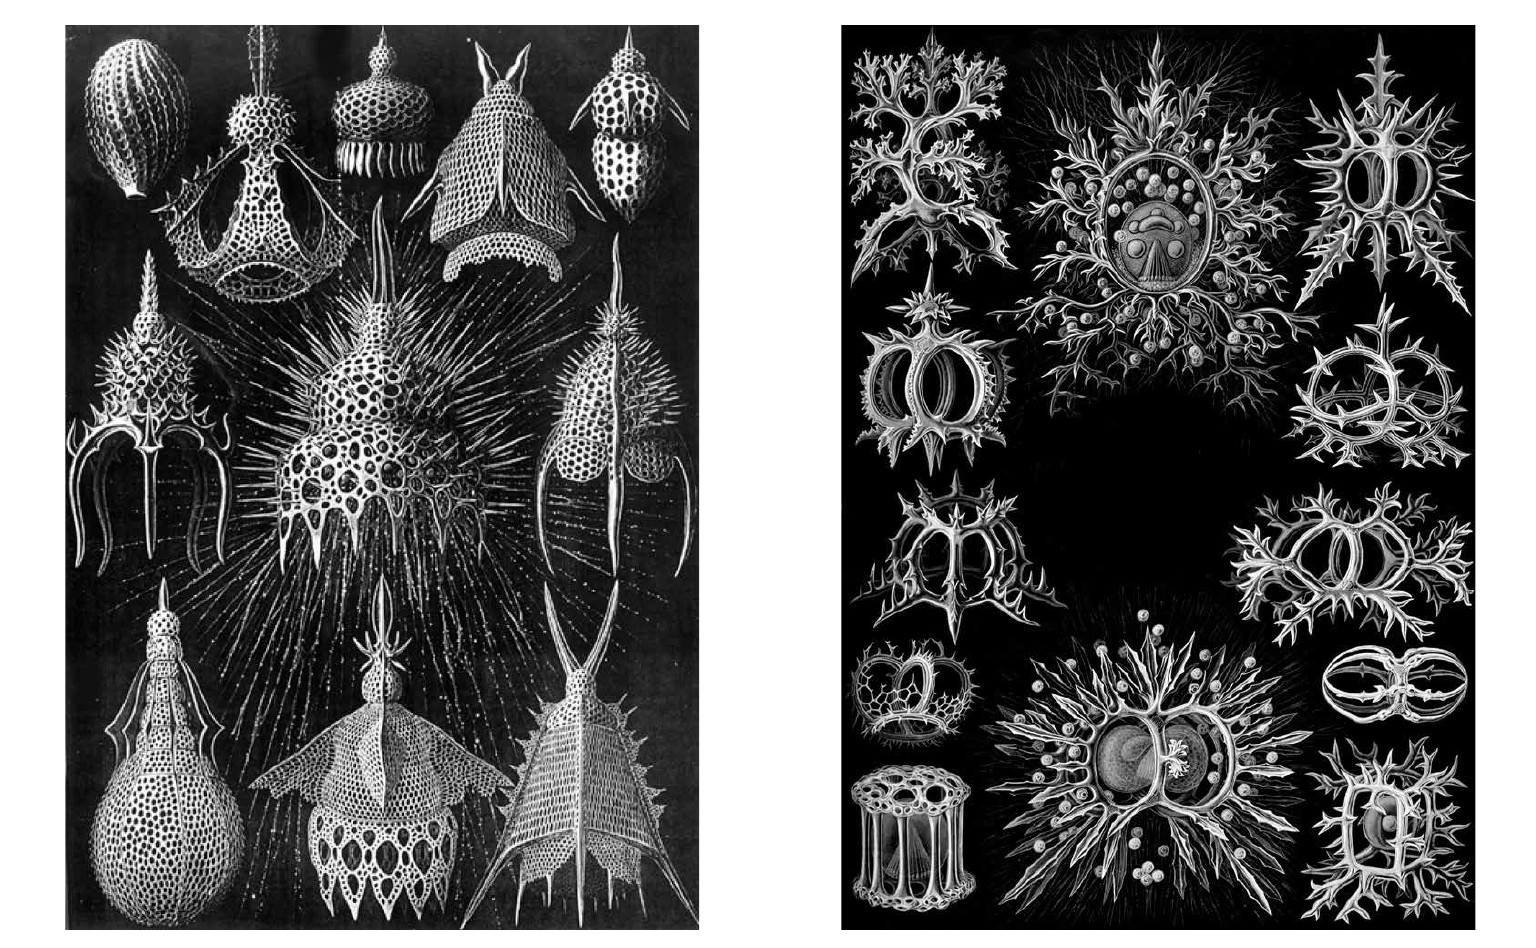 Fig. 1.31. Radiolarias with sizes greater than 100 µm generally have significantly weakened signs of central-radial symmetry compared to smaller individuals
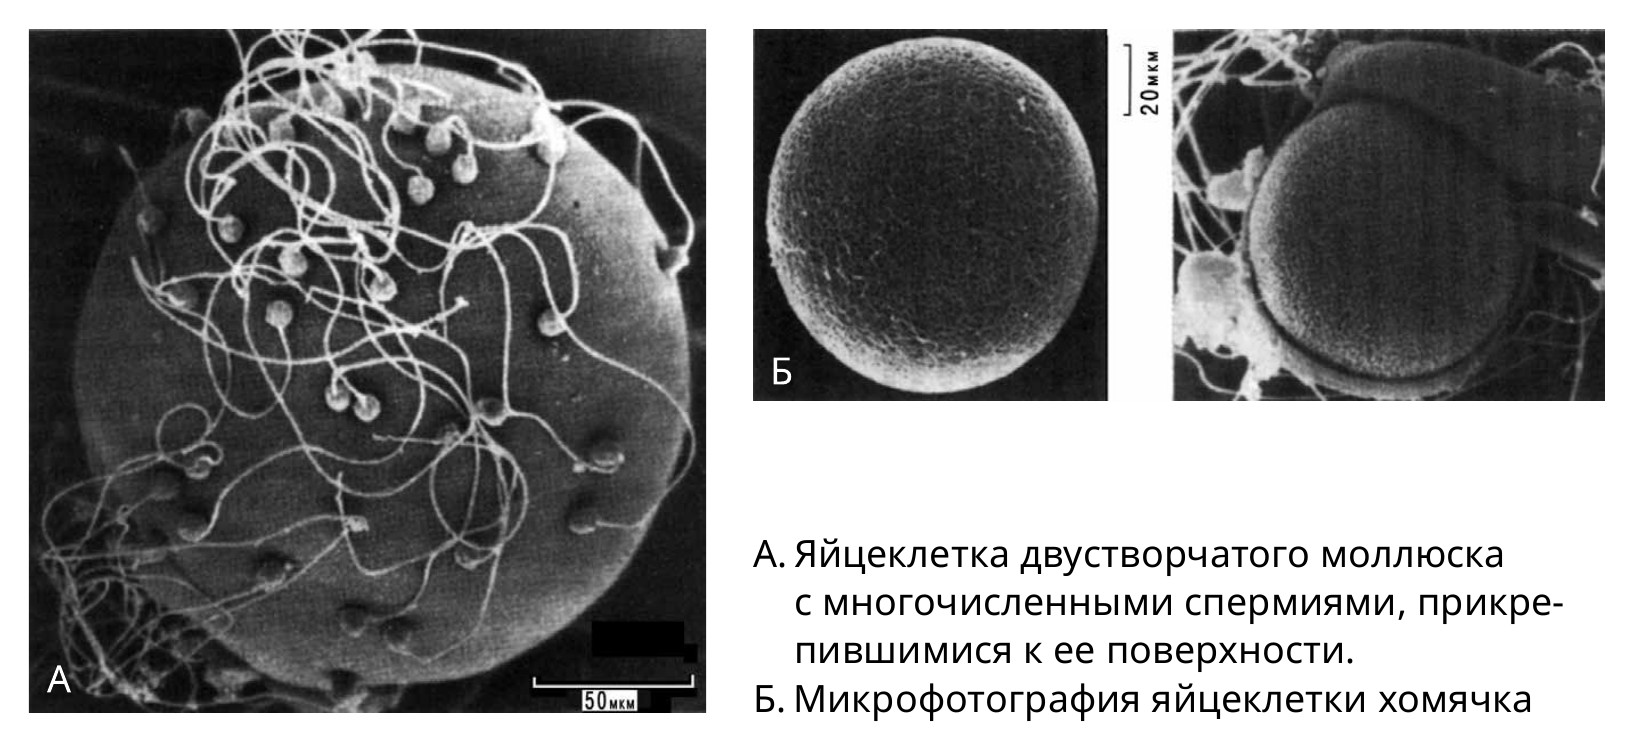 Fig. 1.32. Sexual spherical cells
Thus, we can confidently assert that for protein systems in motion along the S-axis, monocentrism is manifested mainly in the size range of 10-100 µm.
Most pronounced in the germ cells of any organisms, and, in addition, in radiolarians of corresponding size.
Movement along the S-axis beyond 100 µm leads to the dominance of P-type structures and almost complete disappearance of M-type structures (see Fig. 1.27B). The exception is large germ cells, which are most often spherical in shape (see Fig. 1.32) and in some cases reach several centimeters in size (bird eggs, for example).
Therefore, it may be noted that beyond the 100 µm limit, sphericity appears primarily where the system is functionally closest to the reproduction process.
This phenomenon can be called a large-scale memory of shape: germ cells, apparently, at the very beginning of the evolution of biosystems always had sizes from 10 to 100 μm, and only later some of them acquired larger sizes, but they retained sphericity and other signs of monocentricity.
This memory of form is reflected in the eggs of birds and in the seeds of many plants. But what is interesting: signs of monocentricity are manifested as shape memory most strongly in the reproductive organs of many multicellular organisms. For example, ovaries in animals are the organs closest to spherical symmetry, and flowers in plants - to radial symmetry.
If we do not take these and other rare exceptions (sea urchins and similar spherical and radial-radial forms of animals and plants), it is obvious that after the transition from cells to cellular organisms, monocentrism disappears and is replaced by polycentrism again.
This is very clearly manifested in the process of development of the germ cell, which immediately after the first division, turning into a blastula (see Fig. 1.33), goes from a monocentric form to a polycentric - multinucleated, although still mainly spherical.
Thereafter, polycentrism dominates at all scale levels, up to the transition through point B on the S-axis.
In parallel with the loss of monocentric features, as one moves from the 10-100 μm range toward larger systems, the symmetry elements and the degree of symmetry are rapidly lost. As is known86 , the highest symmetry is possessed by a sphere with a center of symmetry, and the lowest symmetry group is mirror symmetry. Therefore, starting from radiolarians and germ cells, which have symmetry close to the maximum, the transition to larger and larger bioorganisms is accompanied by the loss of symmetry, until for many animals, out of all kinds of possible symmetries in Nature, only one - mirror symmetry, the lowest type of symmetry - remains.
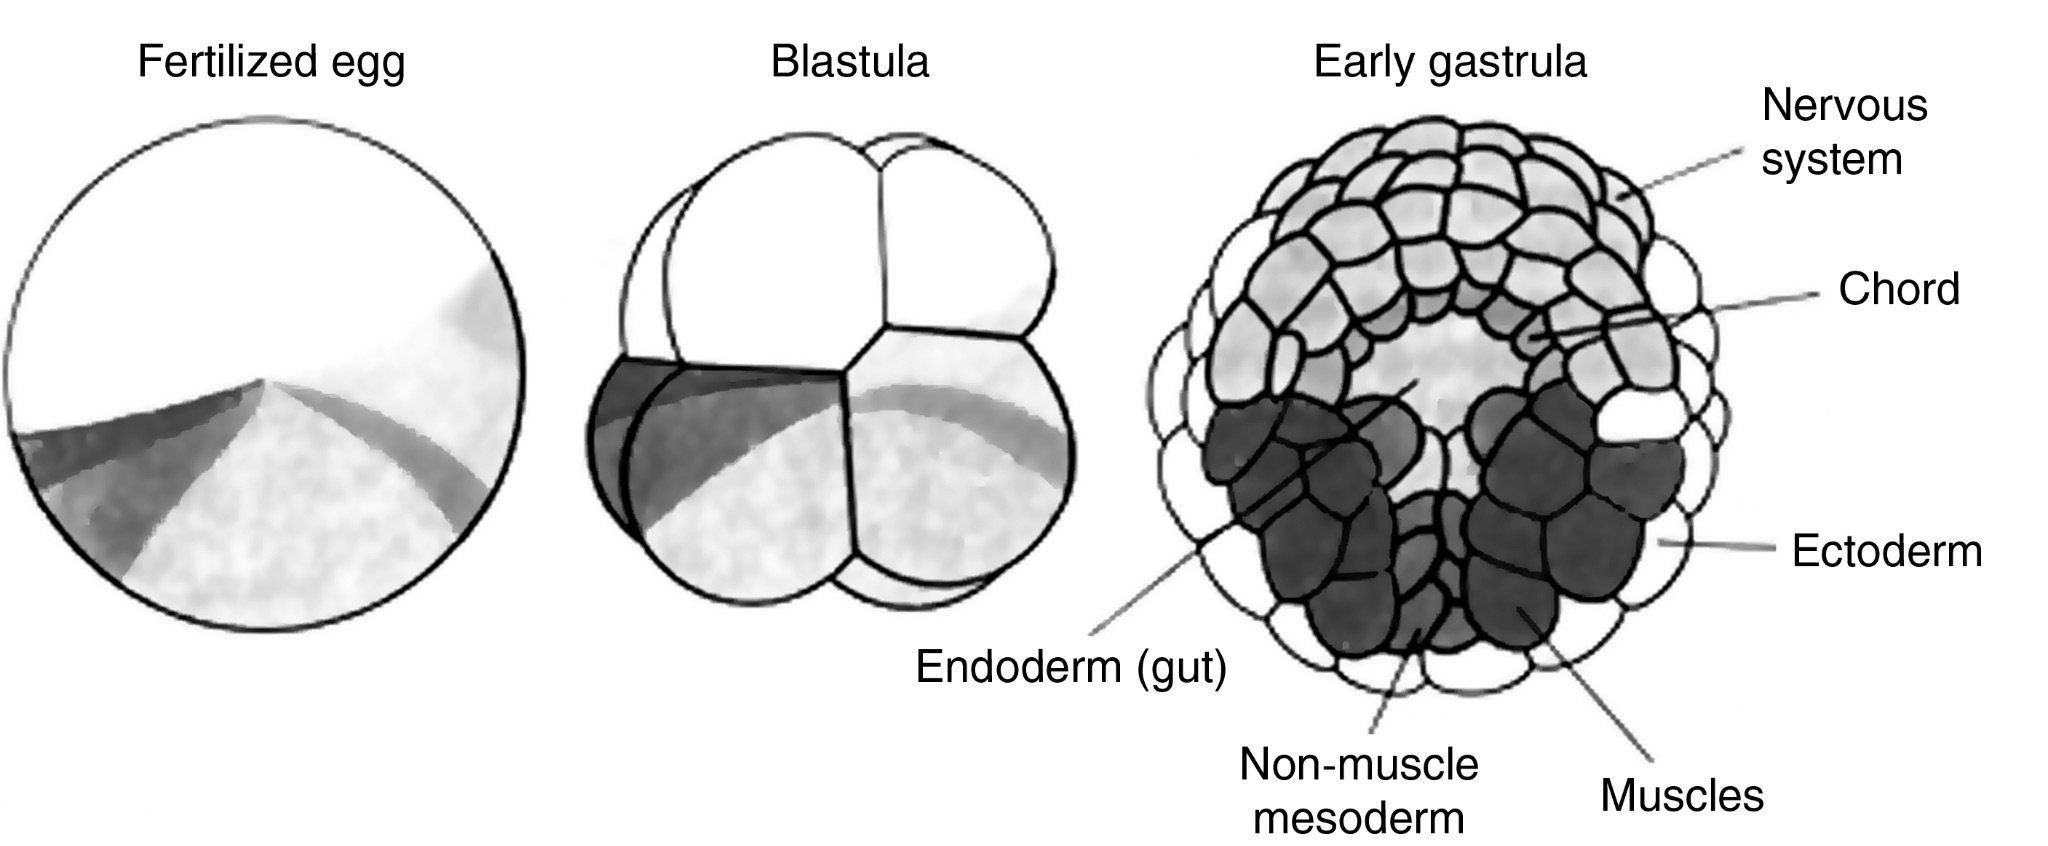 Fig. 1.33. Departure from central symmetry in biosystems. Three successive stages of an organism’s early development are shown. It is evident how nature is rapidly moving away from monocentrism to polycentrism.
Beyond the \(10^{2}\) cm SWS ridge (on which humans “sit”), social and biological community systems mostly begin, as rare animals cross the meter range and rare plants cross the ten-meter range. Polycentric structures also dominate here. Moreover, the symmetry of form and structure is almost completely lost here. So, let us finalize the consideration of biosystems and return to the consideration of the MACRO-INTERVAL as a whole. Let us summarize the results.
Throughout the entire Macro-interval, regardless of the type of systems and their origin, one pattern can be traced: the first order is occupied by transitional forms, the next four orders are exclusively monocentric forms, the remaining 15 orders are mainly polycentric forms.
This allows us to schematically depict the Macro-interval as a two-hump curve (see Fig. 1.26) with a length of 20 orders of magnitude, where the first hump and its top are “populated” by monocentric structures, and the rest of the space - by polycentric structures of different types.
The only exception in the polycentric section is the depression between the humps (SCU), where one order is populated by monocentric structures, although with not fully expressed features. Moreover, despite the huge difference in structure and formation conditions between cosmic and volcanic dust, unicellular organisms and cells within organisms, in the range 10-100 μm, which exactly corresponds to the middle part of the macrowave (and the bottom part of the highest stability at the corresponding section of the HU), there is a noticeable and very statistically significant increase in symmetry, which is manifested mainly in the radial-spherical shape and the presence of a nucleus.
These facts allow us to assume the existence of a SINGLE MASSIVE FIELD WHICH REGULATES THE DEGREEOF SIMMETRY AT ALL LEVELS OF THE HIERARCHY OF THE UNIVERSE, about which we will speak further.
Summarizing all the above, it can be noted that electromagnetic forces immediately after the beginning of the Macro-interval manifest themselves in the structural arrangement of atoms very brightly. Here, as if their qualitative formation takes place. At the remaining 15 orders, there is a quantitative increase of both the mass of structures and their complexity.
-
Zafiratos K. D. Structure of the nucleus surface // Physics of the atomic nucleus and plasma. M.: Nauka, 1974. P. 45. ↩
-
Baranger M., Sorensen R. A. Size and shape of atomic nuclei // Physics of atomic nucleus and plasma. M.: Nauka, 1974. P. 30. ↩ ↩2
-
Zafiratos K. D. Structure of the nucleus surface // Physics of the atomic nucleus and plasma. M.: Nauka, 1974. P. 28-43. ↩ ↩2
-
Baranger M., Sorensen R. A. Size and shape of atomic nuclei // Physics of atomic nucleus and plasma. M.: Nauka, 1974. P. 37. ↩
-
Zafiratos K. D. Structure of the nucleus surface // Physics of the atomic nucleus and plasma. M.: Nauka, 1974. P. 44. ↩ ↩2
-
Mukhin K. N. Physics of atomic nucleus // Experimental nuclear physics. Т. 2. M.: Atomizdat, 1974. P. 273. ↩
-
Mukhin K. N. Physics of atomic nucleus // Experimental nuclear physics. Т. 2. M.: Atomizdat, 1974. P. 277. ↩
-
Ginzburg V. L. On Prospects of Development of Physics and Astrophysics at the End of the Twentieth Century // Physics of the Twentieth Century. Development and Prospects. Moscow: Nauka, 1984. P. 281-330 ↩
-
Zheludev I. С. Symmetry and its applications. Moscow: Atomizdat, 1976. P. 14. ↩
MEGA-Interval
Let us consider the Mega-interval (Fig. 1.34). It starts from the right border of the Macro-interval - with the sizes from \(10^{7}\) to \(10^{8}\) cm.
In this size range, two types of systems are of particular interest: planets and stellar cores. On the Earth, structures of this scale are fragments of the lithosphere, the study of the regularities of their size distribution87 has only recently begun. PLANETS (CLASS #8). Up to the size of planets, cosmic bodies are not monocentric. All cosmic bodies in the range from atomic size to asteroids have polycentric structure - they are composed of atoms uniformly or chaotically distributed throughout their volume. The reason is the short-range action of electromagnetic forces at such scales. There is no smoothing of shape: all bodies have a pronounced chaotic, fragmentary shape.
As was shown in Chapter 1.3 (see Fig. 1.10), the real boundary between formless asteroidal bodies and spherical planetary forms is somewhere in the neighborhood of 300-500 km. Thus, in the range from \(10^{7}\) to \(10^{8}\) cm, both polycentric and monocentric bodies are found, with a tendency to transition from polycentrism to monocentrism as the size increases. It is very important to note that a similar situation with the structural transition can be found on the S-axis, if we move along it exactly 20 orders of magnitude to the left. We have shown above that it is there that the transition from polycentrism to monocentrism takes place in atomic nuclei.
Thus, it is from the first order of the Megainterval that the spherical bodies of planets begin to form. Let us consider when other signs of monocentrism appear: nuclei and shell structure.
There is no reliable evidence that planets smaller than 1000 km (\(10^{8}\) cm) have nuclei. Perhaps the Moon, which is \({3.4}\cdot{10^{8}}\) centimeters in diameter, has a nucleus. “According to the velocity distribution … the Moon may have a small core with a radius of a few hundred kilometers. The core is in a molten or semi-molten state, since transverse waves do not pass through it, and consists of Fe-FeS solution.”1
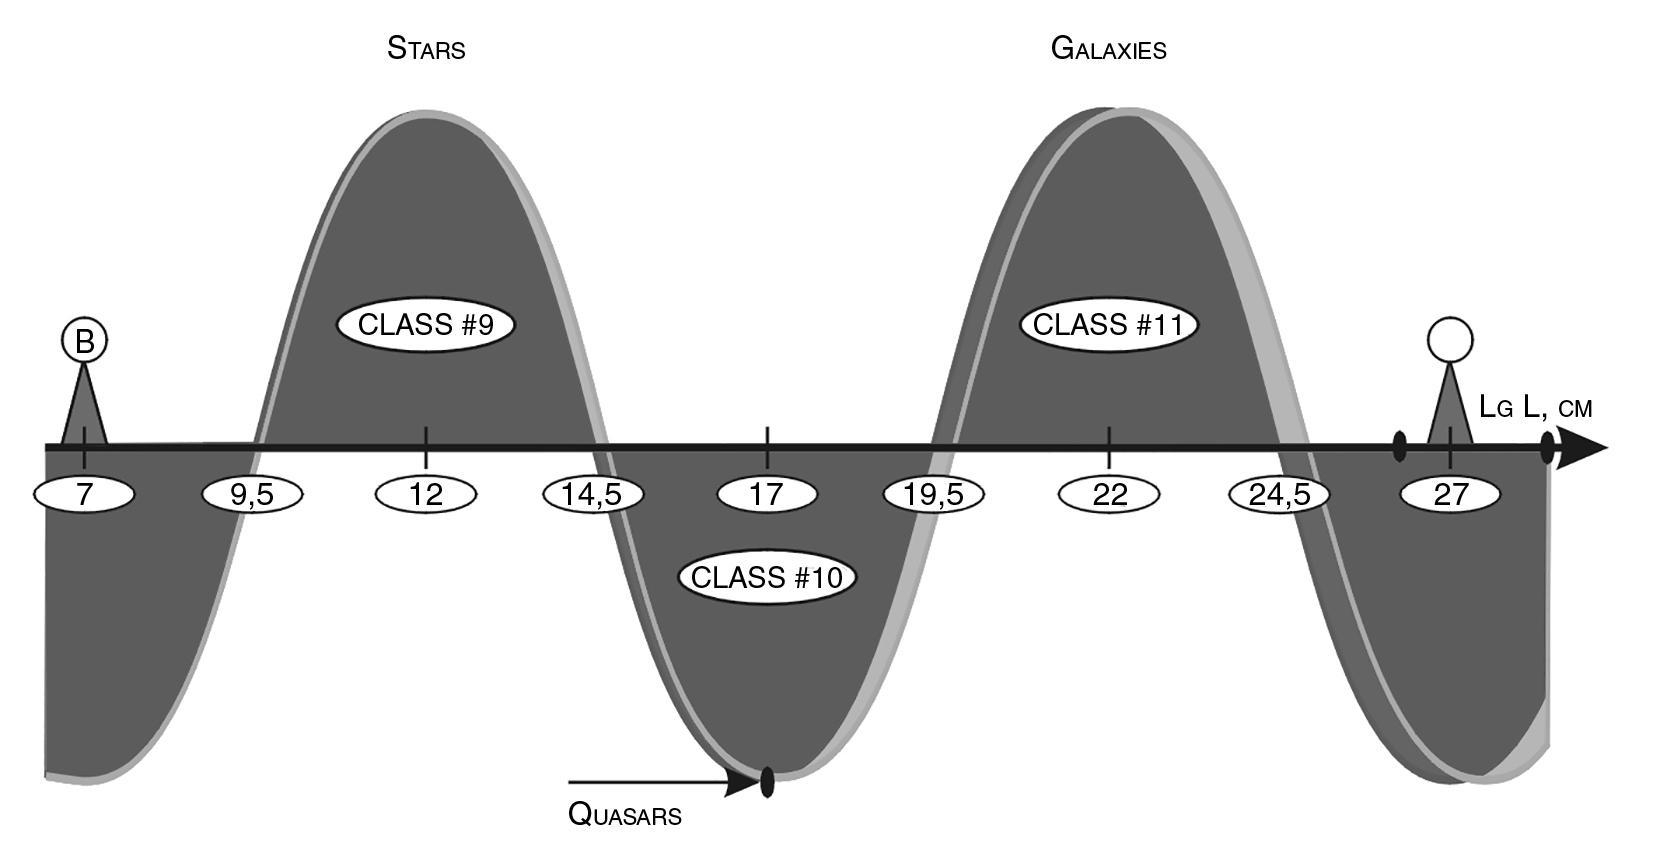 Fig. 1.34. A mega-interval of 20 orders of magnitude extends from point B to point C
Since the magnetic field is an indirect sign of the activity of the planet’s core, a sign of its presence, then by its magnitude you can tell if a planet has a nucleus. Thus, the Moon has a magnetic dipole \(10^{6}\) times smaller than that of the Earth and 300 times smaller than that of Mars. However, even Mercury, which has a diameter of 5000 km, has a magnetic field of about 0.7% of the strength of the Earth’s magnetic field2, which allows planetologists to assume that it has an iron core occupying 50% of the planet’s volume. As for the Earth, whose dimensions exceed \(10^{9}\) cm, there is little doubt that it has a core — it has an inner core3 with a diameter of more than 2000 km (\(~10^{8}\) cm).
The spherical Moon, which probably has no pronounced core, most likely has a polycentric internal structure. The fact is that strong gravitational inhomogeneities have been found on its visible side4. “In 1968, Muller and Sjögren, studying the gravitational field of the Moon, discovered large positive anomalies and introduced the concept of mascons as sources of these anomalies”5. Subsequently, “when the first spacecraft launched into orbit of the satellite of the Moon began their work, scientists were surprised to find that the satellite of the Moon moves somewhat unusually. In its movement were noticeable small jerks … It turned out that the outer layers of the Moon to a depth of several hundred kilometers is not homogeneous. It is as if a number of large blocks, sprinkled outside sand (italics mine — S. S.), giving the whole structure the shape of a ball. Some of the mascons even go to the surface of the planet.”6 This suggests that there are large formations in the body of the Moon, which were either embedded in it after its formation, or formed as a result of internal processes, or are the remains of large primary bodies. Their mass is of the order of \(10^{21}\) grams, which allows us to estimate the order of magnitude of these large formations at about \(10^{7}\) cm. This fact shows that for such planets as the Moon (and the Earth), primary bodies of hundreds of kilometers in size could be components that entered the planet as independent ready-made blocks. This leads us to the simple conclusion that small planets in the 100–1000 km range may have a blocky-polycentric rather than shell-like structure. Hence, planets, like the nuclei of atoms, may have a mixed MP structure. The PROPOSAL of a heterogeneous structure of small planets is consistent with the jet stream model of H. Alven and G. Arrhenius7. It is unlikely that only one primary nucleus was formed from the primary cosmic dust in the jet stream, on which the dust would then adhere (such a mononuclear model can be called the “snowball” model). Calculations of the rate of sticking of particles on one planetesimal nucleus, as estimated by these authors, showed that such a process could not have led to the formation of planets even during the entire existence of the Solar System. Most likely, several such clumps were formed in parallel, and only then their macro assembly occurred (such a model of planet formation can be called the “snowball” model). At the moment of final assembly of the planet from giant blocks, a part of planetesimals due to powerful collision impacts collapsed, forming meteorites and asteroids. Estimating the size of planetesimals provides a boundary that has a special place in SWS: “On the basis of interpretation of the available data on the peculiarities of crystal growth in iron meteorites in the presence of diffusion, the sizes of bodies appear to be of the order of a hundred or several hundred kilometers”8.
Thus, there are many reasons to believe that polycentricity with a scale of inhomogeneities of 100-1000 km is the result of the macro assembly of planets at the final stage of their appearance. Traces of it, apparently, are preserved in larger planets of the Earth group, although their manifestation here is distorted by gravitational forces.
So, it can be PROPOSED that from a size of \(10^{7}\) cm to a size of \(10^{9.5}\) cm (i.e., for all Earth-group planets and minor planets), the heterogeneity of structure should play a much larger role than in modern theories of planetary structures based on traditional shell models. (Of course, for these planets, the shell structure also plays a huge role, which, together with the block structure, organizes the complex structure of planets of the Earth type.) Here it is also important to note that the scale of the main planetary blocks, as estimated by various authors, converges on sizes of hundreds of kilometers, which exactly corresponds to the lower region of the nuclear half-wave of the Mega Interval: \(10^{7}-10^{8}\) cm.
On the basis of the above we can draw a very important CONCLUSION. At the \(10^{7}-10^{8}\) cm boundary there is a change of the POLYCENTRIC STRUCTURE of cosmic bodies to MONOCENTRIC.
And while for small planets the question of the presence of a core and a clear stratification by density into deep bodies is debatable, for terrestrial scale planets (greater than \(10^{9}\) cm) this question does not arise.
Already for Mercury (\(5 \times 10^{8}\) cm) the presence of the nucleus is not doubtful. Consequently, if the first sign of monocentricity — spherical shape — appears somewhere at the boundary of sizes \(3 \times 10^{7}\) cm, then the second and third signs — nucleus and shells — appear, apparently, somewhere at the boundary of \(3 \times 10^{8}\) cm (see Fig. 1.35).
STAR NUCLEI (CLASS NO. 8). “Living” stars have sizes larger than \(10^{10}\) cm, so there are no representatives among them that would be located on the S-axis in the scale zone of the transition from polycentrism to monocentrism (\(10^{7}-10^{8}\) cm). But it is in this size range that neutron stars (NS) are located. What are they?
According to R. Wald, the NSs are huge nuclei similar to atomic nuclei. Indeed, like nuclei, they consist exclusively of densely packed nucleons (all electron shells of former atoms are destroyed by gravity). Because of this, the NSs have a monstrous density, the same as the nuclei of atoms.
So, neutron stars are polycentric systems — in many respects similar in structure to the nuclei of atoms. Isn’t it amazing that nature has placed these exotic objects in a size range that is almost exactly \(10^{20}\) times the size of nuclei!? What could be a better example of the scale similarity of structures at such gigantic scale distances!? Let’s turn to the MACRO INTERVAL for a moment. From the left and right edges of the Macro-interval Nature has arranged the nuclear type of structure. Moving along the S-axis from left to right, one can see how at “entering” this interval the P-structures of the Micro-interval are transformed into the M-structures of the Macro-interval (see Fig. 1.26), and similarly at “leaving” it: the P-structures of the Macro-interval are transformed into the M-structures of the Mega-interval. WHAT IS AT THE TOP IS ALSO AT THE BOTTOM.
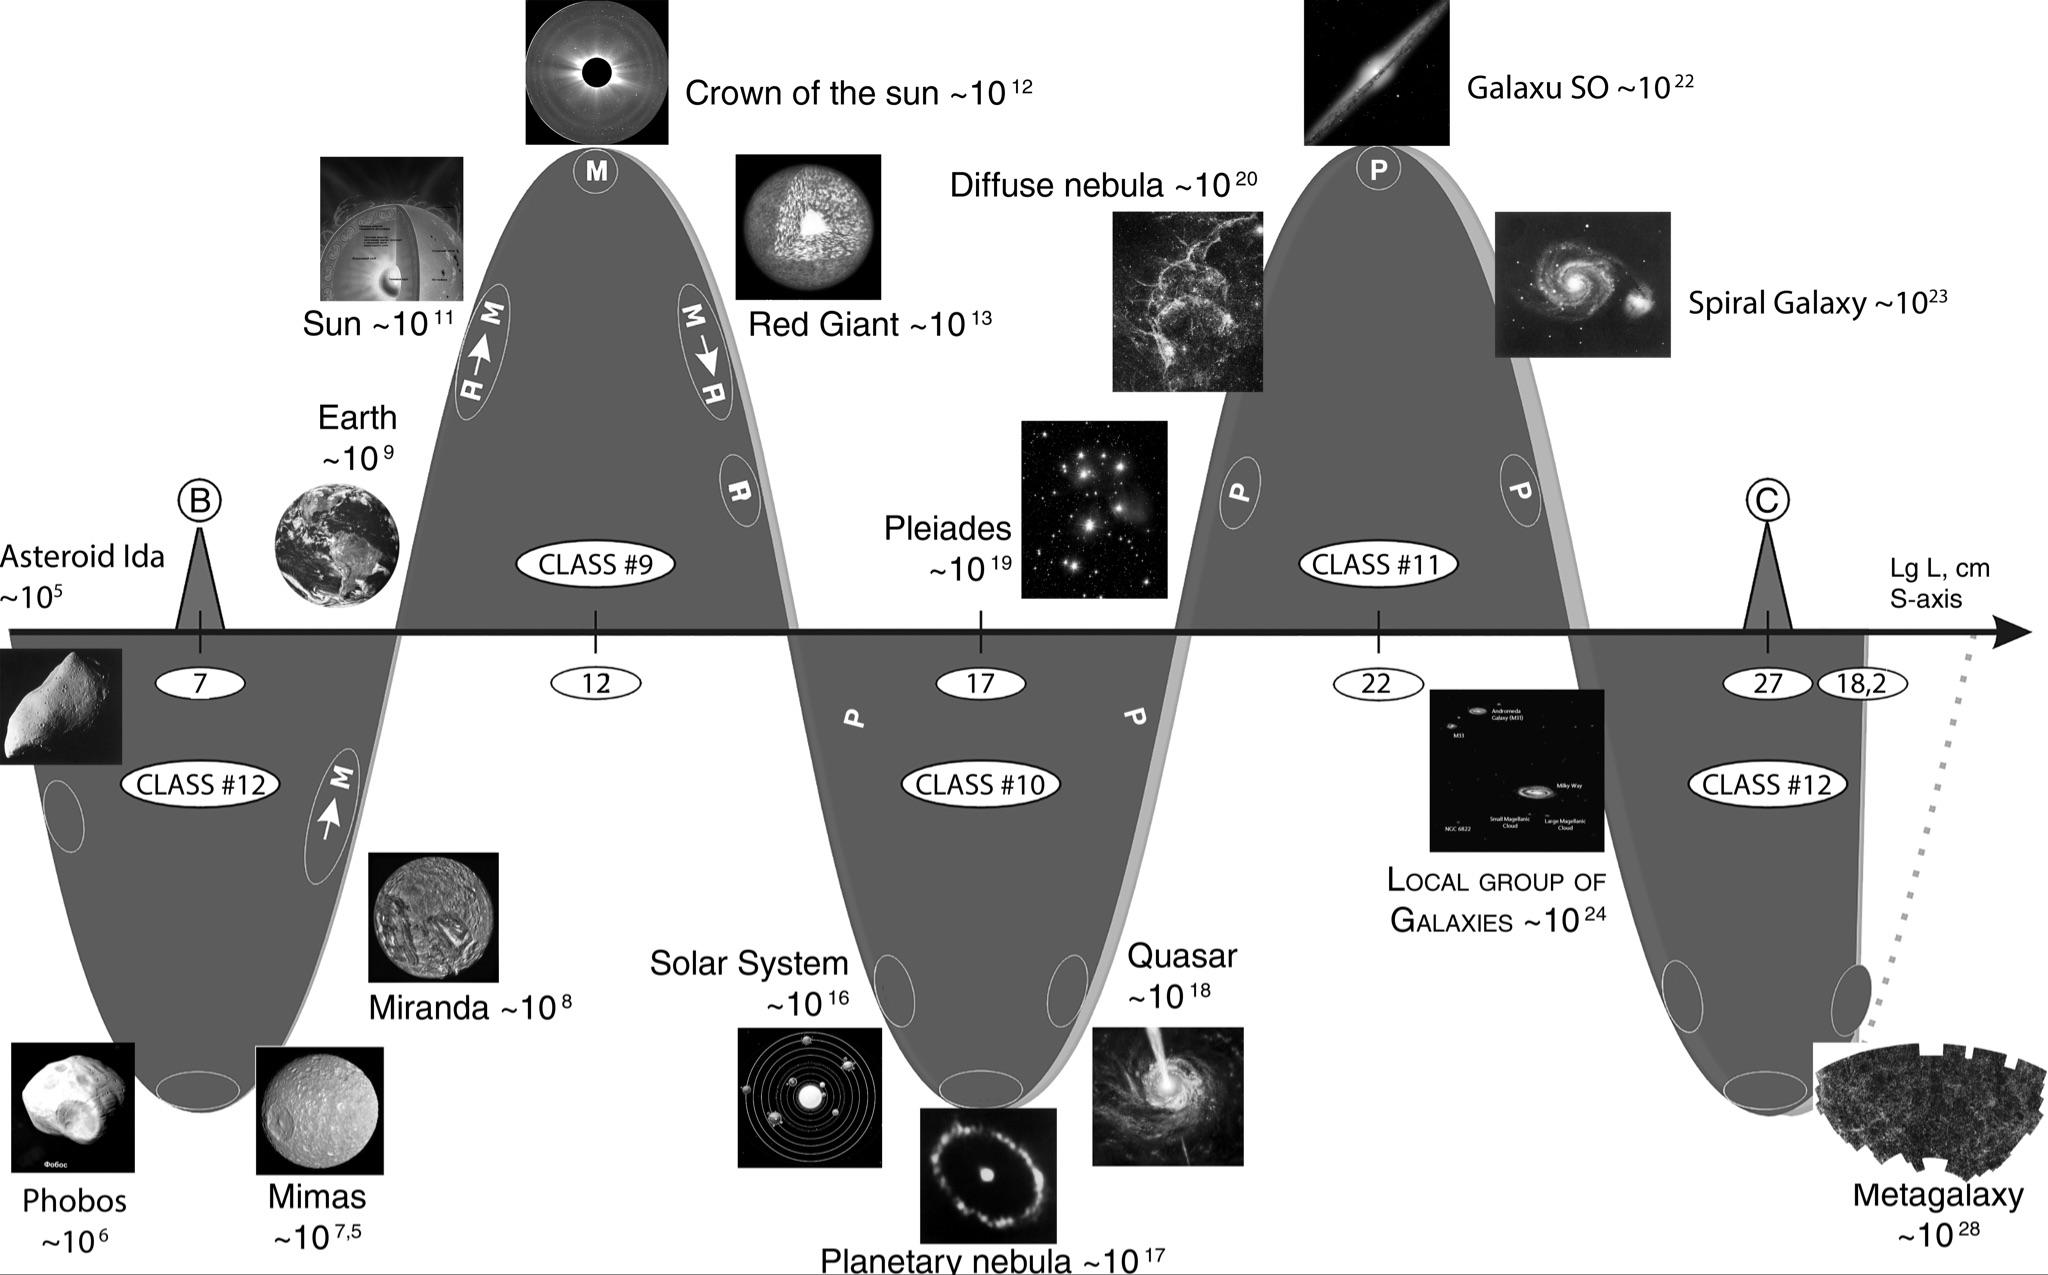 Fig. 1.35. Mega-interval showing the transition from polycentrism to monocentrism. Dimensions are given in cm
However, besides similarity, there is also a difference (however, probably imaginary). Thus, atomic nuclei consist of nucleons, the number of which does not exceed a few hundreds, while the NSs consist of a huge number of nucleons — of the order of \(10^{60}\). Obviously, within the framework of the classical approach, there is not and cannot be complete structural similarity here. For a full structural similarity neutron stars (NS) lack a macro cluster structure. However, such a structure cannot appear due to electromagnetic forces, because on such scales they simply cannot compete with gravitation in their effect on matter. And even more macro cluster structure cannot be a consequence of gravitational forces, which have a strict central symmetry. In spite of this, can we still hope that nature has taken care of the full scale similarity with a step size of \(10^{20}\)? If so, then the sizes of the order of \(10^7\)-\(10^8\) cm should be characterized by structures that are not just polycentric, but cluster-polycentric. In other words, EOs should consist of dozens of or hundreds of mega clusters.
However, in astrophysical theory, in principle, there is no place for the mega cluster model of NS. In most theoretical models, neutron stars have a partially shell structure 9 (see Fig. 1.36). It is impossible to imagine any other structure based on the classical idea of gravitational and electromagnetic forces of nature. After all, gravity is the dominant force for EOs (because of their monstrous density and mass). It can only pull the matter to the center of mass. At that, if any diversity is possible, it is only due to segregation of matter by density in strict dependence on the distance to the center of mass. That is why in classical astrophysics it is impossible, even by way of hypothesis, to assume the existence of a globally polycentric structure in such objects as the EO.
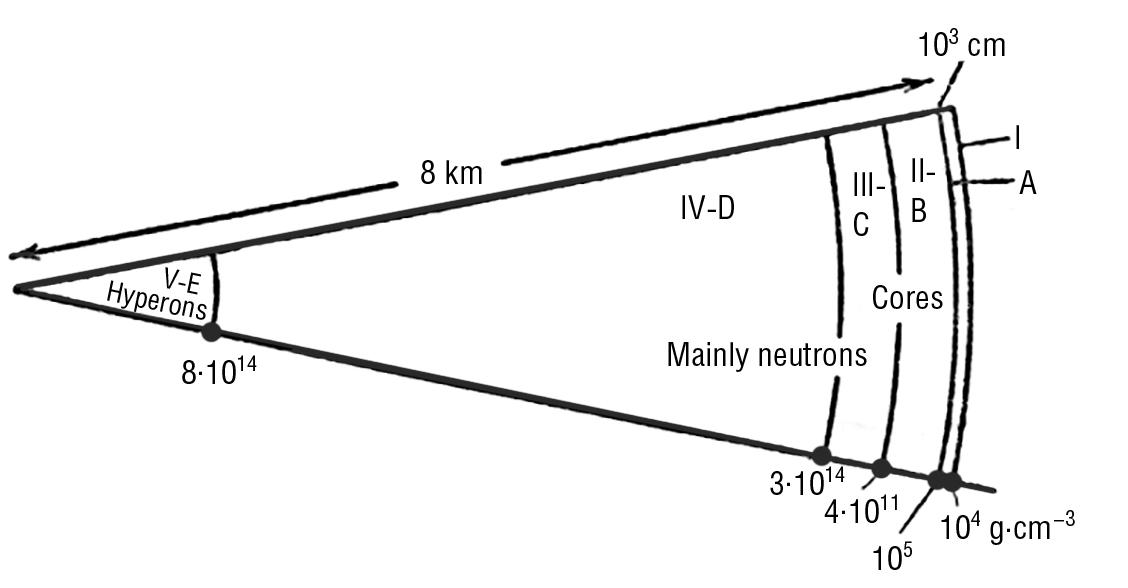
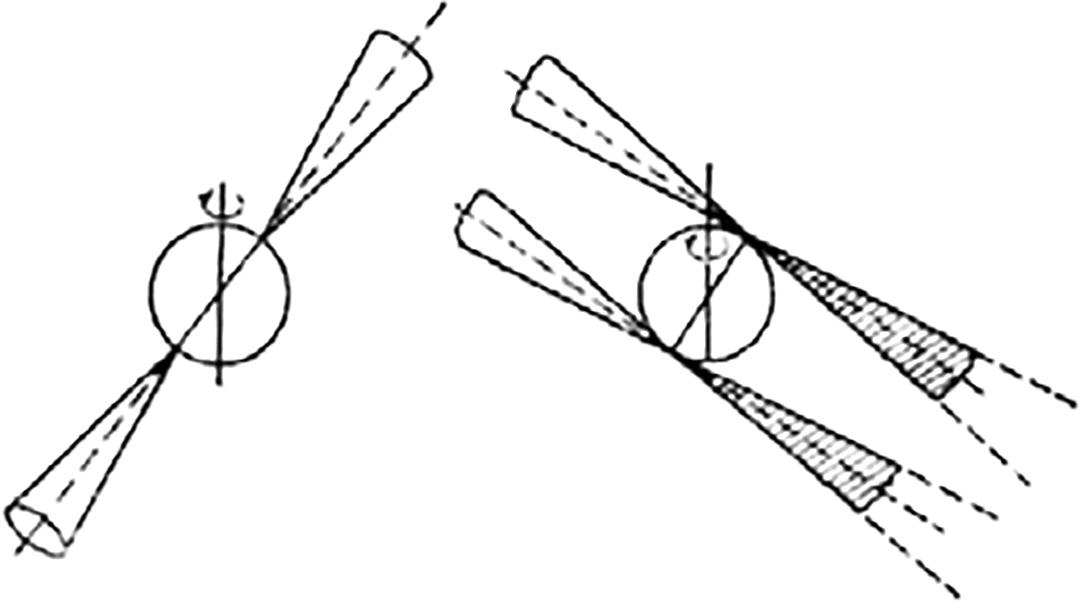 Fig. 1.36. А. Probable block-polycentric structure of a neutron star (in the author’s opinion). B. The shell structure of a neutron star (according to I.S. Shklovsky). C. Fan model of pulsar emission (according to I.S.Shklovsky)
There is absolutely no theoretical basis in the theory of gravitation for the appearance of any “mascons” or “separateness” within objects such as EO.
However, observations of the EO have brought so many paradoxical puzzles that the shell model, in fact, does not withstand any criticism today. Let’s consider these riddles and in general the PROBLEM of stars’ cores in details.
Astrophysics knows little about the structure of the nuclei of stars and other formations of such small sizes. In all cases, this is the domain of modeling. The exceptions are neutron stars and white dwarfs - naked nuclei, which are accessible to direct observation. However, because of their great remoteness and small size, their structure also remains the domain of theoretical calculations based on indirect data on mass, luminosity, etc. parameters. Nevertheless, those neutron stars that are in an active state provide additional information about themselves. We are talking about pulsars.
Pulsars were discovered in the 1960s and since then have never ceased to amaze and baffle astrophysicists. It turned out that pulsars are neutron stars rotating at tremendous speed and emitting short pulses of radio emission. Since neutron stars are formed from rotating stars of much larger size, based on the condition of conservation of momentum, the equatorial velocity of a contracting star must increase by as many times as its radius decreases (think of the rotation of a figure skater on ice). “At the final stage of contraction, when a neutron star is formed, its equatorial velocity can be enormous, even close to the speed of light!” 10 If the Sun suddenly became a neutron star, its rotation period would be reduced from 27 days to one ten-thousandth of a second.
Imagine now that in open space in vacuum a sphere with a giant (nuclear) density rotates at a tremendous speed, since it consists of almost only nucleons. The size of this sphere is about 100 km. Such a giant wolf has no reason to slow down, because it rotates in the void; there is no reason to lose energy, because all nuclear reactions in it have already stopped; there is no reason to change its size by leaps, because according to the accepted theoretical models it is a homogeneous body; there is no reason to have inhomogeneities on the surface, because gravity, which created and holds it, gives it strictly spherical symmetry and does not allow any deviations from it.
Contrary to all these obvious reasons for astrophysics reasoning, pulsars violate them and violate them so clearly that they leave no chance to ignore their paradoxes.
“…There are more than enough unsolved problems in the physics of neutron stars… It must be said bluntly that to date there is no universally recognized quantitative theory… of pulsars.” 11
The first task of pulsar physics is “to understand why rotating neutron stars brake, thus continuously releasing energy.” 12 As I.S. Shklovsky’s analysis of this question showed, magnetic fields cannot cause this effect. The most probable cause, according to I.S. Shklovsky, is the emission of gravitational waves by the pulsar, but what it is — classical physics still cannot determine. The second task is to explain the phenomenon of “star-shaking” — a jump-like decrease in the rotation period of the pulsar. “Such a strange phenomenon can only be explained by a real jump-like change in the rotation period of a neutron star. The change in the rotation period, in turn, must be a consequence of a sudden decrease in the moment of inertia of the star, caused by some complex processes in its interior.” 13
The third task is to explain the “fan” or “pencil” character of pulsar radio emission. The point is that a pulsar shines like a lighthouse — a narrow rotating beam, which we see only at the moment when it “brushes” the Earth with it (see Fig. 1.36B). At the same time, pulsar emission profiles consist of much narrower sub-pulses.
According to I.S. Shklovsky, such a phenomenon can be caused only by the “spotty” structure of the radiating surface of pulsars. Moreover, each spot is strictly fixed relative to the pulsar body and does not wander around it, neither disappears nor appears unexpectedly. Thus, this “panther coloring” of the pulsar can serve as its radio passport.
“What reason ‘keeps’ the radiating spots in strictly defined regions around the rotating star?” — asks I.S. Shklovsky. He answers that “such a reason can only be a very strong magnetic field.” 14 Although he does not explain how an absolutely homogeneous ball filled with neutrons (hence the name of stars) can have such a rigidly inhomogeneous magnetic field. His reasoning, however, can be understood.
Gravitational forces are initially monocentric and are not able to create heterogeneity at such masses and sizes, so it remains to attribute everything to magnetic fields, in classical astrophysics there is simply no other option. In this case, the calculations should give convergence. What is there to check?
Of course, astrophysicists are somehow trying to explain all these bright anomalies, but all attempts to build models of pulsars remain unsuccessful. The reason for this, in our opinion, is the failure to take into account the peculiarities of the location of pulsars on the S-axis.
After all, if the scale similarity with the coefficient \(10^{20}\) is real, then pulsars should be similar to the internal structure of atomic nuclei, i.e., have a macro-polycentric structure. Their nuclei should be as inhomogeneous as the nuclei of small planets of the same size range. And these “mascons”, or inhomogeneities, of neutron stars can create a gravitational imbalance of the star’s body, which will cause it to lose energy (gravitational waves). These same inhomogeneities, in the author’s opinion, are the cause of the “spotty” radiation of the pulsar.
Finally, since the process of compression of the EO continues, from time to time the macroclusters move relative to each other, which can occur as a jump due to the commensurability of their sizes with the body of the star itself. Hence the “starquakes”. Such shaking of macroclusters leads to a gradual decrease of the radius of the star and an increase in its rotation rate.
If we now compare two models of the internal structure of pulsars - the traditional, monocentric one, based on the theory of classical gravitation, and the scale-like one, taking into account the laws of scale similarity of the Universe (see Fig. 1.36), it turns out that in the second model all the riddles have one cardinal solution - megapolycentricity! Thus, the MS-invariant model with a length of 20 orders of magnitude predicts that Pulsars should have a POLYCENTRIC STRUCTURE, contrary to all traditional theories. What is the mechanism of formation of such MACROCLASTERS?
After all, none of the known forces of nature can lead to their appearance. Let us put forward a preliminary HYPOTHESIS.
In the area of 100-1000 km in size there is an unknown to science Fifth Force - the antipode (or analog) of the strong interaction. It is responsible for the formation of different size separations, and first of all - for the formation of separations with sizes of 160 and 500 km.
This force forms the megacluster structure of small planets, neutron stars, and inner cores of stars. It is this fifth force that creates inhomogeneities inside pulsars, which lead to the above phenomena.
The hypothesis has one essential problem. It unambiguously follows that the star cores should have quantized mass because of the megacluster structure of the order of 100-1000 km. The data in favor of their supposed heterogeneity the author has not found yet. If this heterogeneity really exists, it will be possible to detect it by the following indirect manifestations.
First, the statistics of the mass spectrum of stars as well as of atoms should in this case have a quantized (polymodal character).
Secondly, many processes inside stars should have quantized discrete character normalized by some conditional minimal mass unit, which will be unified for all stars. This conditional unit is an analog of the nucleon in the atomic nucleus. We cannot say anything about its mass, but it should have a size close to 160 km (or another option - 500 km, its origin will be discussed further on).
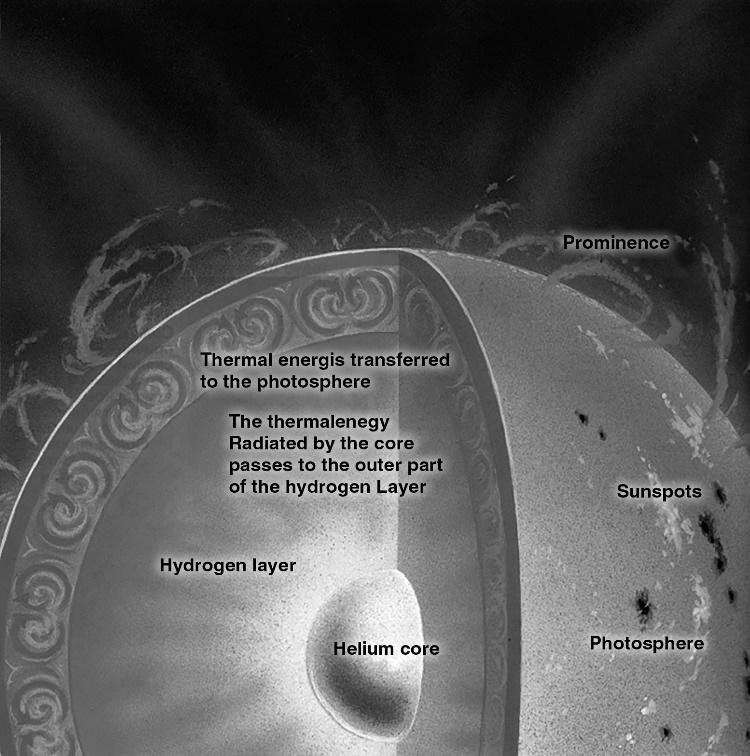 Fig. 1.37. Structure of the Sun, which is a typical star
Thirdly, the Sun cannot be an exception to the rule, so if our assumption about megaclustering of stellar nuclei is correct, there could well be moments in the life of the Sun when quantum, jump-like changes of global scales occurred in it. Obviously, their traces should remain on the surface of planets, which can be checked on the Earth and Moon, analyzing the features of ancient sediments.
Using the similarity of the two intervals Macro- and Mega-, we can remember how the analogy with the planetary system helped to reveal the structure of the atom and its nucleus. Now it is time for the microcosm to pay its debts - to tell us how planets and stars are organized. And if the established structural-scale invariants are really real, then in the future their use can help to solve a huge number of problems of scientific knowledge of the world. After all, the regularities of those parts of the S-axis, which are well known in the megaworld, can be transferred to the macroworld, and vice versa. And it is possible to construct the whole left Micro-interval using regularities of Macro- and Mega-intervals. It is only necessary to remember that in addition to scale similarity there is also scale “goodness,” or individuality, inherent in each interval separately. STARS (CLASS #9). Let us consider the Mega-interval further.
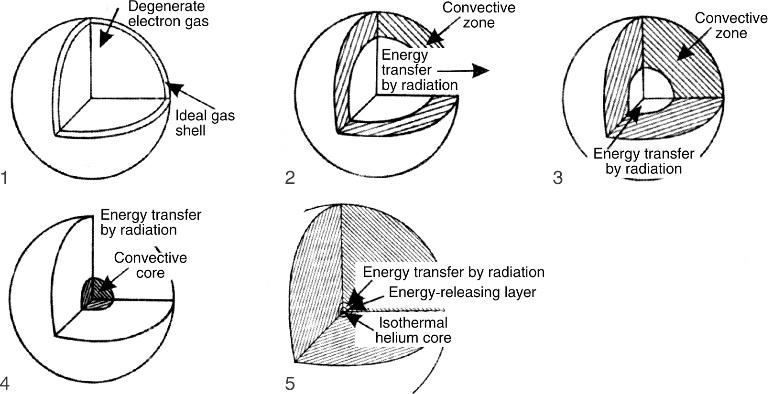 Fig. 1.38. Models of the internal structure of stars (according to I.S. Shklovsky) depending on the sizes
Stars are located to the right of the EO and planets on the S-axis. Stars are typical M-structures with all three features: they are spherical, they have nuclei, and their structure is shell-like (see Fig. 1.37). It is noteworthy that with the transition from small-diameter stars to increasingly large stars, the growth of nuclei15 lags behind.
Thus, while the Sun has a core size of 1/4 of its diameter, the red giant has a core size of only 0.001. Consequently, the larger the diameter of the star, the smaller the ratio r / R, where R is the radius of the star and r is the radius of the core (see Fig. 1.38).
This information is important for the HU model. It implies that there is a certain size threshold for stellar nuclei, over which they do not pass. The analysis of stellar models shows that, most likely, this threshold is equal to \(10^{10}\) cm. In particular, “in the center of a red giant there is a white dwarf” 16.
At the same time, as is known 17, white dwarfs have sizes from \(10^{8}\) to \(10^{10}\) cm. Therefore, as we move along the S-axis from the half-wave of stellar nuclei (CLASS No. 8), we get to the stellar half-wave (CLASS No. 9), “leaving” the nuclei beyond the threshold of the crossing of the SW with the S-axis. While white dwarfs (WDs) are homogeneous spheres with neither core nor shells, the middle star of the main sequence (MS) already has both a core and a spherical shape, while in the model of a red giant (KG) the core remains small — (WD). Let us repeat that the sizes of the nuclei of stars do not exceed \(10^{10}\) cm, i.e., they do not exceed the nuclear class threshold. Since the stars themselves can reach gigantic sizes — up to \(10^{14.5}\) cm, the ratio between them and their nuclei exceeds 1000 and can theoretically reach the proportion of \(10^{5}\). Recall that this is the proportion between atoms and their nuclei!
Stars are the most symmetric systems of the Universe. Their spherical symmetry is an example of an ideal M-type shape. There is no reason to doubt that the internal structure of stars has a shell character. At the same time, according to the modern theory of stellar thermonuclear synthesis, it is the core of stars that is the main source of its thermal energy.
Thus, stars exhibit the full set of characteristics of monocentric systems: a central core that is vital to the entire system, a shell structure, a spherical shape, and a radial-beam corona surrounding the star (see Fig. 1.39).
It remains only to establish whether the nuclei of stars are as tiny in relation to the size of the stars themselves as the nuclei of atoms are in relation to the atoms themselves. This may well be expected, based on the scale similarity between stars and atoms, which are exactly 20 orders of magnitude apart on the S-axis.
If this assumption is confirmed by further investigations of the internal structures of stars, it will be another amazing example of perfect scale similarity. If the proportion \(10^{5}\) is not found for stars, it will mean that the scale similarity is partially broken in nature on this section of the S-axis, which must have its own reasons. So far, only the following CONCLUSION is certain: the average size of stars is exactly \(10^{20}\) times the size of the hydrogen atom.
So, returning to the beginning of the MEGAINTERVAL, we find the same abrupt transition from polycentric to monocentric systems as at the beginning of the MACRO INTERVAL. Fig. 1.39. Different shapes of the solar corona. On the left are the coronal shapes during the solar minimum, on the right — during the solar maximum. Radial-radial symmetry can be seen.
P-structures, which prevail before the beginning of these intervals, are quickly replaced by pronounced MF-structures, which finally transform into M-structures exactly after 5 orders of magnitude from the initial points of the intervals (see Fig. 1.35).
Similarly to the MACRO INTERVAL on the MEGAINTERVAL, we see that the change from P-structures (via transient MS-Dorms) to M-structures occurs in the interval of the first five orders (from \(10^{7}\) to \(10^{12}\) cm), with M-structures completely dominating in the size interval from \(10^{9}\) to \(10^{12}\) cm, i.e., on the rise of the first hump of the MEGAINTERVAL. However, since there are giant stars that reach sizes of \(10^{14.5}\) cm, when assessing the prevalence of fully monocentric structures in the MEGAINTERVAL, it should be noted that, in contrast to the situation in the MACRO INTERVAL, they occupy the entire upper hump of the SW (stellar class CLASS No. 9), i.e., 5 orders of magnitude. We note once again that the left part of this hump with a length of 2.5 orders is “populated” exclusively by M-structures. There is no information about the existence in nature of P-structures with sizes from \(10^{9.5}\) to \(10^{12}\) cm!
New types of structures appear on the S-axis beyond the top of the stellar ridge. Pair stars and systems of stars (Classes No. 9, 10) are a kind of stellar “molecules.” Is it not surprising that their appearance on the S-axis is exactly 20 orders of magnitude away from the similar appearance of molecules made of atoms on the MACRO- INTERVAL? Let us consider in more detail the location of stellar systems on the S-axis.
The path to the right along the S-axis from the \(10^{12}\) cm crest leads us first to paired stars, then to multiple systems, to groups, and ends in the region of globular and scattered clusters (up to \(10^{20}\) cm in size)18. All these stellar systems are polycentric. The globular clusters, whose diameters occupy the range \(10^{19}\)-\(10^{20}\) cm, are somewhat of an exception (this is an echo of monocentrism, as is the case everywhere at the points where the SW intersects the S-axis). The distances between all paired stars lie in the range19 of \(10^{11.5}\) to \(10^{17.5}\) cm. Consequently, all the paired stars inhabit exclusively the right slope of the first ridge of the MEGAINTERVAL.
All STAR COLLECTIONS - scattered and globular - are located in a rather narrow size range20 - from \(6 \times 10^{18}\) cm to \(10^{20}\) cm.
Consequently, astronomy is not yet aware of polycentric structures with sizes ranging from \(10^{17.5}\) to \(10^{18.8}\) cm. This empirically established fact is also interesting because the absence of polycentric systems on the S-axis coincides with the lower part - the “trough” - of the nuclear-galactic wave (CLASS #10) located between the two humps of the MEGAINTERVAL on the SW model (see Fig. 1.34). However, it is in this size range that many systems with strong signs of monocentricity are located, e.g.: QUASARS, GALACTIC NUCLEI, AND PLANETARY NEBULAE. GAS GALACTIC NEBULAE (CLASS #10). The most symmetric of these are known to be planetary nebulae, which most often resemble torus21 in shape (see Fig. 1.40A). In the closest of them, fibers are found running from the center to the periphery, like spokes in a wheel. Since these details are at the resolution limit of the telescope, astronomers assume22 they are present in all planetary nebulae, although they are not seen in distant ones. Most planetary nebulae are \(10^{17}\)-\(10^{18}\) cm in size and have a very symmetrical shape, despite having very low densities of about \(10^{-20}\) g/cm\(^3\).
Absolutely unsymmetrical and almost chaotic are diffuse nebulae like the Crab Nebula (see Fig. 1.40B), which are the remnants of supernovae explosions. Their typical sizes are \(10^{19}\)-\(10^{20}\) cm.
Comparing these two types of nebulae, which consist of the same type of rarefied gas, we can note the following. Those nebulae that have dimensions corresponding to the lowest point of the HW half-wave (this point according to our model has increased stability) have increased central symmetry (torus shape and radial symmetry of spokes).
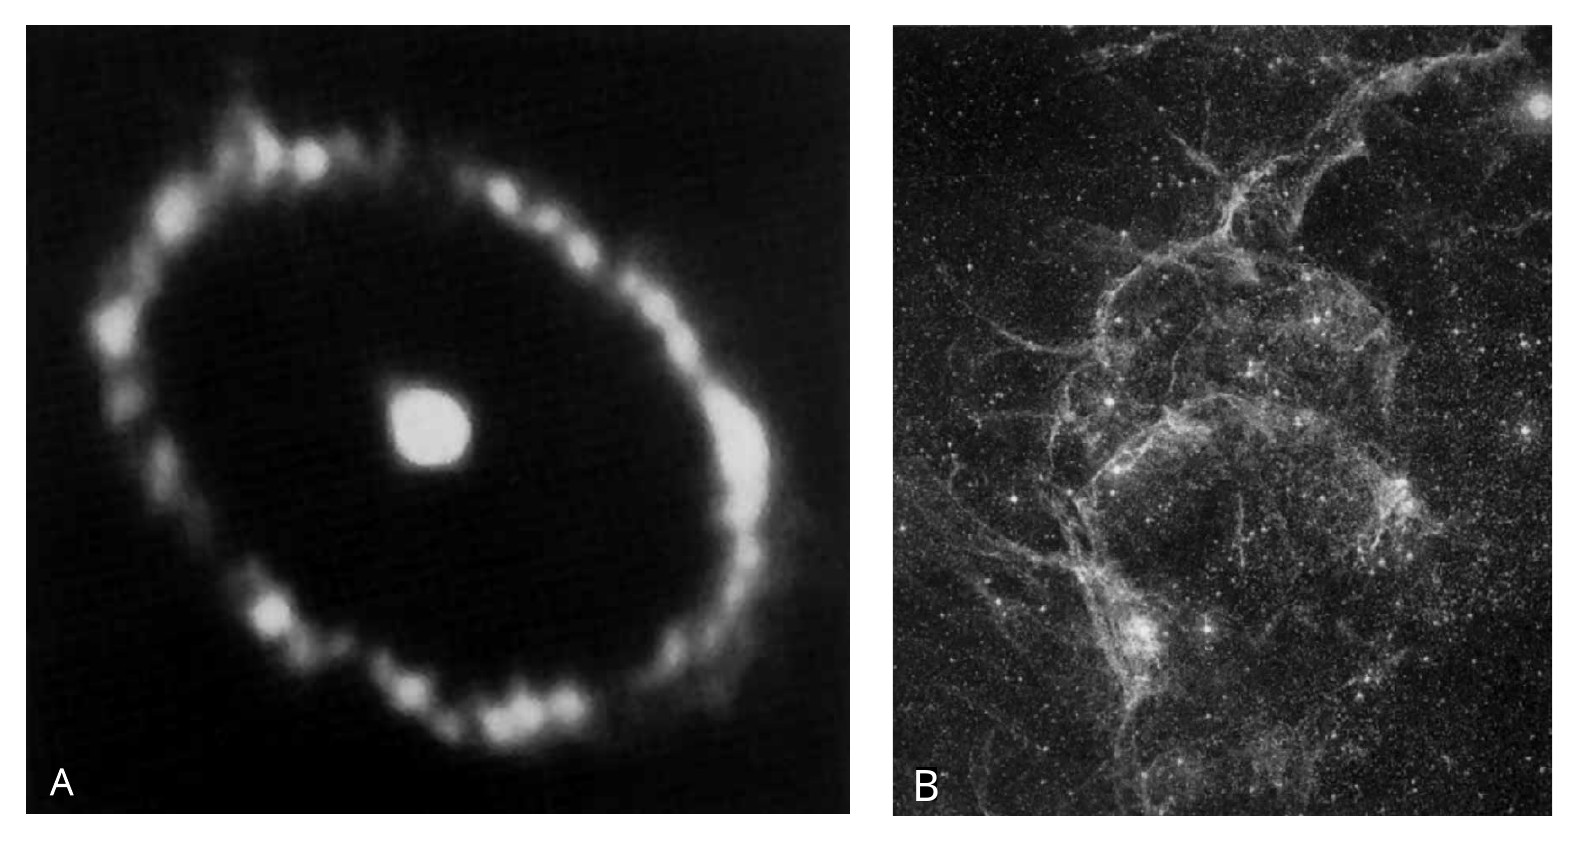 Fig. 1.40. А. A planetary nebula whose dimensions are close to \(10^{17}\)-\(10^{18}\) cm. The ring symmetry is clearly visible. The radial symmetry of the “spokes” is not visible, although detectable. B. Crab Nebula, whose dimensions are close to \(10^{20}\) cm. Chaotic fibrous structure lacks any sign of symmetry
And the nebulae, whose sizes correspond to the unstable zone on the SW model, have an asymmetric shape. At first glance, the reason for the difference in symmetry is in the nature of the process of nebula formation, because torus planetary nebulae are formed by slow and quiet detachment of the shells of red giants (KG), and nebulae such as the Crab Nebula - as a result of a grandiose explosion of supernovae (SN), which leads to a rapid process of mixing of matter and loss of any symmetry. This explanation could be accepted if it were not for some recent observations. They have shown that the remnants of supernova explosions undergo a stage of higher shape symmetry at sizes close to \(10^{17}\)-\(10^{18}\) cm. In addition, within the chaotic fibers we can often observe23 quite symmetric structural details - bright rings with sizes around \(10^{16.7}\) cm. Consequently, the explosive dynamics of the process does not affect the possibility of the formation of symmetric shapes, and the main thing in this case is not the difference in the dynamics of the process, but the scale level: if it corresponds to the zone of increased stability and symmetry (i.e., the lower fossa of the half-wave of the HW), then even inside chaotic nebulae symmetric structural parts are formed.
NUCLEI OF GALAXIES (CLASS NO. 10). First, we present data on their sizes and some features. According to E. J. Vilkovisky24, galactic nuclei consist of an inner structure (the nucleus proper), whose dimensions lie in the range \(10^{17}\)-\(10^{18}\) cm, and an outer shell (\(3 \times 10^{18}\)-\(10^{20}\) cm). According to B. Balik and R. Brown25, the nucleus of our Galaxy is a very compact radio source with dimensions of the order of \(10^{16}\) cm.
“Spiral galaxies, both those observed in plan view and those facing us with their edges, usually have a well-defined nucleus. This is the brightest region of a spiral galaxy. The nucleus is also observed in SO lenticular galaxies. In elliptical galaxies, signs of it can be found only in the most compressed galaxies E6-E7. The nucleus is the densest region of the galaxy. It’s natural. And in other stellar systems - globular clusters, scattered clusters - the central regions have the highest stellar density. However, studies in recent years have shown that the nuclei of galaxies… have a number of important features. Thus, it turned out that in the very center of the nucleus one can usually find another strong compaction - a nucleus… It rotates like a solid body.”26
The core is about 10 parsecs in size, or \(3 \times 10^{19}\) cm, has a rotation period of about 500,000 years, and is 20,000 times denser than the neighborhood of the Sun.
“According to V. A. Ambartsumian, nuclei are the main active region in galaxies and the place of concentration of superdense matter. Galactic explosions of energy-saturated superdense matter eject its parts from the nucleus together with the accompanying stars and gas along the spiral lines, where, as a result of continuous crushing of superdense matter parts, the process of star formation and diffuse matter extraction continues.”27
According to some estimates28, the compact nucleus at the center of our Galaxy is no larger than \(10^{18}\) cm.
The nuclei of galaxies often undergo violent and inhomogeneous processes29. This indicates some macro heterogeneity inside the nuclei, so it is difficult to bring their structure to a simple gravitational sphere. “Active galactic nuclei - which include quasars - have become a new class of astronomical objects. They are the most powerful and the most turbulent objects in the Universe.”30
Faintly luminous nebulae have recently been discovered around some QUASARs. For their ephemeral appearance, British and American astronomers gave them the beautiful name “fuzz” - fluff. True, their size turned out to be the same as the size of galaxies. Thus, some quasars are located in the center of giant nebulae (harbingers of the appearance of galaxies there?), “like a dense, tiny poplar seed in its downy shell.”31
According to B. A. Vorontsov-Vel’yaminov32, the sizes of quasars are \(10^{15}\)- \(10^{17}\) cm, and according to Vilkovisky33, they are \(10^{14}\)- \(10^{17}\) cm. According to other data34, the sizes of quasars can reach larger values: quasar 3C345 has a cross section of 6 \(\times\) \(10^{18}\) cm, and typical sizes of quasars lie in the range of 3 \(\times\) \(10^{18}\)-6 \(\times\) \(10^{19}\) cm. Such a discrepancy in the estimation of the average sizes of quasars is probably due, first of all, to the fact that they represent an inhomogeneous multilayer formation with a sparse shell, nuclear region and core, and therefore each of the experts chooses one or another formation as a boundary. Thus, in the center of the MEGAINTERVAL, in the lowest point of the potential stability trough, - between the two humps of SW, we find (see Fig. 1.35) MP-structures with a central significant core (and possibly even with a spherical shape). At the same time, all these MF-structures occupy on the S-axis exactly the range that is free of pure polycentric systems. Even if in the future it will be possible to detect polycentric clusters of stars with sizes from \(10^{17.5}\) to \(10^{18.8}\) cm, these will be very rare structures, since they have not been detected in many past observations.
Vorontsov-Vel’yaminov in 1969 expressed35 a hypothesis according to which KVASARs, which are splitting into parts (like a dividing cell), consist of components, each of which has its own speed of removal from the observer from the Earth. This explains a number of anomalies in their spectrum, which are quite impossible to explain from the standpoint of the uniform spherical model.
By the way, astrophysicists believe that fragments of a divisioning quasar subsequently turn into galactic groups. Does this not remind us of the process that goes exactly 20 orders of magnitude to the left on the S-axis, namely, the process of cell division, which can result in a colony of cells or develop a multicellular organism.
Since quasars are located on the same place of the Mega-interval as the cell on the Macro-interval (see Fig. 1.34 and Fig. 1.26), their division into parts from the point of view of scale similarity is quite probable. In this case, they can be in a mononuclear stable position of growth and substance accumulation or in a polynuclear (in the simplest case - binary) phase of active division with an obviously heterogeneous structure. Evidence in this favor is the fact that 60% of all radio sources (nuclear regions of galaxies) are double.
The double structure is also observed in some quasars36.
Unfortunately, direct observation of galaxy nuclei is impossible, because they are usually covered by a shell hundreds of times larger than their size. The sources of information are some indirect observations: gas velocity, rotation periodicity, radiation uniformity, etc. This allows us to build models of galaxy nuclei, which probably have some signs of monocentricity: spherical shape, nucleus, but they are unlikely to have shells, and they probably do not resemble giant stars in their internal structure. It is tempting to give their structure a semblance of similarity to a living cell, but this PROPOSAL requires very careful testing. According to astrophysics37, the main source of energy for the active nuclei of galaxies is black holes (BHs). If this is true, then the sizes of galactic PDs are calculated using the formula:
\[R_g = \frac{2GM}{c^2} = 3 \times 10^5 \cdot \frac{M}{M_\odot} \text{ cm}. \tag{1.8}\]
The average masses of galaxies, depending on their type, range from \(10^9\) to \(10^{11.5}\) solar masses38.
…Determinations of galaxy masses often refer only to their nuclear regions“ (B. A. Vorontsov-Vel’yaminov, op. cit. p. 163). Therefore, to get a theoretical possibility to compare the size ranges of the existence of galactic BHs, let us make the following PROPOSAL. Let us assume that the mass of a BH is commensurate with the mass of the entire galaxy.
According to more precise estimates, the range is wider: from \(10^6\) to \(10^{13}\) solar masses. Consequently, the possible PD sizes for galaxies calculated by formula (1.8) lie in the range from \(10^{11}\) cm to \(10^{18}\) cm. However, given that small galaxies have practically no nuclei, much less active ones, the range of PDs for galaxies should be reduced by a minimum threshold, and most likely it starts at \(10^{16}\) cm. Therefore, with a certain degree of probability we can BELIEVE that the active nuclei of galaxies in the form of black holes have sizes from \(10^{16}\) to \(10^{18}\) cm. These are the regions of space from which energy is expelled. And note that it is this range of sizes that corresponds to the lower zone of the nuclear galactic half-wave in the SW. Recall that it is in such lower zones of the HW that the main energetic processes take place (atomic nuclei are 30 orders of magnitude to the left, stellar nuclei are 10 orders of magnitude to the left). This once again testifies to the naturalness of the classification properties of our model SW (see Fig. 1.7).
GALAXIES (CLASS NO. 11). Next to globular clusters on the S-axis are dwarf galaxies, followed by ordinary galaxies.
Most galaxies are typical polycentric structures consisting of many stars, just as atoms and molecules make up bodies in the Macro-interval. Only some types of galaxies have a well-defined and active nucleus. These are mostly spiral galaxies (see Fig. 1.41), which occupy the top of the second ridge of the Mega Interval.
By the way, all kinds of galaxies cannot transform into each other because they have different masses and different angular momentum of rotation39. Both, according to modern physics, are neither lost nor gained. That is, large galaxies have never been small, and vice versa.
If this is indeed true, then small galaxies (\(10^{20}\)-\(10^{22}\) cm), which are mostly elliptical, have an internal structure that is mostly polycentric (no shells or nuclei). The outer shape tends to be spherical (ellipsoid).
Pebbles on the shore are analogous to small elliptical galaxies (EGs). The ratio of the size of a pebble to an atom inside it is almost the same as the ratio of the size of an elliptical galaxy to a star. The shape of pebbles and EGs is ellipsoidal. There are usually no nuclei. The size of the pebbles is such (~10 cm) that they occupy the left slope of the SW ridge, the top of which has a coordinate of \(10^2\) cm. The dimensions of the EGs are such that they occupy the left slope of the SW ridge with its apex at \(10^{22}\) cm. The distance between them is 20 orders of magnitude along the S-axis.
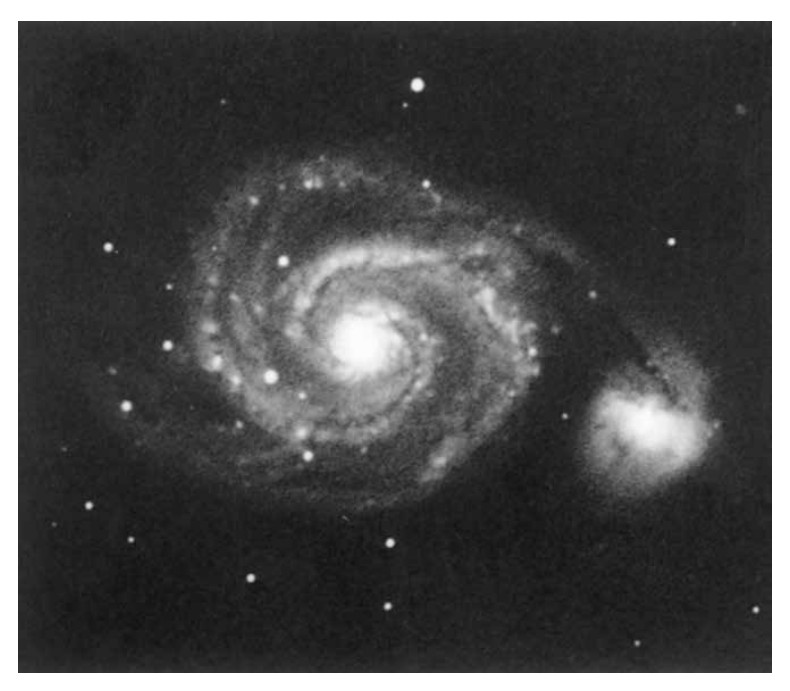 Fig. 1.41. Spiral galaxy with a pronounced nuclear region and a satellite
Large galaxies (\(10^{22}\)-\(10^{23}\) cm), which are mostly spiral galaxies, have a shape far from a sphere, but almost always have a nucleus.
Thus, we see that MP structures are mostly common in the world of galaxies.
The most numerous are elliptical galaxies and dwarf galaxies (of the Sculptor type)40. Astronomers came to this conclusion after calculating the ratio of the number of elliptical and spiral galaxies. Yu. I. Efremov, having processed the data of galaxy catalogs, came to the conclusion that “elliptical galaxies are about 100 times more numerous than spiral galaxies.”41
Since most elliptical galaxies are dwarfs and spiral galaxies are giants, the following becomes clear.
The bulk of galaxies, which have small sizes (up to \(10^{21-22}\) cm), are closer to the polycentricity pole; large galaxies, which are mostly spiral, have a MP structure with an obligatory nucleus.
According to T. A. Aghekyan42, in addition to spiral galaxies, SO lenticular galaxies and some of the most compressed elliptical galaxies, such as E6-E7, have nuclei.
Giant spiral galaxies on the S-axis are followed by nests of galaxies, pair galaxies, and other systems composed of galaxies. This TRANSITION FROM WHOLE OBJECTS TO THEIR SYSTEMS begins exactly 10 orders of magnitude after the analogous transition from stars to their pairs and clusters, 20 orders of magnitude after the transition of biosystems from organisms to their groups, and exactly 40 orders of magnitude after the transition from atoms to molecules (see Fig. 1.7). Virtually all galaxy clusters, their superclusters, and giant cells from them are all polycentric systems. They have no distinguished core, shells, or spherical shape.
The METAGALACTIC STRUCTURE is also POLYCENTRIC (see Fig. 1.42) up to the size of \(10^{27}\) cm. In any case, astronomers have not been able to find a nucleus in the Metagalaxy.
So, in the world of galaxies (CLASS #11), polycentrism mainly dominates, since it is very rare to find galaxies with at least two clear signs of monocentrism (nucleus and spherical shape). The author failed to find at least one example of an M-structure in the galactic world, so we can confidently assert that monocentrism in its pure form, which is characteristic of the left ridge of the MEGAINTERVAL, is absent on its right ridge.
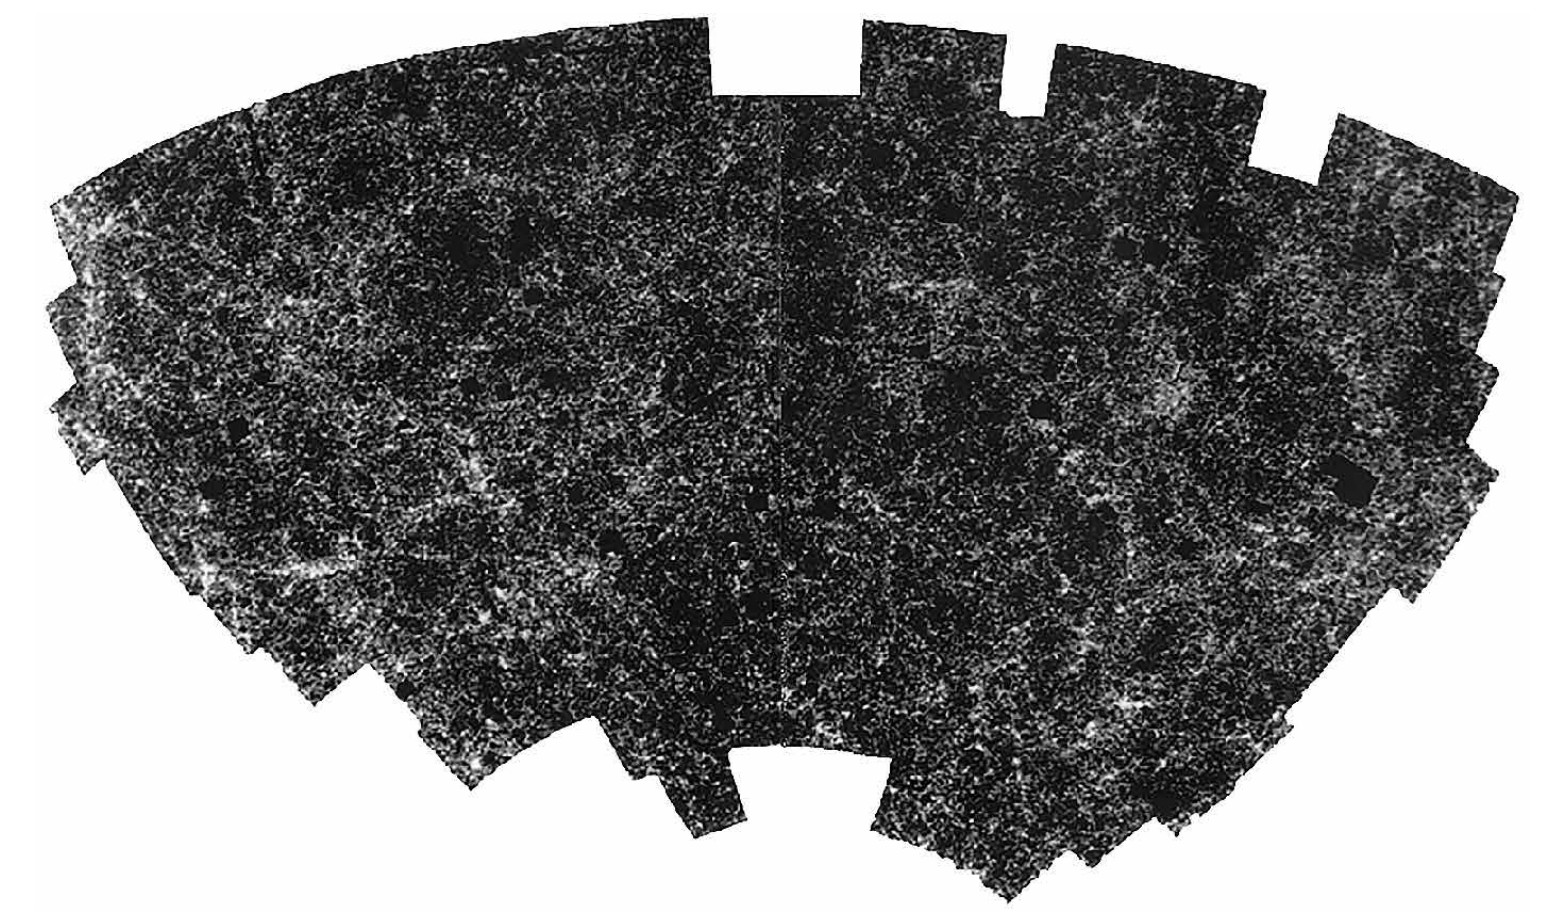 Fig. 1.42. Structure of the Metagalaxy. This map shows the distribution of two million galaxies (ten billion galaxies in all) for a section of the sky. The galaxies are clustered in super clusters that form layers and ribbons separated by large voids; this resembles foam in structure
Let us summarize the analysis of the MEGAINTERVAL by considering the scheme (see Fig. 1.35).
The first order of the Megainterval (small planets, asteroids) is occupied by transitional forms; here, as we move to the right, polycentrism gradually gives way to monocentrism. This is manifested first of all in the appearance of spherical form.
It can be PROPOSED that polycentrism, caused by the corresponding distribution of atoms in the crystalline structure of large bodies, is replaced by megacluster polycentrism at this section of the S-axis (mascons, separations of crustal blocks, and the inhomogeneous structure of pulsars). If this is true, then megacluster polycentrism manifests itself in bodies whose sizes correspond to the first and second orders of the Megainterval.
Already from the middle of the first order, the chaotic form is replaced by a monocentric - spherical form (example - Mimas). If we focus only on the form, then from the middle of the first order up to the fifth order monocentrism dominates the S-axis indiscriminately.
The core-shell features of monocentrism apparently begin to appear from the middle of the second order (e.g., the nucleus of the Moon or Mercury). It is from this point of the S-axis and up to the sixth order (the top of the first ridge) that monocentrism dominates in all three of its manifestations.
After the first crest, monocentric structures occur for another two to two and a half orders, albeit very rarely: we are talking about the largest stars, which both in mass and number occupy a very inconspicuous fraction of the total stellar class. However, from the crest of the first wave, i.e., starting from the sixth order of the MEGAINTERVAL, polycentrism appears, which then dominates all the remaining 15 orders.
The only place on the MEGAINTERVAL where we see an obvious return of monocentrism is in its middle, the POTENTIAL trough OF stability, which occupies the eleventh order, plus or minus another order (planetary nebulae, galactic nuclei, quasars).
The entire rise of the second ridge is populated mainly by polycentric structures in which the elements of the systems are stars (star clusters, dwarf galaxies). On the left slope of the second ridge, one can detect some return of monocentrism. From its top, polycentric structures of the second kind, consisting of galaxies rather than stars, begin to appear. The descent from the second SW ridge for galaxies is polycentric completely up to the end of the Megainterval (galaxy clusters of all kinds).
On the twentieth order, we see the same undivided dominance of polycentrism as on the twentieth order of MICRO-INTERVAL and MACRO-INTERVAL (the fibrous, chaotic structure of the Metagalaxy).
Star globular clusters and spherical galaxy clusters deviate from the described sequence. Both of them are located in the zone of intersection of the S-axis with the SWS.
-
Zharkov V. N. Internal Structure of the Earth and Planets. Moscow: Nauka, 1978. P. 181. ↩
-
Xanfomaliti L. V. Planets Rediscovered. Moscow: Nauka, 1978. P. 20. ↩
-
Struve O., Linds B., Pillans E. Elementary Astronomy. Moscow: Nauka, 1967. P. 52. ↩
-
Allen K. W. Astrophysical Magnitudes. M.: Mir, 1977. P. 215. ↩
-
Zharkov V. N. Internal Structure of the Earth and Planets. M.: Nauka, 1978. P. 183. ↩
-
Xanfomaliti L. V. Planets Rediscovered. Moscow: Nauka, 1978. P. 16. ↩
-
Alven H., Arrhenius G. Evolution of the Solar System. M.: Mir, 1979. ↩
-
Alven H., Arrhenius G. Evolution of the Solar System. M.: Mir, 1979. P. 368. ↩
-
Shklovsky I. S. Stars. Their birth, life and death. Moscow: Nauka, 1977. P. 327. ↩
-
Shklovsky I. S. Stars. Their birth, life and death. Moscow: Nauka, 1977. P. 298. ↩
-
Shklovsky I. S. Stars. Their birth, life and death. Moscow: Nauka, 1977. P. 325-326. ↩
-
Vorontsov-Vel’yaminov B.A. Essays on the Universe. Moscow: Nauka, 1969. P. 566-567. ↩
-
Allen K. W. Astrophysical Magnitudes. M.: Mir, 1977. P. 369. ↩
-
Vilkovisky E. Y. Quasars. M.: Nauka, 1985. P. 122. ↩
-
Vilkovisky E. Y. Quasars. M.: Nauka, 1985. P. 146-147. ↩
-
Aghekyan T. A. Stars, Galaxies, Metagalaxy. M.: Nauka, 1981. P. 179. ↩
-
Aghekyan T. A. Stars, Galaxies, Metagalaxy. M.: Nauka, 1981. P. 186. ↩
-
Lindgenfelter R. E., Ramati R. On the nature of radiation due to annihilation of electrons and positrons from the region of the galactic center // Galactic Center. M.: Mir, 1984. P. 177. ↩
-
Aghekyan T. A. Stars, Galaxies, Metagalaxy. M.: Nauka, 1981. P. 181. ↩
-
Suchkov A. A. Galaxies familiar and mysterious. Moscow: Nauka, 1988. P. 120. ↩
-
Suchkov A. A. Galaxies familiar and mysterious. Moscow: Nauka, 1988. P. 135. ↩
-
Vorontsov-Vel’yaminov B. A. Extragalactic Astronomy. M.: Nauka, 1978. P. 428. ↩
-
Vilkovisky E. Y. Quasars. M.: Nauka, 1985. P. 64, 98. ↩
-
Martynov D. Ya. Course of General Astrophysics. M.: Nauka, 1979. P. 452. ↩
-
Vorontsov-Vel’yaminov B. A. Extragalactic Astronomy. M.: Nauka, 1978. P. 462. ↩
-
Vorontsov-Vel’yaminov B. A. Extragalactic Astronomy. M.: Nauka, 1978. P. 417. ↩
-
Suchkov A. A. Galaxies familiar and mysterious. Moscow: Nauka, 1988. P. 151. ↩
-
Vorontsov-Vel’yaminov B. A. Extragalactic Astronomy. M.: Nauka, 1978. P. 113. ↩
-
Shklovsky I. S. Stars. Their birth, life and death. Moscow: Nauka, 1977. P. 213-214. ↩
-
Allen K. W. Astrophysical quantities. Zh-M.: Mir, 1977. P. 295. ↩
-
Mukhin K. N. Physics of atomic nucleus // Experimental nuclear physics. Т. 1. M.: Atomizdat, 1974. P. 50. ↩
-
Chechev V. R., Kramarovsky Ya. M. Radioactivity and the Evolution of the Universe. Moscow: Nauka, 1978. ↩
-
Chechev V. R., Kramarovsky Ya. M. Radioactivity and the Evolution of the Universe. Moscow: Nauka, 1978. P. 40. ↩
-
Chechev V. R., Kramarovsky Ya. M. Radioactivity and the Evolution of the Universe. Moscow: Nauka, 1978. P. 44. ↩
-
Islam J. N. Sky and Telesc. 1979, 57, I, P. 13-18. ↩
-
Animal life. Т. 1. M.: Prosveshchenie, 1968. P. 71. ↩
-
Animal life. Т. 1. M.: Prosveshchenie, 1968. P. 139. ↩
-
Green N., Stout W., Taylor D. Biology. T. 1. M.: Mir, 1996. P. 22. ↩
-
The life of animals. T. 1. M.: Enlightenment, 1968. P. 159. ↩
-
The life of animals. T. 1. M.: Enlightenment, 1968. P. 120-125. ↩
-
The life of animals. T. 1. M.: Enlightenment, 1968. P. 98. ↩
-
Afanasyev Yu. I., Korolev V. V., Kotovsky E. F. Cell nucleus and some questions of cytogenetics. Moscow: Nauka, 1971. P. 19. ↩
S-structural invariant
Let us now compare two intervals of 20 orders of magnitude: the MACRO INTERVAL - (II) and the MEGAINTERVAL - (I) (cf. Fig. 1.26 and Fig. 1.35).
Immediately striking is their amazing, though not absolute CONNECTION with a COEFFICIENT of \(10^{20}\).
Let’s review it step-by-step:
-
Both intervals are bordered on the left by polycentric structures:
II - internal parton structure of nucleons (< \(10^{-13}\) cm);
I. - Chaotic shape and coreless structure of asteroids (< \(10^7\) cm).
-
The beginning of the first order is marked by the appearance of the first sign of monocentrism - spherical shape:
II. - protons and neutrons;
I - spherical minor planets (like Mimas) and NS.
-
The first order is dominated by monocentrism of the form:
II - nuclei of atoms;
I - minor planets.
-
At the first order, the structure moves from micropolycentricity to macropolycentricity (the constituent elements become of the same order as the system):
II - nucleons in the nuclei of atoms;
I. - mascons inside planets like the Moon, hypothetical nuclei in the cores of stars.
-
On the first order of the two intervals are remarkably similar (in terms of element composition and packing) systems:
II. - atomic nuclei are made up of nucleons;
I. - neutron stars are made up of nucleons.
-
From the first to the fifth order, the dominance of monocentric structures increases, purely polycentric systems are practically absent, the first wave rises of both intervals are “populated”:
II. - with atoms;
I. - planets, stars.
The exception is first orders, which combine external monocentrism with internal polycentrism:
II. - the nucleonic structure of nuclei;
I. - The mascon structure of the minor planets.
-
From the fourth to the fifth order, both intervals are populated exclusively by monocentric structures with three distinct features:
II. - mesoatoms, positive ions, i.e. atoms with electron shells “stripped” to different degrees;
I - Earth- and Jupiter-type planets, single main-sequence stars.
-
At the fifth order of intervals, fully monocentric structures are finally formed, possessing three functionally important features: a nucleus, spherical shape, and shell structure (with points of average size surprisingly equally spaced on the S-axis, but with a step of 20 orders of magnitude)
II - average sizes of atoms;
I - average sizes of stars.
-
From the sixth order, the elements begin to form systems of the first kind:
II - molecules and crystals;
I. - paired stars and star clusters.
-
From the crest of the first waves and practically to the end of both intervals, polycentric structures dominate for 15 orders of magnitude: II. - molecular environments, crystalline (amorphous) structures; I. - stellar systems of all kinds, to super clusters of galaxies made up of stars.
-
At the eleventh order of intervals, exactly between the two waves, the monocentricity of the structures is revived in the S - Trough of Potential stability (STPS) in an incomplete way: II. - balls of cosmic (volcanic) dust, cells; I - galactic nuclei, quasars, planetary nebulae.
-
On the eleventh order, monocentrism is partially manifested: spherical shape, nucleus and shells may occur separately.
-
Monocentrism rarely, at the level of statistical background, occurs up to order 15 as a spherical shape or a shape with radial symmetry: II - bird and animal eggs, seeds and flowers of plants on the Macro interval; I - globular star clusters and elliptical galaxies on the Megainterval.
-
At the fifteenth order of intervals some system convolution is formed, which leads to the formation of polycentric systems of the second kind with a new level of elemental base: II - on the Macro-interval at the transition from the 15th to the 16th order is the median of the size distribution of vertebrates, which later begin to create their own systems: families, flocks, herds, social systems; I. - The 15th-16th order of the Mega Interval - here passes the median of the size distribution of galaxies, which further “begin to create” pairs and nests, clusters and superclusters.
-
Both intervals end in exclusively polycentric structures: II. - asteroids, biocenoses and societies; I - super clusters of galaxies forming the filaments of the cellular structure of the Metagalaxy.
Thus, we see that the similarity of the two intervals is manifested practically along their entire length. All this allows us to identify a certain STRUCTURAL INVARIANT, 20 orders of magnitude long, which as if twice unfolds on the S-axis, “starting” from the sizes \(10^{-13}\) cm and \(10^7\) cm, i.e. exactly after 20 orders of magnitude (see Fig. 1.43).
Of course, since the Macro and Mega Intervals are located in different places of the scale ladder of the Universe, one can find a structural difference between them besides structural similarity.
Let us consider this STRUCTURAL DIFFERENCE step by step.
- The presence of “meganucleons” in the structure of stellar nuclei has not yet been revealed by astrophysics. If it is absent, it leads to a strong structural difference between atomic nuclei and stellar nuclei.
- There are no nuclei of atoms whose sizes are beyond the first order of the Macro interval.
At the same time, for the Mega-interval, the astrophysical theory gives values of the sizes of stellar nuclei up to at least the third order inclusive. It is possible that either the astrophysical model of stellar nuclei is not correct here, or there are rare atomic nuclei with sizes 1000 times larger than nucleons, which have not yet been discovered on the Macro-interval.
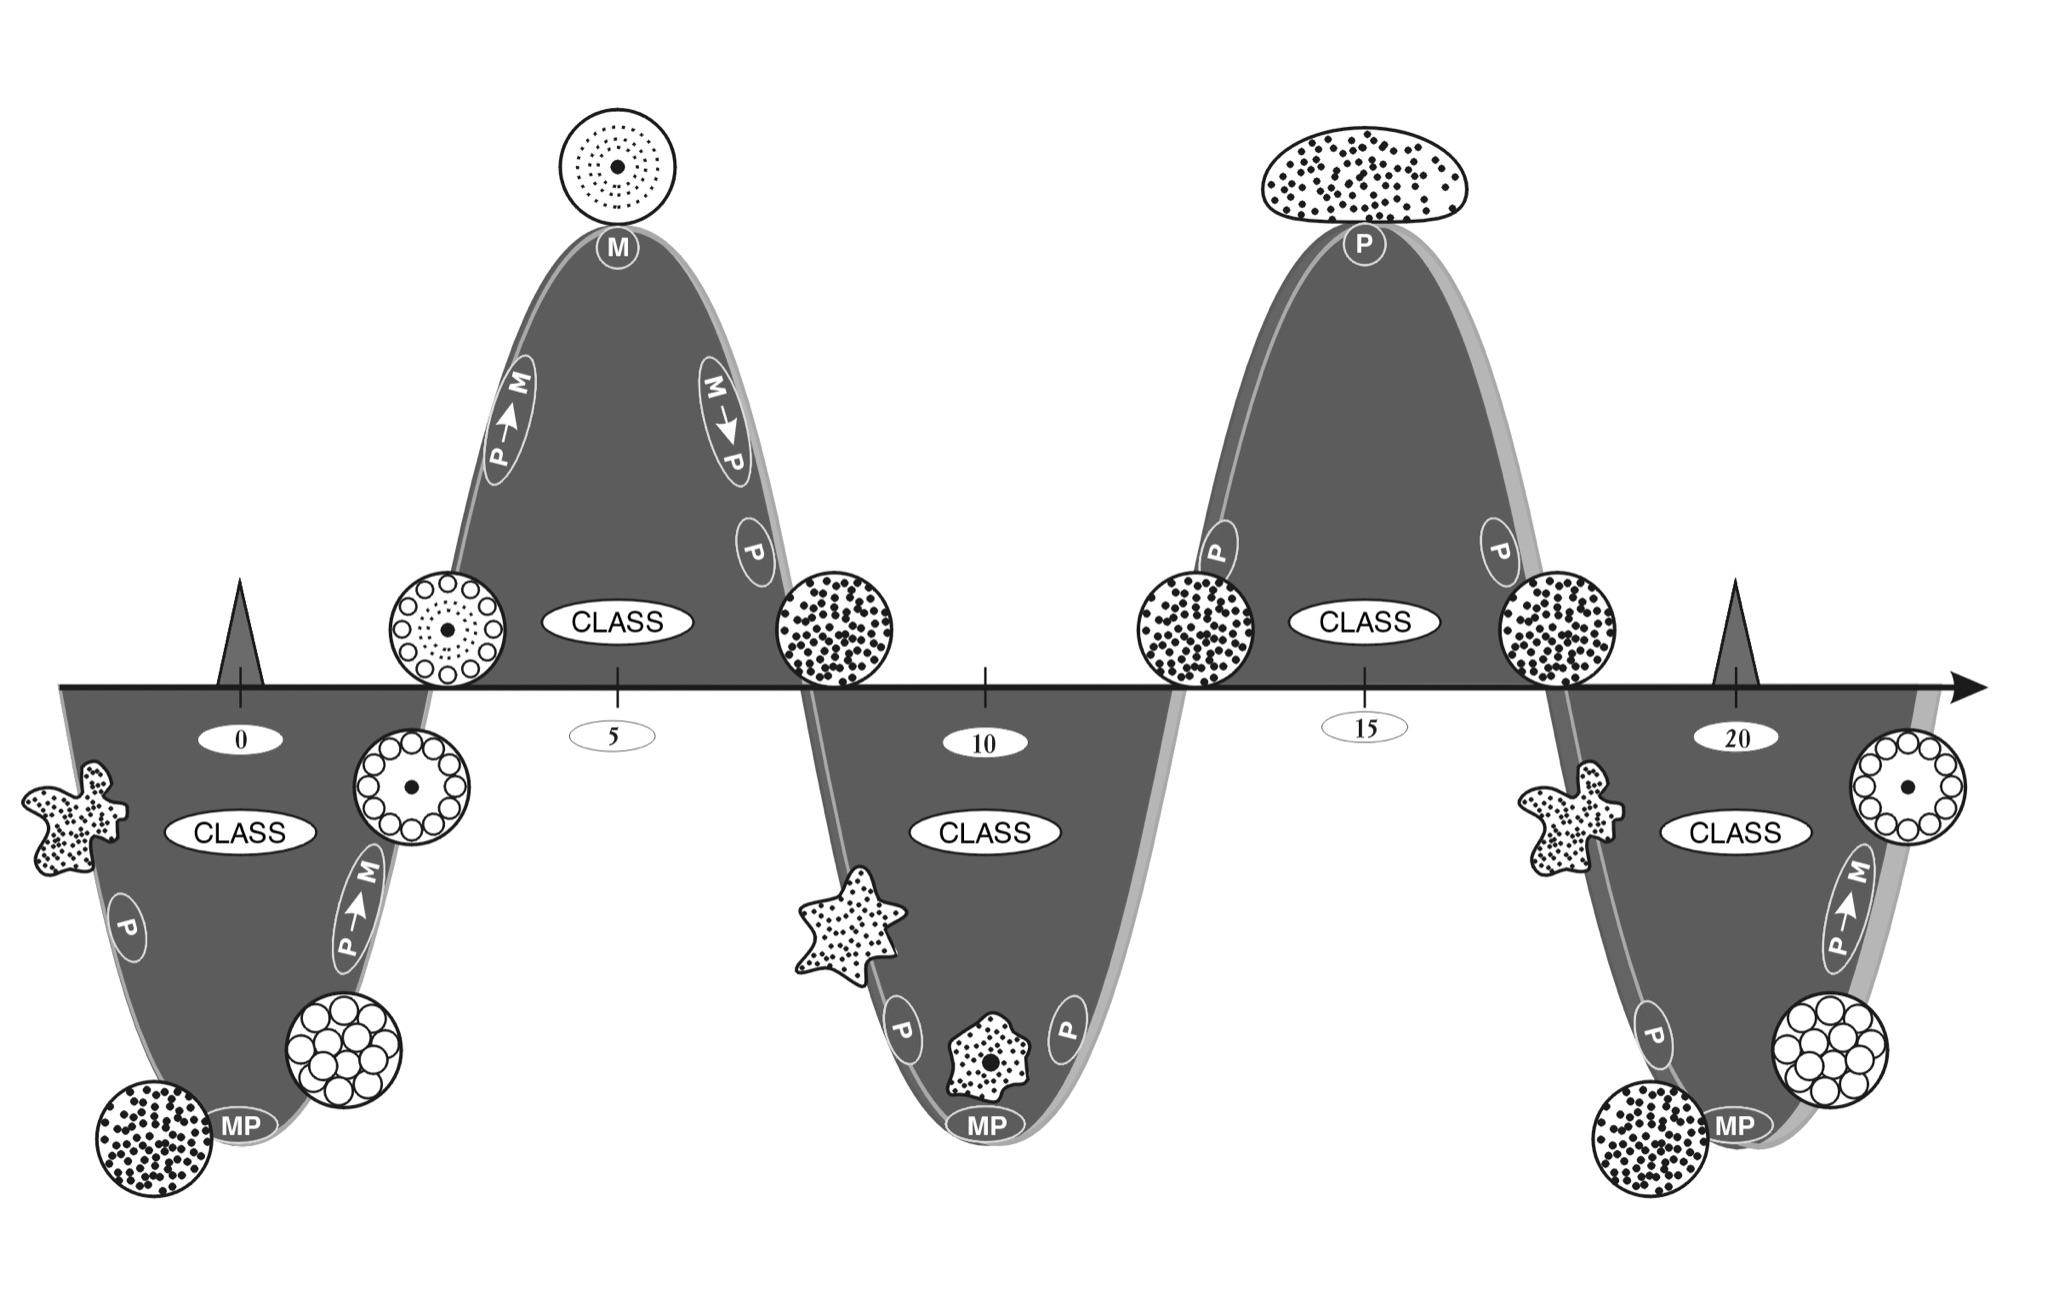 Fig. 1.43. S-Structural invariant
- Stars are known whose sizes are two orders of magnitude larger than the average stellar size; these giants occupy the seventh and eighth orders of the Mega Interval, forming the fully monostructured upper part of the first wave.
At the same time, the author has not encountered in the literature any mention of atoms with sizes exceeding ten angstroms, hence, the seventh and eighth orders of the Macro-interval are not “populated” with atoms. This difference, however, may not be so significant, if we take into account that such giants of the Mega-interval, which would have diameters greater than \(10^{13}\) cm, are very few among the stars, and they are not mentioned in the literature. Astronomers know them only because of their high brightness.
Besides, examples of centrosymmetric clusters of atoms are known on the macro-interval. The sizes of these clusters fall just on the seventh order, and at the same time they sufficiently realize the monocentricity of the structure.
-
Most stars have sizes of the fourth and fifth orders of magnitude of their interval - these are dwarf stars. Dwarf stars outnumber other stars in the Universe. Most atoms (hydrogen), on the other hand, have sizes of the sixth order of magnitude.
-
Polycentric systems of atoms - molecules - are made up of elements that are very close together, at distances commensurate with the size of the atoms themselves. The distances between stars in “stellar molecules” - paired and multiple systems - are often many times larger than the stars themselves. Therefore, “stellar molecules” unlike ordinary molecules are extremely rarefied systems.
-
The second ridge of the Megainterval on its rise is represented by a set of systems with near spherical (elliptical) symmetry - elliptical galaxies.
We do not observe anything similar on the rise of the second crest of the Macro-interval. Perhaps, at the first stages of the Biosphere evolution, these scale sizes could have been massively represented by protozoan colonies, which, as is known, often take a sphere-like shape.
The point is that the evolutionary age of galaxies is much less than the evolutionary age of the Biosphere, if it is measured not by the number of years, but by the number of birth cycles. In this sense, many galaxies are just babies that first appeared in the Universe, whereas biosystems have undergone a very long and complex path of evolution. Therefore, it is more correct to compare the Mega-interval with the primary biosystems of the Macro-interval, i.e. in this case with the first cells and the first colonies of them.
So, it is quite natural that the MACRO INTERVAL has, besides similarities, many differences from the MEGAINTERVAL. It is very likely that these many differences are connected with the fact that our ideas about macro-structures were formed in very specific and unique conditions on the surface of the Earth, and we cannot even imagine how the Macro-interval is organized on other planets, not to mention other galaxies. At the same time, we have an opportunity to judge the structures of the Mega-interval more objectively, because we observe the cosmos from the side and collect average statistical information about it.
MICRO-interval
Experimental information on the structure of elementary particles has been obtained by science only in the size range of the Microinterval from \(10^{-17}\) to \(10^{-13}\) cm.
The proton on the scale of \(10^{-14}\) cm is represented by theorists as polycentric, and on the scale of \(10^{-15}\) cm even more polycentric1 (see Fig. 1.25). This shows that the deeper one goes into the microcosm, the more complex and polycentric picture is revealed to physics.
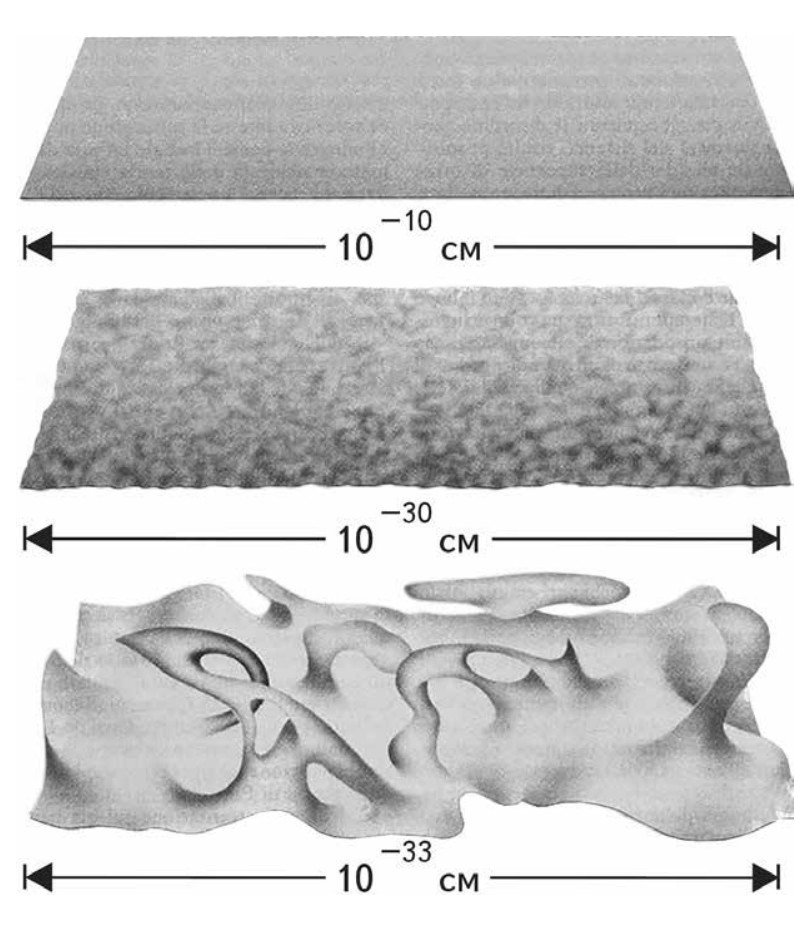 Fig. 1.44. The quantum vacuum, as presented in 1957 by J. Wheeler, becomes more and more chaotic on closer inspection. At the scale of atomic nuclei (above), space looks very smooth. At distances on the order of \(10^{-30}\) cm, some irregularities begin to appear. At distances about 1000 times smaller, the curvature and topology of space fluctuate dramatically
Experimental physics has failed to penetrate deeper than \(10^{-17}\) cm into the microworld, so theoretical models still dominate in this scale region. One of them - of the famous physicist J. Wheeler assumes2 that on scales of the order of \(10^{-30}\) cm some irregularities begin to appear in the vacuum structure (see Fig. 1.44)
Let us put forward the hypothesis that the STRUCTURAL FEATURES OF THE WHOLE MICROINTERVALE FROM \(10^{-33}\) TO \(10^{-13}\) cm ARE SUBJECT TO THE SCALE STRUCTURE INVARIANT. In this case we will be able to use the accumulated knowledge in the field of macro- and megaworld to predict the structure of the microcosm.
Applying this method, we can draw the following analogies. Penetrating into the depths of elementary particles (on scales smaller than \(10^{-13}\) cm - the top floor of the Microinterval), physicists hope to discover even simpler first bricks of matter (e.g., quarks). However, it may well be that uncovering the increasingly fundamental structure of the microcosm is like uncovering the structure of the Metagalaxy from the outside.
To understand what problems physicists face when penetrating inside, for example, a proton, it is necessary to do the following mental experiment. Let us enlarge ourselves to a size many times larger than the size of the Metagalaxy, and begin to examine it from the outside. Examining it under a “microscope,” we will first see the “ball” of the Metagalaxy. We start shining it through and find the cellular structure of the superscopes (see Fig. 1.42). Further detail shows that they also consist of many clusters. Even deeper are galaxies, which are made up of a huge number of stars. We are surprised to find out that a very simple Metagalaxy from the outside (remember M. A. Markov’s maximon model) turns out to be more and more complicated as it is mentally “disassembled.” This way in depth will not lead us to the identification of two, three or several more fundamental “particles” than the Metagalaxy itself. At the same time, microparticle physics, penetrating at a similar point in SW inside the proton, is waiting for just that. From our point of view - in vain. The proton can be crushed for any length of time into any small parts with the same success as, for example, an asteroid: the output will not be “fundamental parts of the asteroid,” but its random and chaotic fragments. And all experiments at the LHC will sooner or later show the complete futility of attempts to penetrate deep into hadrons. These are powerful resonant structures that can’t be broken into pieces, because their “pieces” are - maximon, which have gathered into a three-dimensional knot of four-dimensional oscillations of the second harmonic.
So, it is possible that the fundamental level of microparticles lies too deep. It is necessary to go at least 15 orders of magnitude deeper, and not 3-4, as it is passed now. The application of the scale-structural invariant shows that the next level of the fundamental simplicity of nature lies at a depth of \(10^{-28}\) cm and \(10^{-33}\) cm.
Figuratively speaking, science still has “too short arms” to get to this level. At the same time, all structures in the depth of the proton are most likely a plurality of random forms of polycentrism, so we can PROVE that there is no simple structure and super dense energy in them, which could be obtained by destroying the proton, just as nuclear energy is obtained by destroying the atomic nucleus.
Why particle’s physics so persistently aimed at these apparently false objectives? The answer is simple. As we have already written above, the inertia works here.
At one time, penetrating into the depths of matter — from the world of molecules to the world of atoms, and then from the world of atoms to the world of their nuclei — physics discovered a world that was arranged more and more simply and fundamentally.
When used correctly, it becomes a powerful tool for cognition. In addition, we can deduce from it an extremely important epistemological consequence: all phenomena in the microcosm and in the mega-world of the world can be explained with the help of examples
At one time, penetrating into the depths of matter - from the world of molecules to the world of atoms, and then from the world of atoms to the world of their nuclei - physics discovered a world that was organized in an increasingly simple and fundamental way. However, nobody could suppose that this increasing simplicity of the atomic world was only a consequence of penetration to the first levels of the Macro-interval (where the electromagnetic forces lay the basis of the average scale invariant of the Universe) and that beyond the threshold of 10-13 cm the “asphalt” of the simplicity of structures ends and the “off-road” of the polycentric interweaving of complex systems begins. In fact, penetration deeper than this threshold leads us not to the lower floors of the world structure, but to the upper floors of the MICROINTERVAL. According to the scale-structural invariant, the upper floors of the Microinterval are dominated by finely dispersed polycentric structures with almost completely degenerated symmetry.
Did physicists have experimental facts indicating a transition beyond the \(10^{-13}\) cm threshold to a world more complex than the world of nucleons? Yes, the ensemble resonance structure of microparticles could not but manifest itself at least indirectly. In particular, through the probabilistic behavior inherent in ensemble (not rigidly deterministic) systems. But, unfortunately, these signals were misinterpreted.
“Statistical laws in physics have been known for a long time. But earlier these laws always applied to systems with a huge number of particles, such as a gas in a vessel or a piece of solid. Now it turned out that the motion and in general the behavior of individual, isolated particles obey probabilistic laws. This was hardly expected”3.
Yes, it is difficult, if we do not have before our eyes the MASS-STRUCTURAL INVARIANT (MS). If it is absent, physics is forced to justify its observations by the paradoxical nature of the microcosm: “The statistical character of laws, it turns out, may not be connected at all with the complexity of systems, with the fact that they consist of a very large number of objects”4. No, there is nothing wrong with statistics, but once again there is trouble with models. At the same time, the complexity of the structure of elementary particles is recognized, but it is said that it is incredible.
In general, isolated and simple microparticles are an inertia of thought that fails physicists for the third time as they move along the S-axis into the depths of matter.
At first, Thompson, relying on the dominant polycentrism of structures in the macrocosm, proposed his famously erroneous uniformly distributed model of the atom. It failed.
Then Rutherford, looking at the sky, guessed to change the type of structure to monocentric. The monocentric model of the atom triumphed. The success was so impressive that when physics got to the proton, it was inertia to assume that in the microcosm all structures are monocentric. So the model of the proton with a central core was born. However, it had to be buried under the pressure of facts.
Instead, a polycentric (partonic) model of the proton was proposed. However, the inertia of thinking was so great that, by analogy with the polycentric model of the atomic nucleus, a block-cluster model of quarks was imposed on the proton. Alas, no one has ever seen them, because they do not exist in nature. Of course, it is difficult to assume that the proton can consist of \(10^{60}\) particles whose sizes are equal to \(10^{-33}\) cm. Why?
The reason is purely methodological. Advancing to the depth of the matter, physicists for a description of newly discovered systems by the inertia of thinking always used those models which work at the scale level of the boundary region (on the right side of the S-axis). They are like generals who in peacetime always prepare for the past war. This methodological technique still somehow justified itself in the central region of the MACRO-INTERVAL, as there are no such sharp qualitative structural jumps when penetrating into the depth of minerals and metals. However, it completely failed at the junction of two intervals: Macro- and Micro. And now we know why. However, even using the MS-invariant, the author does not risk giving a prediction about the structure of the MICRO-interval, why - will become clear from the further material.
ESOTERIC DIGRESSION
One of the first laws of nature was formulated by Hermes Trismegistus - the law of scale similarity: “What is above is also below”.
This law, if properly used, becomes a powerful tool of cognition. Moreover, it can be used to deduce an extremely important epistemological consequence: all phenomena in the microcosm and in the megaworld can be explained with the help of examples and analogies from the macrocosm.
In this case, any phenomenon in the Universe becomes available to our understanding.
What is to understand? It means to compare a new phenomenon with already known phenomena, which we comprehend not only with the mind, but also with the help of sensory experience. It is the reliance on sensual experience that gives knowledge high stability, accessibility and practicality. This experience is acquired by us only in the macrocosm. In contrast, sometimes, having lost its way, science puts forward the condition of the necessity of abandoning common sense and moving to some absolutely formal, completely detached from sense experience, for example, the world of elementary particles. Another example is Newton’s theory of gravitation, in which the impact of bodies on each other is transmitted not through the material medium, but through… NOTHING. Not a single person can understand how the impact can be transmitted through absolute emptiness. That is why this abstract and incorrect scheme is artificially put into our heads from school and it is forbidden to question it. In the following we will show that this is not just a misconception, but a walled entrance to the wonderful world of the Universe, where everything is extremely simple and harmonious.
And most importantly, it’s very clear.
-
Perkins D. Inside the Proton // Fundamental Structure of Matter. M.: Mir, 1984. С. 167-168. ↩
-
Bryce S. De Witt. Quantum gravity // In the World of Science. 1984. № 2. С. 58. ↩
-
Myakishev G. Я. Elementary particles. Moscow: Nauka, 1979. С. 45. ↩
-
Myakishev G. Я. Elementary particles. Moscow: Nauka, 1979. С. 45. ↩
S-factors (Coefficients of scale symmetry)
We have already mentioned that other parameters of our world should obey the laws of scale symmetry, besides dimensional relations: mass, number of elements, time, frequency, etc. However, the author had no possibility to make a similar analysis for all these parameters. But some proportions, which I stumbled upon while collecting information on dimensional ratios, have accumulated and are, I think, of some interest to the reader. We present them here for the completeness of the picture.
WE’LL START AT \(10^{10}\).
In ordinary reference books and encyclopedias, anyone can find the relations listed below, which, although they are approximate, are performed with an accuracy of one or two orders of magnitude:
“Scale bars” made of light beams.
- The Universe we see consists of \(10^{10}\) galaxies.
- The most common galaxies contain \(10^{10}\) stars on average.
- The SWman brain contains about \(10^{10}\) neurons.
- Each cell contains about \(10^{10}\) nucleotides in 46 chromosomes.
- In addition, fifty years from now, the Earth’s population will be \(10^{10}\), and ecologists estimate that the SWman population should stabilize at this figure1.
Those are the facts. Here’s another very clear example.
We do not think much about the fact that the entire sea of light in the Universe consists not of continuous rays, but of short wave packets, because photons are emitted by atoms in quanta. TSWs, if a star shines in space, its rays are a “straw” of wave packets. In reference books on physics, you can find information that the time of emission of a quantum of light is \(10^{-8}\) seconds, and the speed of light is about \(10^{10}\) cm/s.
That is, the length of the wave packet is: Lc = \(10^{-8}\) s * \(10^{10}\) cm/s ≈ \(10^{2}\) cm.
So, if the average size of an atom is \(10^{-8}\) cm, then the length of a light “straw” equal to \(10^{2}\) cm is exactly \(10^{10}\) times the average size of an atom.
I.e., figuratively speaking, the WHOLE WORLD IS DESIGNED AS A “MASSIVE LINE” OF LIGHT RAYS WHOSE LENGTH IS \(10^{10}\) TIMES THE ATOMIC SIZE AND COMMENSURATE WITH THE AVERAGE HUMAN HEIGHT.
This fact lies on the surface, but in light of the large-scale patterns revealed in the book, it raises a lot of reflection.
THE SCALING FACTOR IS \(10^{20}\).
The analysis has shown that in the Universe the scale similarity with coefficient - \(10^{20}\) plays a great role. Any point on the S-axis (except for two extreme points) has at least two more structurally similar points.
For the macro-world, which is accessible to our direct influence, in any slice of the scale axis, we can find similar structures in the mega- and micro-worlds, which will be 20 orders of magnitude larger or smaller, respectively.
The coefficient \(10^{20}\) itself becomes a certain fixed scale of the Universe, a certain yard which many processes are considered. It can be found not only in structural similarity but also in many other proportions, both general (where it appears averagely) and particular (where it appears precisely).
HERE ARE SOME EXAMPLES OF THE \(10^{20}\) RATIO.
- Normal STARS have an average size of - \(10^{12}\) cm and are made up of \(10^{-8}\) cm atoms.
- WHITE CARLICLES - average size \(10^{10}\) cm, composed of highly compressed atoms of size \(10^{-10}\) cm.
- NEUTRON stars, compressed by gravity very strongly, - up to \(10^{7}\) cm, consist of nucleons of \(10^{-13}\) cm in size.
IN ALL CASES THE SCALE “DISTANCE” BETWEEN THE SYSTEM AND ITS ELEMENTS IS THE SAME - \(10^{20}\).
Let us remind once again that stars are more than 90% of the matter of the Universe, hence S-COEFFICIENT \(10^{20}\) is the UNIVERSAL COSMIC PROPORTION.
- PULSARs emit at a variety of frequencies. The full range of radiation is enormous. For example, “the ratio of frequencies at both ends of the SWge range of electromagnetic waves at which NP 0531 radiates is (\(10^{20}\):1) - a fantastically large value”2.
The highest frequency of pulsar emission is the gamma-ray range, which exceeds 3 \(\times\) \(10^{27}\) hertz, the lowest frequency is the radio range, which is close to 3 \(\times\) \(10^{7}\) hertz (10 m wavelength), i.e. there is again a difference of 20 orders of magnitude between them.
- In a new light, we can now consider the BIG NUMBERS PROBLEM. The values of the parameters used in obtaining the Big Numbers were chosen in such a way that they belong to the beginning of the Macro-interval and the end of the Mega-interval (see Fig. 1.4).
This resulted in doubled scale similarity coefficients close to (\(10^{20}\))\(^2\) = \(10^{40}\).
TSWs, the GENERAL STRUCTURAL INVARIANT has a length of 20 lengths on the S-axis and unfolds over the massive length of the Universe in three ways: in the MICROMIR, MACROMIR and MEGAMIR. At the same time, it is manifested not only in the similarity of the structures of these three worlds but also, as the above examples have shown, in the correlation of elements - system, in the relation of extreme frequency characteristics of stars, etc. We can be sure that in time a great number of other examples of manifestation of this coefficient of scale similarity will be found.
SCALE SYMMETRY COEFFICIENT (SSC) \(10^{60}\). We have already mentioned, according to M. A. Markov’s model of the Micro-Macrosymmetric Universe, a maximon can be a Universe for its internal structure, and the Universe can be a maximon for the MetaUniverse, etc. (see Fig. 1.3). Based on this model, we can talk about the possible presence in Nature of global symmetry of similarity with the coefficient \(10^{60}\), and if such a similarity coefficient exists, then the regularities of changes in structures as they approach the edges of the scale interval (\(10^{-33}\) cm and \(10^{28}\) cm) will also be similar. Let us consider this question in more detail.
To begin with, the objects of the Universe on its many scale floors can belong to different types of structures.
For example, even a cursory glance is enough to detect the overwhelming dominance of spherical formations on scales from \(10^{9}\) to \(10^{13}\) cm (CLASS # 9) - stars. On the scale of \(10^{20}\)- \(10^{23}\) cm (CLASS # 11), galaxies have more varied shapes, among them there are not only elliptical and spiral galaxies but also flat and needle-shaped ones.
However, not only galactic floors differ from stellar floors by their average type of dimensionality. In the macrocosm, the atomic floors (CLASS # 5) of the Universe have predominantly nuclear-shell structures, while the cellular, organismal, and biocenotic floors (CLASS # 6-8) have polycentric and more complex structures. All this leads us to the assumption that each scale level of the Universe has its own inherent structure, the dominance of some particular types of forms and types of symmetry. Therefore, in this section, we will further analyze the global structural dimensionality of the Universe, a kind of macroview of global trends.
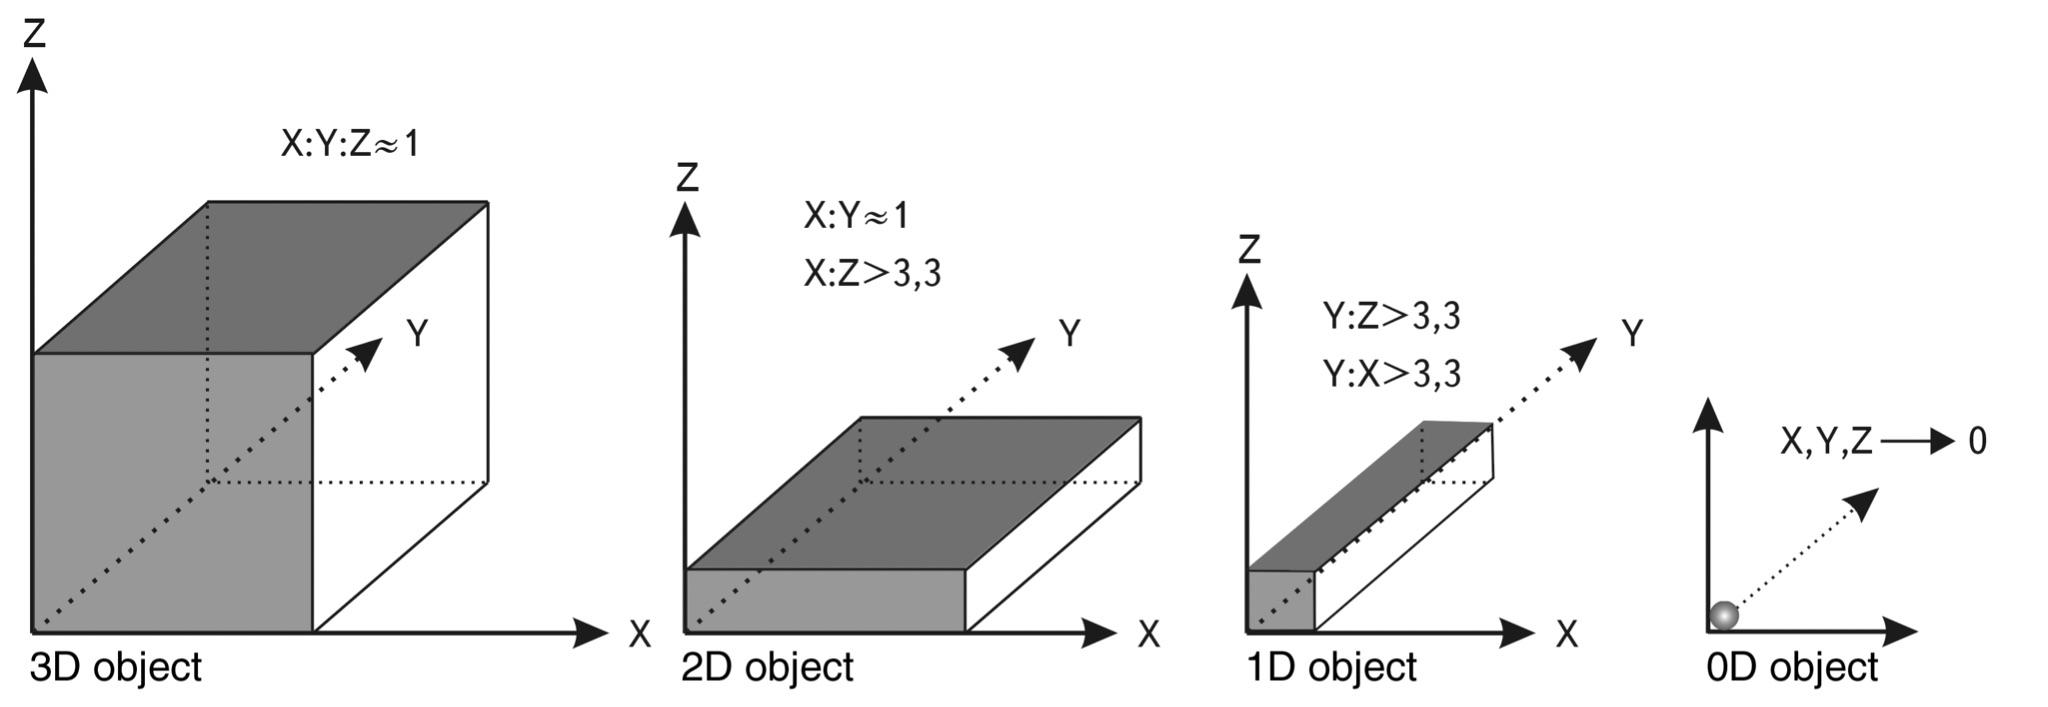
Fig. 1.45
METHODOLOGICAL DEPARTURE
In order not to go into the subtleties of structural analysis, let us limit ourselves to the most important criterion - the dimensionality of the system. We will distinguish the following main types of dimensions: zero-dimensional, one-dimensional, two-dimensional, three-dimensional and four-dimensional.
On the one hand, any real system in our world has at least three dimensions. Even a spider’s web has a thickness in addition to its length. On the other hand, in all areas of natural science, we use the terms: linear, flat, volumetric… These terms already contain an idea of the dimensionality of the system.
Without special justifications (they will be given in the second book of the cycle), let us introduce a minimal criterion for “loss” of one of the dimensions: along it the system size should be smaller by a factor of 3.3 than along the maximum system size. The maximum coefficient of “loss” of one of the dimensions is approximately 1:10. Then any system can be easily divided by us into different dimensional types (see Fig. 1.45).
The only exception would be the four-dimensional type of system, where more complex separation criteria must be used, the introduction and justification of which we will also leave for the future.
So, let’s start our review of global trends from the top, with METAGALACTICS.
Astronomy has accumulated a lot of irrefutable facts, which allowed by the end of the XX century to make the assumption that the Metagalaxy has a cellular structure. The average size of a cell is 100 megaparsecs (3 \(\times\) \(10^{26}\) cm). The entire Metagalaxy is almost 100 times larger than the average cell size, ~1.5 \(\times\) \(10^{28}\) cm.
What are the Metagalactic Cells?
At first, astronomers believed that they form something like foam or honeycombs. However, careful observations have shown that “galaxy clusters… form an essentially one-dimensional structure”3, hence, the “walls” of these “honeycombs” are actually “holes” (see Fig. 1.46). Therefore, it is more correct to compare the structure of the Metagalaxy with a volumetric wireframe consisting of elongated superscales4.
To be precise, the term “supercluster” is incorrect, because “numerical experiments show that the cellular structure has a primary origin and was formed before galaxies and galaxy clusters formed during the epoch of the gaseous phase of the Universe…”4. TSWs, only for cluster-scale formations (\(10^{25}\) cm) we can assume the natural crowding of galaxies together, although, taking into account the problem of “hidden mass”, even here there is still much unclear. For example, it is still unclear whether the “wires” of the superclusters are connected in a single bulk structure (as depicted in Fig. 1.46) or whether each supercluster exists separately. In the latter case, we can compare the structure of the Metagalaxy to absorbent cotton, in which, however, each “thread” exists by itself and is not connected to neighboring “threads” in any way. Therefore, with some reservations, but we can accept the scale of \(10^{25}\) cm as some boundary separating the world of galaxies and their systems with the world of the internal structure of the Metagalaxy.
If this is true, then we can say that on mega-scales of \(10^{27}\)…\(10^{28}\) cm the world is dominated by one-dimensional structures, since the ratio of the length of these “superwires” to their diameter is 6:1 on average.
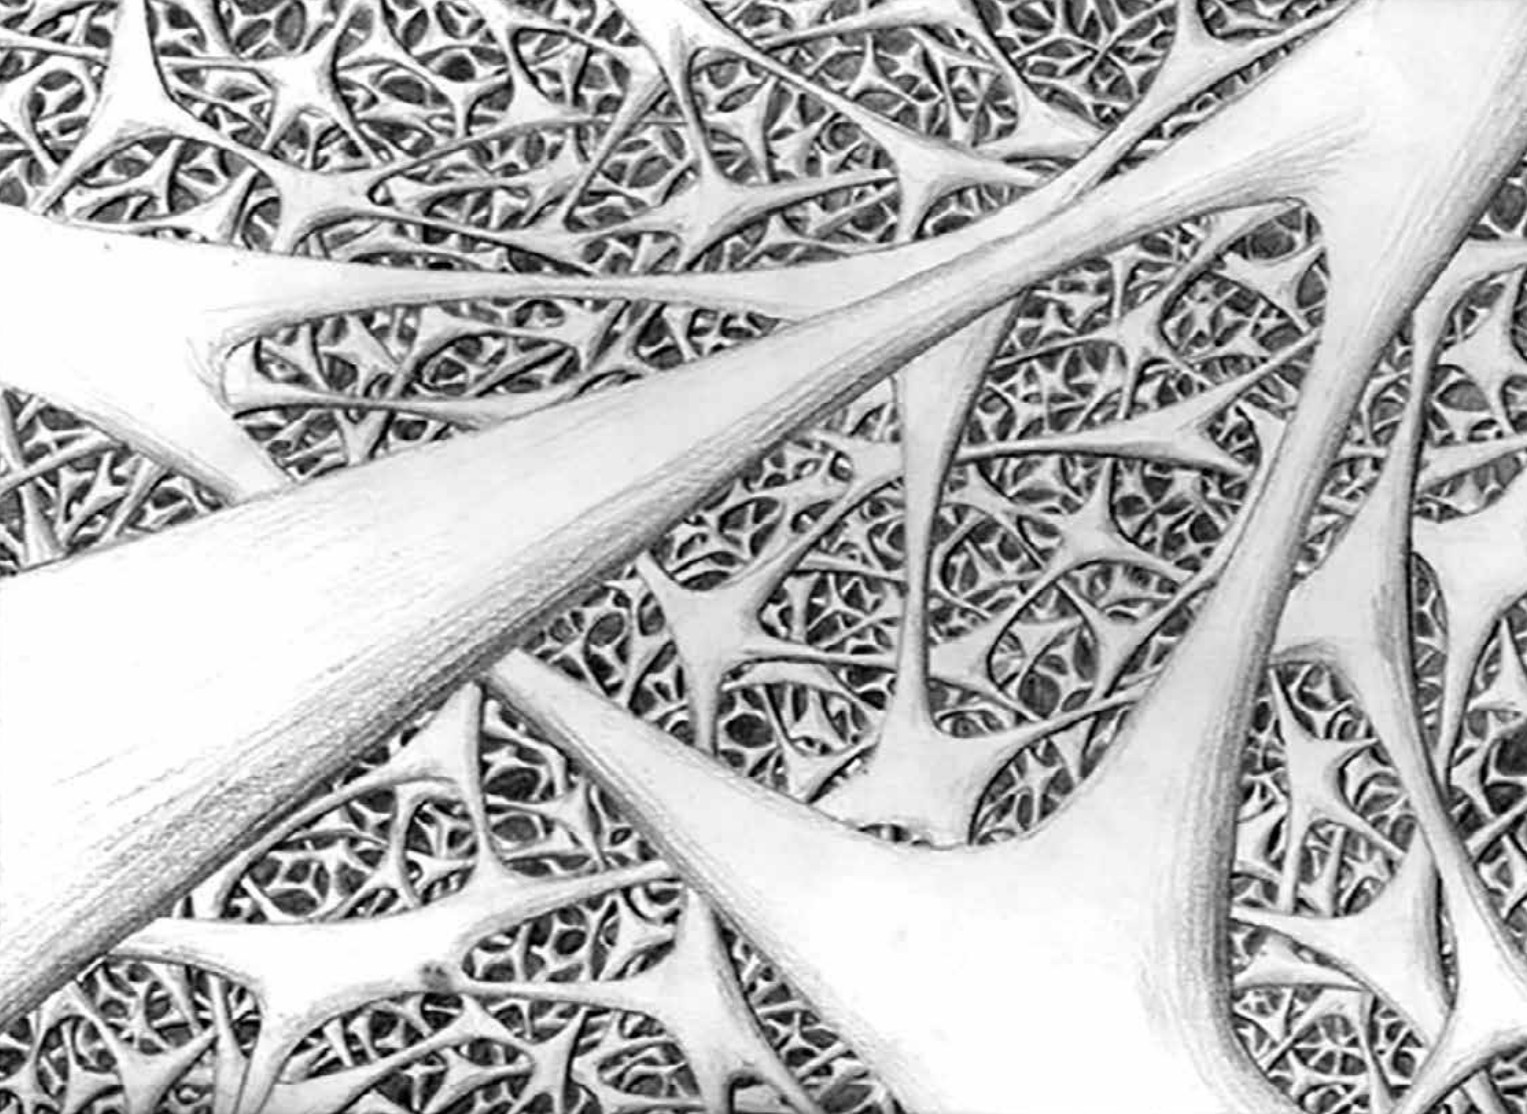 Fig. 1.46. “Up close” the cellular structure of the Metagalaxy may be as it is depicted in the drawing by Anya Abrikosova, a school friend of the author’s daughter. This purely abstract fantasy “from nothing to do” could also be not accidental
Let us now go deeper, to scales of \(10^{25}\)- \(10^{26}\) cm. Here we enter the world of galaxy clusters and groups5. These are the ones that make up the filaments of super scatterings. The shape of clusters (~\(10^{25}\) cm) and groups (~\(10^{24}\) cm) is predominantly two-dimensional - they are mostly flat.
Astronomers often use the term “flat disk clusters” in this connection. Moreover, these clusters of irregular6 type are homogeneous in density and consist of the youngest galaxies (in particular, spiral galaxies). Therefore, if we talk about the present-day structure of the Metagalaxy, it is represented mainly by two-dimensional structures at scales of \(10^{23}\)- \(10^{26}\) cm.
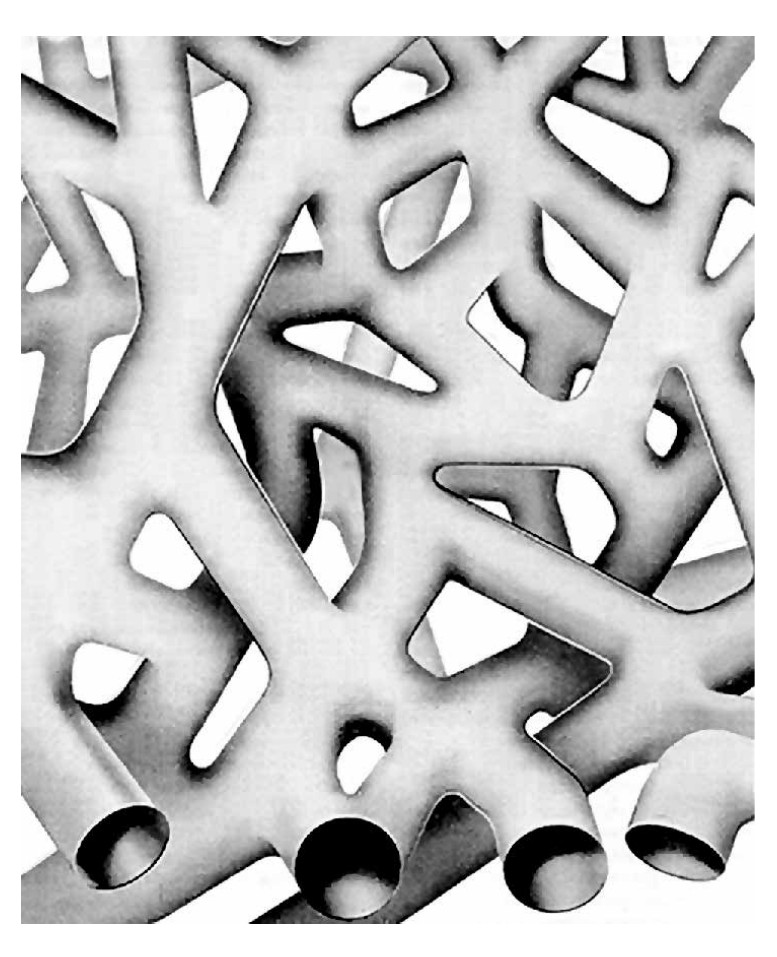 Fig. 1.47. Dimensionality of space on the Planck length scales according to some physicists’ ideas1
However, there are also clusters of the “regular” type (the number of galaxies in them ranges from 200 to 11,000)7 , which mainly consist of old elliptical galaxies containing old stars of the first generation. They also differ from irregulars in that they are predominantly spherical in shape with a strong concentration of galaxies toward the center, where the density is sometimes 40,000 times higher than the average density of the distribution of galaxies in the Metagalaxy 8. If we take elliptical galaxies as a “cosmic” component of this world, and spiral galaxies as a living one, then clusters of the “correct” three-dimensional type inside the “neural network” of “living” elliptical galaxies can be perceived as some nodes of obliquity inside the “network of life”.
So, if we talk about the STRUCTURE of our present Universe (and not consider the remnants of the structure of the Universe when it was very young and had an age of the size of the types of structures of the Universe:
4 → 3 → 2 → 1 → 0
This phenomenological generalization is difficult to explain from the position of classical astrophysics.
If we turn to the opposite, left edge of the scale range of the Universe, to the scale levels of the microworld, it turns out that something similar, although less reliably established, can be found there as well. We are talking about string theory, which pervades the submicrocosm. (see Fig. 1.47). Taking into account Markov’s position regarding maximons as point null-dimensional objects, each of which may have the internal structure of the whole Universe, one can PROPOSE that ON THE MAIN “edges” of the Universe the only 1 billion years), then when passing from level to level, a reliable, but very mysterious, at first glance, tendency is manifested here. Level \(10^{21}\)- \(10^{23}\) cm. The morphological diversity of galaxies allows us to distinguish all dimensional types from zero-dimensional (quasars) to four-dimensional (spiral galaxies).
Level \(10^{23}\)- \(10^{25}\) cm. Galaxies are connected mainly in two-dimensional groups and flat clusters, i.e., the planar, two-dimensional structure dominates at the level of galaxy clusters.
Level \(10^{26}\) cm. The super slopes have predominantly one-dimensional structures. The linear, one-dimensional structure dominates.
Level \(10^{28}\) cm. If we take M. A. Markov’s position, then the entire Metagalaxy is most likely a point, zero-dimensional object for an external observer.
A very simple and unexpected conclusion follows from all of this.
Starting from the level of the scale of galaxies and climbing higher on the scale ladder of the Universe, one finds a step-by-step decrease in dimensionality of the structure is symmetric. OF THE UNIVERSE THE DIMENSIONALITY OF THE STRUCTURE SYMMETRICALLY DECREASES.
Then, going from left to right along the S-axis, starting from maximons and reaching atoms, we will pass through the following sequence of increasing dimensionality of structures:
0 → 1 → 2 → 3 → 4
WHAT DO WE SEE IN THE CENTER OF THE S-axis? Without going into details, we can assert that in the material world studied by us to date, the highest diversity of forms, the highest complexity of structures and the highest diversity of dimensions are characteristic of the Biosphere, which in its scale range as a whole is very close to the SCALE CENTER of THE UNIVERSE (SCU) and far from its edges. And if we define the dimensionality by the criterion of the ratio of the number of connections per one node of the network, then in the neural network of the brain it becomes just fantastically multidimensional.
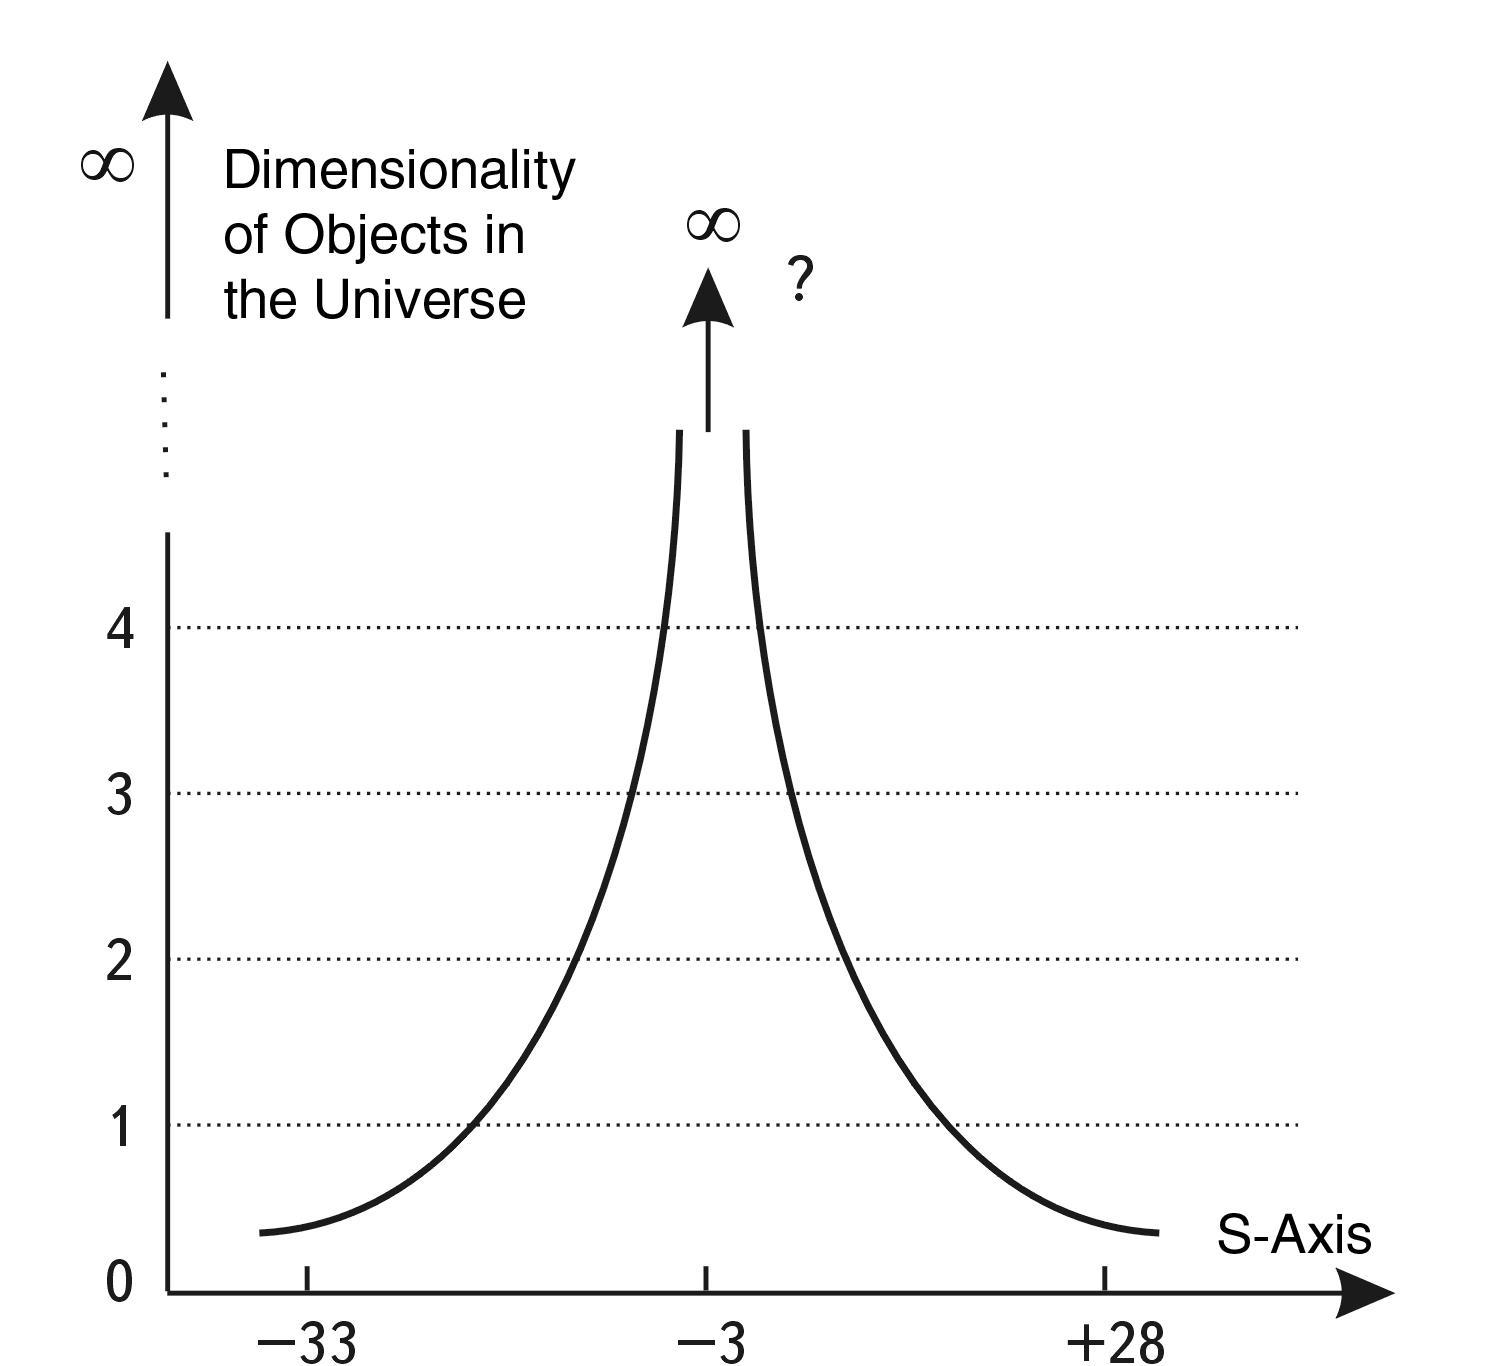 Fig. 1.48. The dimensionality of objects in the Universe increases as we move away from its scaling edges (where the dimensionality tends to zero) and approach to the SCU
From all this we can draw a preliminary generalizing conclusion that the global complexity (and the dimensionality that is related to complexity) of the Universe increases from its scaling edges to its scaling center (Fig. 1.49).
Since structural complexity, as it will be shown in the third book of the cycle, is the foundation of information complexity of systems, if we trace with our mental gaze the path of complication of matter from the smallest particles of the microcosm and beyond, we will see a beautiful and mysterious phenomenological picture.
The complexity of objects and systems gradually increases from the microworld as one moves along the scale ladder, reaches a maximum in the central biological region of the S-axis, manifesting itself through the fantastic diversity of living forms, and then begins to gradually decrease until it reaches the main types of morphological diversity in the region of galaxies, and then rapidly decreases down to linear structures, ending with a zero-dimensional object, a “point” of the Universe, which, according to M. A. Markov’s theory, becomes a freedmon for the Meta-Universe.
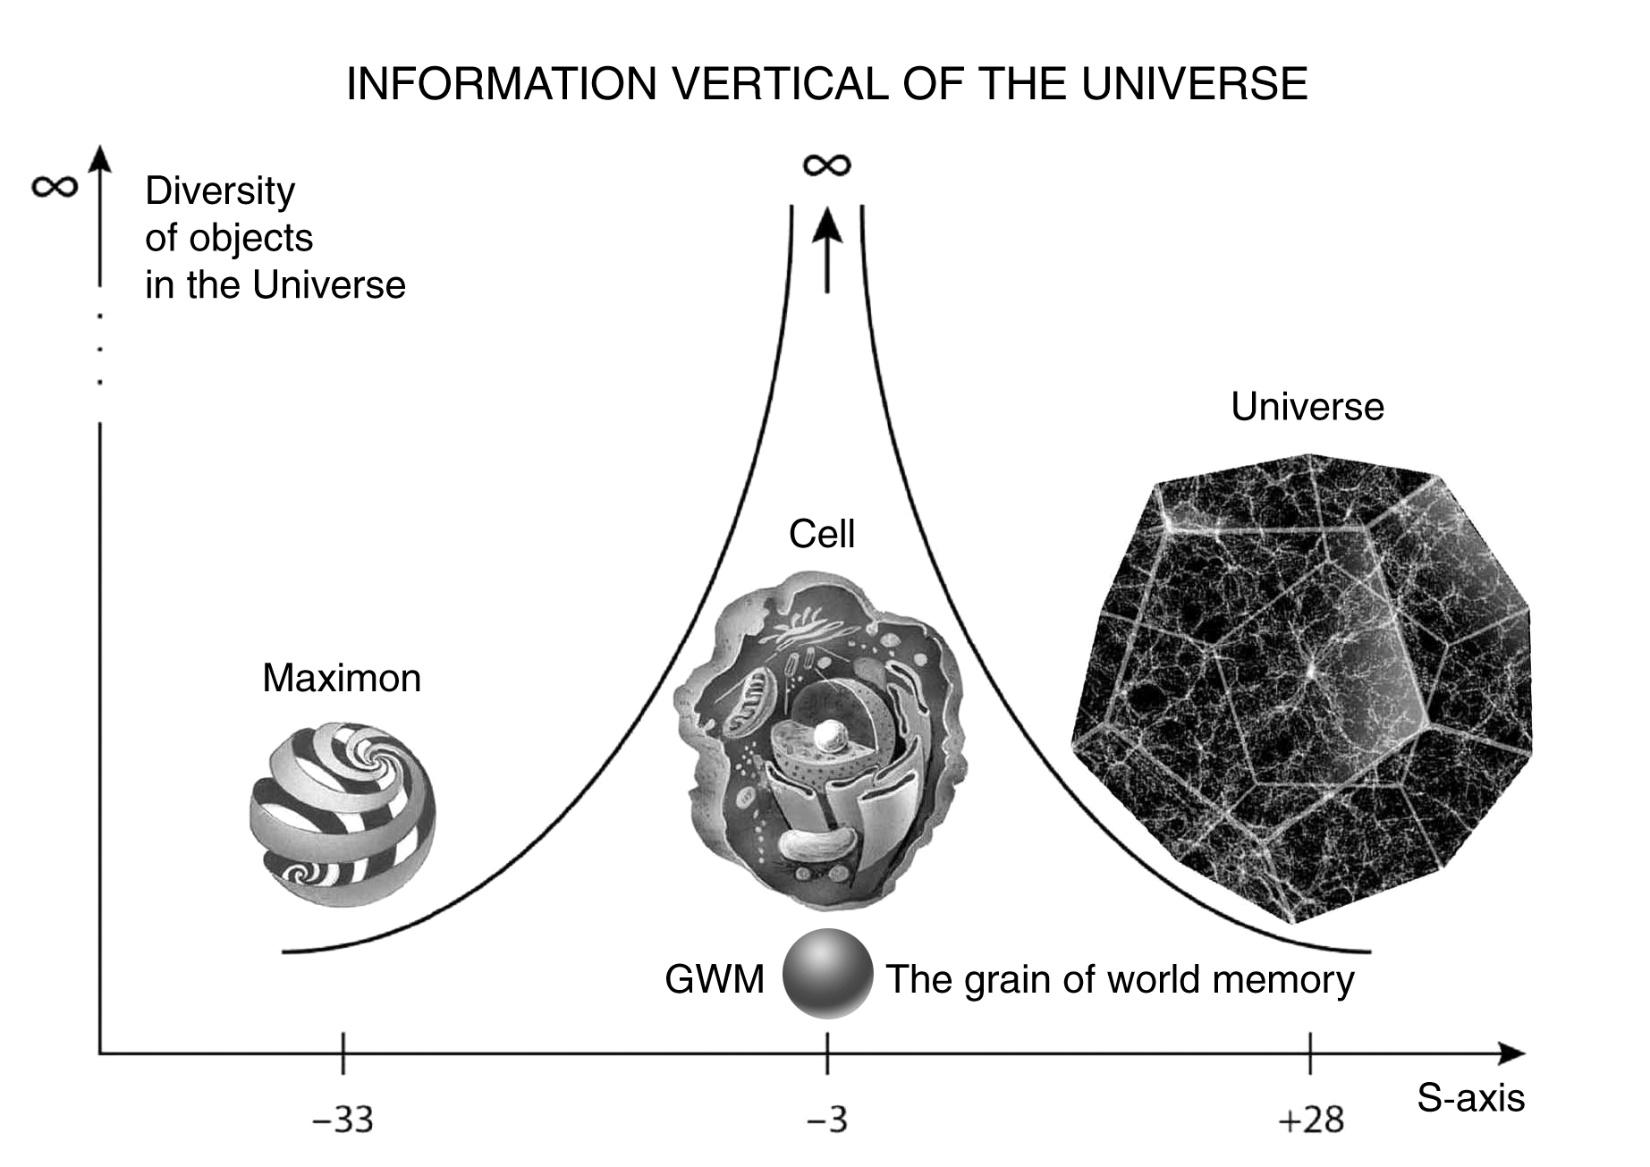 Fig. 1.49. The diversity and complexity of objects grows as we approach from the edges of the scale range of the Universe to its center
This regularity is revealed only in the most general and approximate form and represents only an image, but in the following, we will show that this image hides the deep physical essence of large-scale interactions in the Universe.
Concluding this section, let us make an intermediate generalization and list the following RANGE OF COEFFICIENTS OF MASSAGE SUBJECT (SYMMETRY):
\(10^5\)- \(10^{10}\)- \(10^{20}\)- \(10^{60}\)
All of them are multiples of each other, and their combinations give rise to a number of intermediate dimensionless constants, for example: \(10^{15}\) - SCALE RANGE, \(10^{40}\) - LARGE NUMBERS.
So, after analyzing a large amount of material about the sizes of various objects of the Universe, we see that the phenomenon of Big Numbers, which occupied the minds of many physicists: Dirac, Gamow, Einstein, and others, is only a small part of the MASTER SYMMETRY of the Universe.
Closing on this section of the general STATIC description of the MASTER SYMMETRY of the Universe, we should add that the author has now accumulated much more factual material, which would confirm the existence of scale symmetry than is given in this part of the work. Basically, this additional material allows us to specify or add some particular aspects of the presented model, but from it it is possible to obtain, besides, information about subtle features of scale symmetry.
In the next chapter, we take only the first step in this direction.
-
Fundamentals of Ecology. SPb.: Special Literature, 1998. С. 158 ↩ ↩2
-
Shklovsky I. S. Stars. Their birth, life and death. Moscow: Nauka, 1977. С. 309. ↩
-
Large-scale structure of the Universe. / Edited by M. Longyear and J. Einasto. M.: Mir, 1981. С. 278. ↩
-
Large-scale structure of the Universe. / Edited by M. Longyear and J. Einasto. M.: Mir, 1981. С. 277. ↩ ↩2
-
Vorontsov-Vel’yaminov B. A. Extragalactic Astronomy. M.: Nauka, 1978. С. 407. ↩
-
Vorontsov-Vel’yaminov B. A. Extragalactic Astronomy. M.: Nauka, 1978. С. 271-272. ↩
-
Aghekyan T. A. Stars, Galaxies, Metagalaxy. M.: Nauka, 1981. С. 216. ↩
-
Aghekyan T. A. Stars, Galaxies, Metagalaxy. M.: Nauka, 1981. С. 213, 215. ↩
Epochs of structure formation
So far we have tried to show that there are special stability points on the S-axis of the Universe, which do not depend on the nature of the objects inhabiting them. We distinguished special, characteristic dimensions of nature and showed that they are reflected by the S - Wave of stability (SWS) model. At the same time, from the point of view of any local scientific discipline, we considered these characteristic dimensions very averagely, to within one order of magnitude. Even such an important size as the scale center of the Universe, we determined within the range from 10 to 100 μm.
All this was justified because “face to face you cannot see the face”, i.e. at the beginning of the study it was necessary to look from afar at the scale symmetry, some detachment from details and subtleties. However, at the next stage of analysis, there is a need to detail the SCALE-STRUCTURE FRAMEWORK of stable, special dimensions.
Certainly, it is not possible to carry out this work entirely by one person, because for this purpose it is necessary to consider statistical curves of distribution on sizes of a very large number of types of systems of the Universe. What we can do here is to take and, having selected some of the most characteristic regions on the S-axis, examine them in more detail and accurately. Naturally, this should be done first of all for atoms and their nuclei, as well as for stars. Recall that more than 99% of the matter of the Universe is concentrated in the stellar form, and atoms are the building blocks for all its material structures.
Bimodality of distribution atoms by size
In the classification discussed above, one of the most interesting parts of the S-axis is the one where atoms are located. It has two most characteristic points on the S-axis: the average size of an atom and its nucleus. According to refined calculations, the most characteristic sizes for these systems are 1.6 \(\times\) \(10^{-8}\) cm and 1.6 \(\times\) \(10^{-13}\) cm, respectively.
ATOMS (CLASS #5). Atomic radii are determined by the closeness of atomic proximity in the structure of molecules and crystals. The radius (r) obtained in this way corresponds approximately to the radius of the radial density maximum in the charge distribution of neutral atoms. In addition, the value 2r, or atom diameter, is approximately equal to the gas-kinetic diameter of motion of single-atom molecules. If we use the values of r for various atoms given in the reference book of C. W. Allen1, we can construct a histogram of the TEM distribution of chemical elements as a function of atomic diameter (see Fig. 1.50).
Analysis of the histogram shows that there are two special dimensions on the S-axis around which the values of atomic diameters are statistically concentrated.
These two special sizes, or modes,
By the way, a weakly expressed third mode can also be distinguished, but we will leave this question outside the brackets of our consideration for the time being.
have the following coordinates on the S-axis: the first mode is 1.2…1.6 \(\times\) \(10^{-8}\) cm, and the second mode is 2.4…3.6 \(\times\) \(10^{-8}\) cm.
Note that for different elements only the coefficients before \(10^{-8}\) change, so further we will specify only these coefficients for the sizes of TEM elements.
The first mode includes items such as:
- hydrogen - 1.4
- carbon - 1.5
- nitrogen - 1.4
- oxygen - 1.2
- fluorine - 1.2
To the second mode, about 60 of the remaining most common elements in nature.
Moreover, HELIUM - the second number, coming right after HYDROGEN in the Mendeleev table of elements and terms of prevalence in the Universe, has a diameter that belongs not to the first mode, which would seem to be very logical, but to the second - 2.44 \(\times\) \(10^{-8}\) cm. The tendency for the diameter of an atom to increase as its nucleus and the number of electrons in orbit increase is simple and understandable. However, a closer look reveals a very contradictory picture: this trend has a “reciprocating” character. For illustration, we have constructed the simplest diagram (see Fig. 1.51) of the dependence of the atom diameter on the group number in the periodic system of elements of D. I. Mendeleev. Analyzing this diagram, we see that as we move along the order number of the elements, the same pattern is manifested: a sharp jump in the size of the atom of group I at the beginning of each period and a subsequent slowing decrease in the size of the atom as we approach the end of the period.
If we do not take into account inert gases, it seems that the completion of shells to the maximum completeness, starting from period III and further, is possible only within a very narrow range of sizes - 2…3.6 angstroms.
Moreover, if we look carefully at the constructed diagram, we get the impression that there are two “centers of attraction” of all “trajectories”, two regions of increased stability on the S-axis: the first - in the region of sizes 1.2-1.6 angstroms (I and II periods), the second - in the region of sizes 2.4-3.6 angstroms. They are highlighted on the diagram by spots.
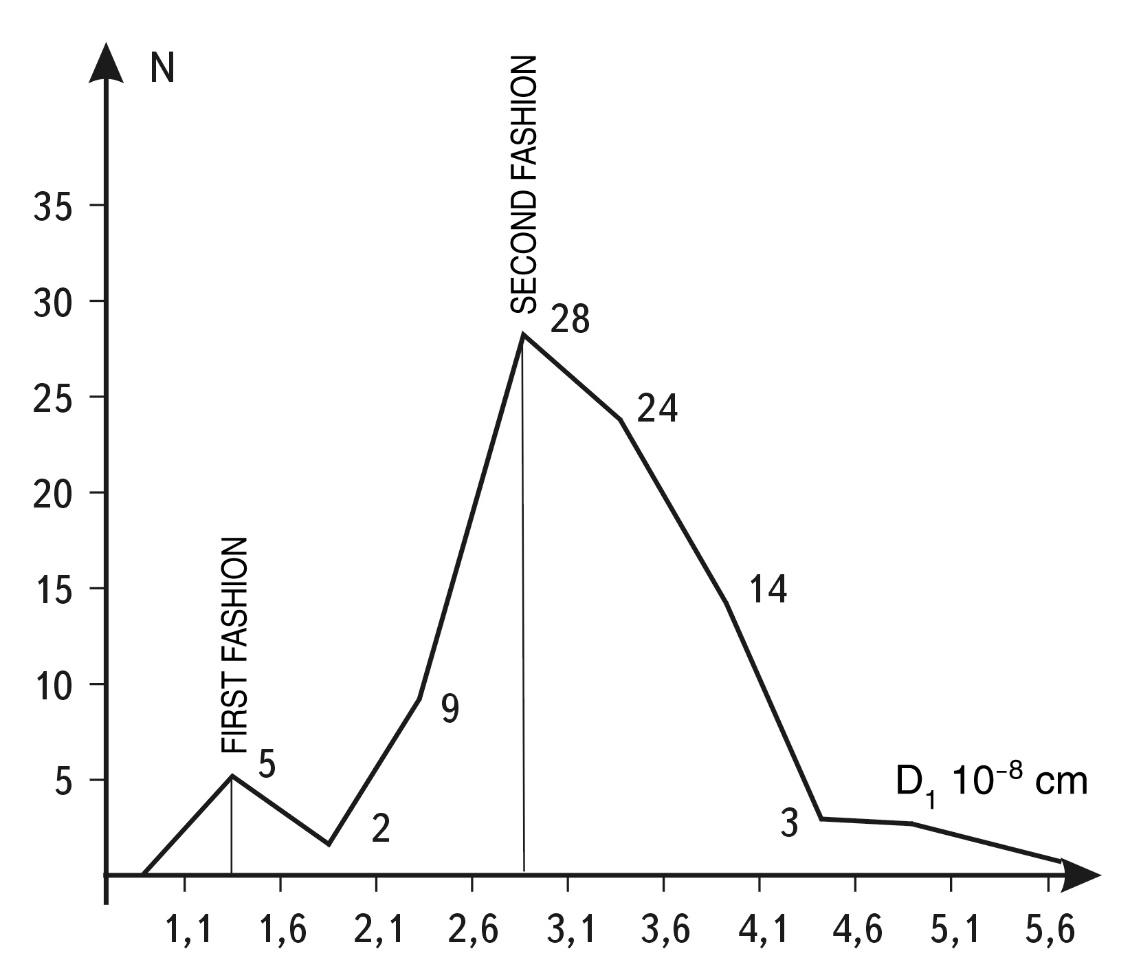 Fig. 1.50. Histogram of distribution of elements of the Mendeleev Table of Elements (TEM) depending on the diameter of elements. The histogram shows that all the diversity of the atomic composition of the Universe is associated with two main sizes (modes) - 1.4 and 2.8 angstroms. If we construct a similar histogram, taking into account the number of atoms of each element in the Universe, hydrogen would give the first mode a weight of more than 90%, and helium would give the second mode a weight of about 7%. The other elements would essentially provide an insignificant background that can be neglected. This indicates that the two modes we have distinguished are extremely representative from any point of view
Figuratively speaking, the elements of each new group formed far away from these regions are rapidly attracted by these regions as their mass grows, and the “trajectories” of each period are “bent” by the attraction of these two regions.
This unique fact can be interpreted as follows.
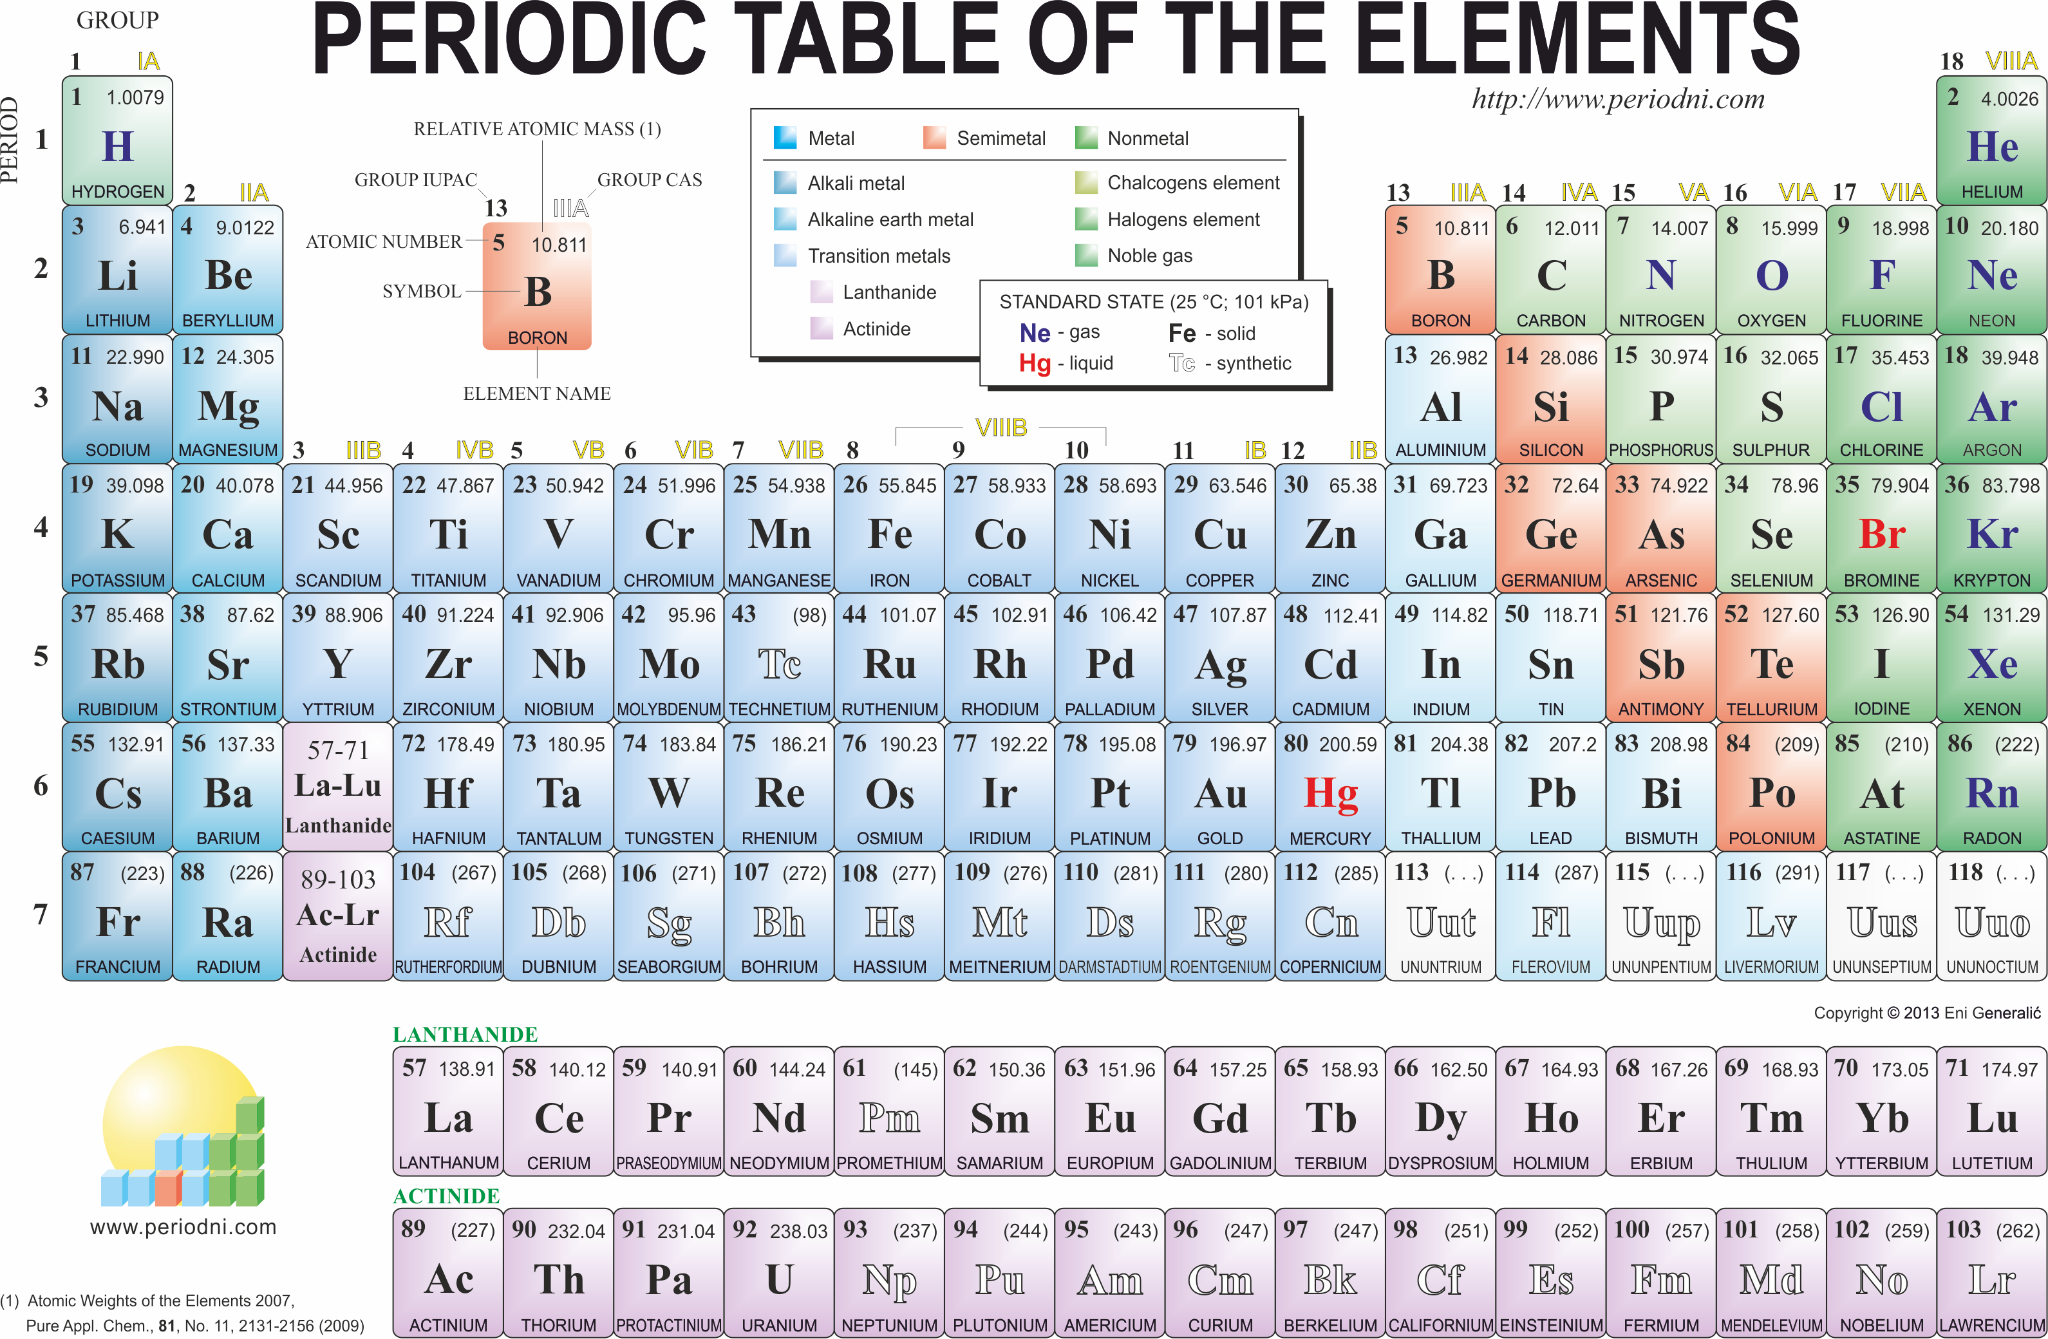
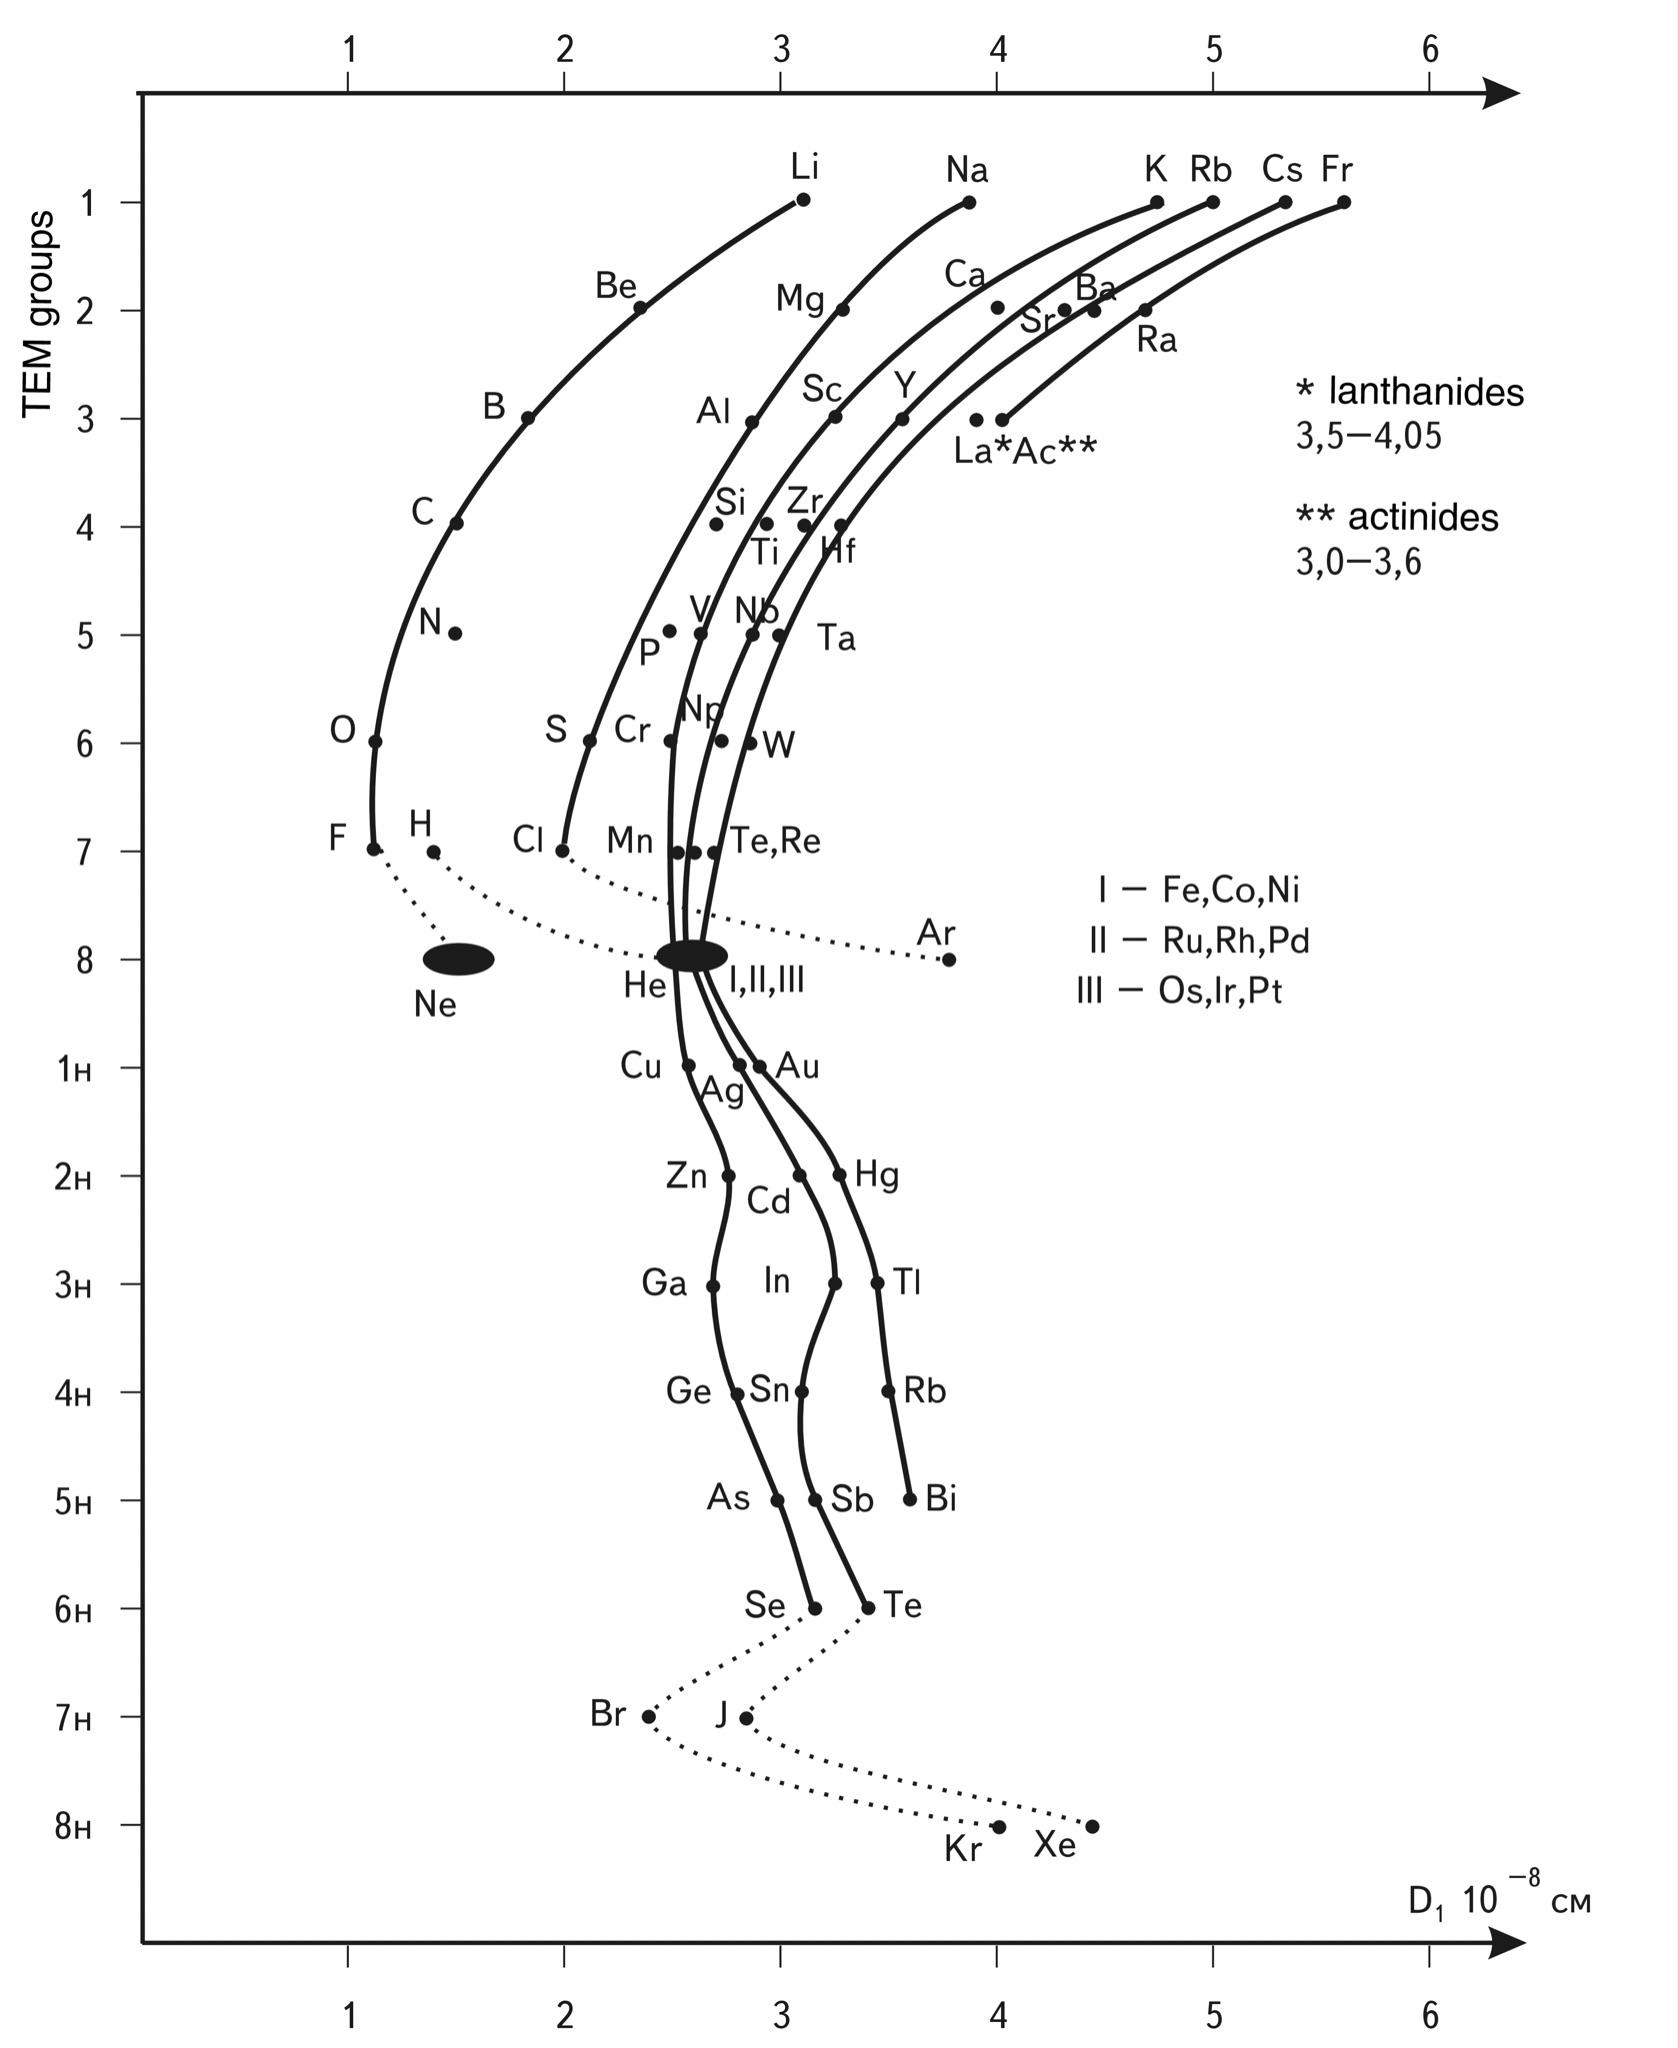 Fig. 1.51. Diagram “atom size - group number” for the Mendeleev Periodic Table of Elements of elements.
The diagram shows that the rows are built approximately “parallel” to each other. In order not to form a “mush” of points on the diagram, a separate place is allocated for the elements of the lower rows of the TEM of large periods, and the numbers of groups for the lower rows are marked with the index “n”. As a result, the in-plane unfolded diagram of atom distribution along the S-axis is obtained.
The choice of such a formal criterion as group number as the second coordinate is due to the desire to emphasize the size distribution of atoms. It would be possible to construct more physically filled diagrams, taking as a second parameter, for example, the ionization potential or the electron distribution density in the volume of the atom, but the essence of this would not change much.
Analysis of the diagram shows that the size of the atoms increases as the mass of the atoms increases. This quite logical phenomenon has, however, at first sight, a very strange internal manifestation: the growth of sizes does not occur gradually but by leaps. These jumps are seemingly illogical: all elements, from which the periods begin, are the largest atoms in their periods, although they have the smallest number of protons and electrons
The stability of the configuration of electron orbits of atoms increases when they fill the SUSTAINABLE SPACE cells with two main characteristic (stable) sizes - (1.2-1.6) and (2.4-3.6) angstroms.
It should be noted that all “trajectories” in the diagram behave very similarly. The sequences on which atoms “sit” are shifted towards larger sizes, and their lower parts, populated by limit atoms, appear in a very narrow dimensional zone as if this region of the S-axis draws them into itself.
The bimodality revealed above leads to the need for some refinement of the model of SW built by us earlier. In fact, if the first mode (~1.6 \(\times\) \(10^{-8}\) cm) is calculated by this model, the significant second mode (~3 \(\times\) \(10^{-8}\) cm) is not predicted in advance by the model. If we take into account the role of atoms as the most important elements of the structure of the Universe, this reliable fact should not be neglected.
So, once again, let’s record the results obtained.
First, the stable size of 1.6 \(\times\) \(10^{-8}\) cm, which gives the SW model, is represented not only by hydrogen but also by four other most abundant elements in the Universe (excluding helium), whose mass fraction (see Table 1.2) is more than 3 times larger than that of all other elements. Second, next to this most “weighty” size, we find another distinguished size that is almost 2 times larger than the first one, about 3.0 \(\times\) \(10^{-8}\) cm. This size characterizes most of the other elements of the Universe, both in terms of their number (60 TEM elements) and mass.
TSWs, only somewhere about 30 other elements have sizes not belonging to the two main stable sizes, but these 30 elements in their number in the Universe are not more than 0.01 % (see Table 1.2). In principle, at the first stage they can be not considered at all due to their extremely insignificant fraction.
Table 1.2.
Prevalence of element groups in the Universe2. For hydrogen the value of 100 is accepted
| Group of elements | Number of atoms | Weight |
|---|---|---|
| Н | 100 | 100 |
| Don’t | 8,5 | 34 |
| C, N, O, Ne | 0,116 | 1,75 |
| Metals, etc. | 0,014 | 0,50 |
| Total: | 108,63 | 136,25 |
Consequently, if we consider the crest of the SWS in the atomic size region, we should be guided mainly by two sizes (taking into account a small dispersion). One size is known to us, we calculated it using the scale symmetry coefficient - \(10^5\). The other is an unexpected size for our model; its existence was not predicted by our model in its original form.
By the way, the question may arise, why do we pay so much attention to a narrow range of sizes, which occupies less than one order of magnitude on the S-axis? After all, in the Universe there exist both molecules and particles whose sizes are close to two calculated sizes.
The answer is simple. The weight fraction of molecules and dust in the Universe in relation to free atoms is vanishingly small, as well as the weight fraction of planets and comets. If we mentally start moving along the S-axis to the right of the two sizes we have selected, then practically up to the sizes of stars, which is 20 orders of magnitude to the right along the S-axis, we cannot find objects in the Universe, the mass fraction of which would give us at least some elevation on the diagram on the background of the mass fraction of atoms.
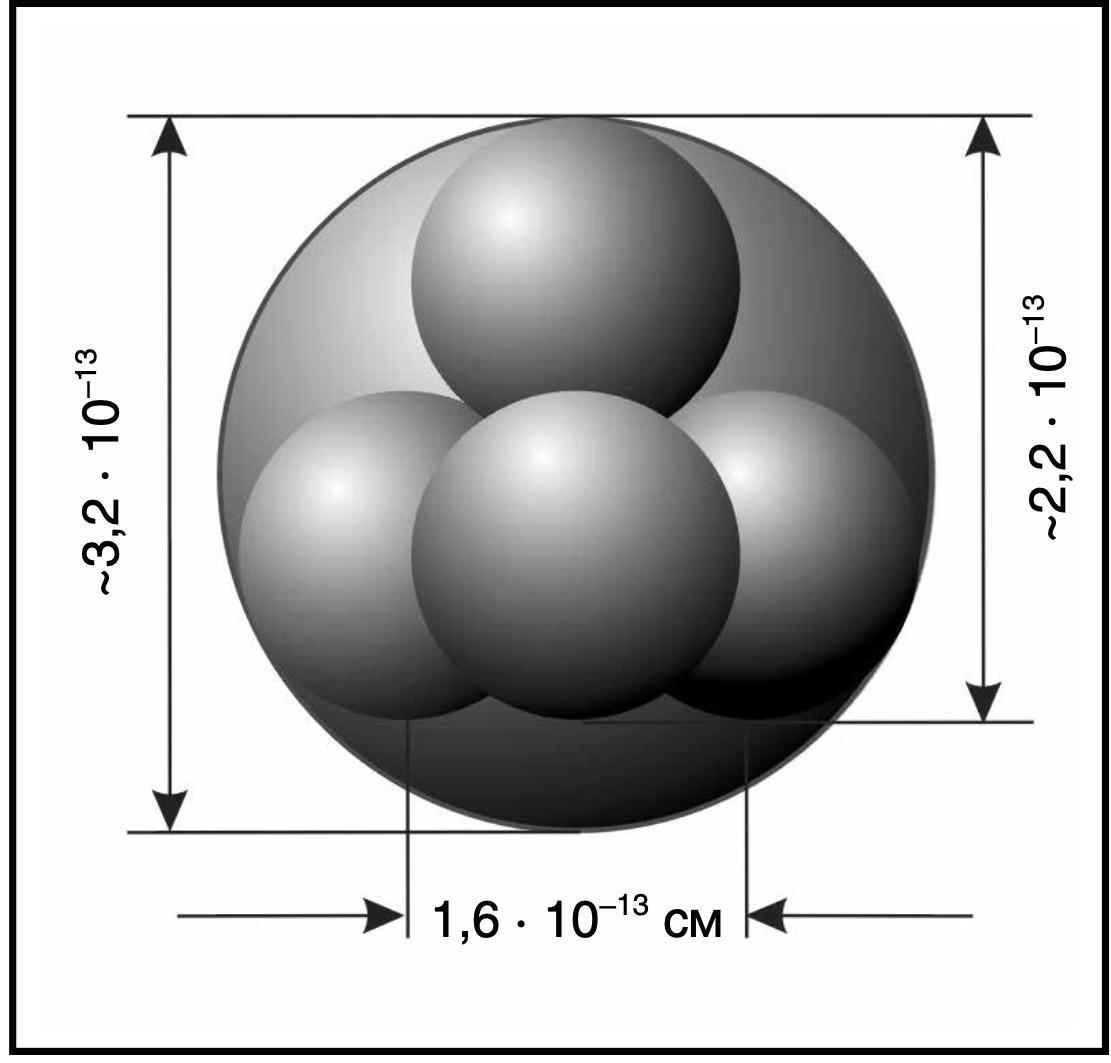 Fig. 1.52. The helium nucleus, or α-particle, consists of two neutrons and two protons
If we move from the atomic ridge to the left, then after five orders of magnitude we will find ourselves in the scale zone of atomic nuclei (CLASS #4). These contain more than 99.9% of the atomic mass. For them, too, it is important to study the characteristic points on the S-axis.
ATOMIC NUCLEI (CLASS #4). Let us consider how the nuclei of atoms are distributed by size. The radii of light nuclei are determined3 by the empirically derived formula R=1.3 \(\times\) \(10^{-13}\) \(\times\) A\(^{1/3}\) cm.
In this case, we are interested in two nuclei - hydrogen and helium.
As mentioned in Section 1.3.2, the diameter of a Hydrogen Nucleus consisting of a single nucleon is 1.6 \(\times\) \(10^{-13}\) cm4.
The diameter of the helium nucleus, which also has extremely high stability and consists of four nucleons, is at least twice that of the hydrogen nucleus, 3.2 \(\times\) \(10^{-13}\) cm (see Fig. 1.51).
Since hydrogen and helium in general occupy more than 90% of the matter in the Universe, we can talk about bimodality in the distribution of atomic nuclei.
However, both for atoms and their nuclei, we can distinguish a third mode in the distribution, which is occupied by the nuclei of the elements of the iron group. For the iron nucleus (A = 56) we obtain a size of 10.7 \(\times\) \(10^{-13}\) cm.
One mode is for the proton, i.e., the hydrogen nucleus, is 1.6 \(\times\) \(10^{-13}\) cm (73% of the entire visible mass of the Universe). The other mode for the helium nucleus is 3.2 \(\times\) \(10^{-13}\) cm (25% of the entire visible mass of the Universe).
It should be noted that, unlike atoms, the distribution of nuclei by their sizes is continuous. The nuclei on the S-axis are not concentrated into two groups if their distribution is considered without taking into account the mass fraction. So, we see the obvious fact of the bimodal distribution of the main elements of the Universe on the S-axis in their nuclear and atomic forms.
-
Allen K. W. Astrophysical Magnitudes. M.: Mir, 1977. С. 73. ↩
-
Allen K. W. Astrophysical Magnitudes. M.: Mir, 1977. С. 50. ↩
-
Mukhin K. N. Experimental Nuclear Physics. Moscow: Atomizdat, 1974, vol. 1. С. 431. ↩
-
Y. M. Shirokov, N. Yudin. P. Nuclear Physics. Moscow: Nauka, 1972. С. 55-56. ↩
Star Waves
If atoms are the basic elements of the Universe, then stars are the basic objects in which they are concentrated. Therefore, analyzing the regularities of the distribution of stars by their sizes is as important for us as analyzing the distribution by the sizes of atoms.
Unfortunately, in the most accessible reference books we could not find any tabular data on the statistics of the distribution of all types of stars by their sizes, similar to the distribution of atoms. We had to resort to an indirect, roundabout way, partly calculating their sizes by known astrophysical formulas.
The main CHALLENGE was that if the coordinate of the upper point of the SWS ridge (CLASS #9), corresponding to a size of \(10^{12}\) cm, is special for stars, then this coordinate point should show itself in the dependencies of the most important parameters of stars on their sizes.
Before proceeding to this elucidation, it is necessary to make some general remarks on the CHARACTER OF STAR EVOLUTION in the Metagalaxy.
Astrophysicists, analyzing the chemical composition of stars and the distribution of stars in different parts of our Galaxy, have found over time that stars can be fairly reliably divided into two types. “Although the chemical composition of most stars is almost identical, they do have slight differences. These do not affect the luminosity or color of the star very much but can be detected in the spectra. Almost all stars are composed mainly of hydrogen and helium: for example, most stars in our region of the Galaxy have only 1% of their mass made up of heavy elements, and very few stars have even smaller proportions of heavy elements, as low as 0.01%. Stars like the Sun are called stars rich in heavy elements; in our Galaxy, these stars belong to population I, while stars poor in heavy elements belong to population II1.
According to the famous astronomer V. Baade2, this division into two groups is not accidental but is associated with two epochs of star formation.
The first epoch of star formation took place simultaneously not only in the Local Group of galaxies but also everywhere in the Metagalaxy. It refers to the moment of the Metagalactic expansion (\(t_0 \sim 10^9\) years), when there was a rapid burst of star formation from the primary hydrogen-helium ball, apparently in the already formed protogalactic clouds. This was the very first generation of stars.
At present, due to the high lifetime of the first generation of stars, we have the opportunity to observe these patriarchs in the sky, although their number has noticeably thinned. It is these first-born stars of the Universe that are called type II stars because of the peculiarities of their distribution in our Galaxy – they are mainly located in spherical halos of galaxies and very often in globular clusters of halos (see Fig. 1.53).
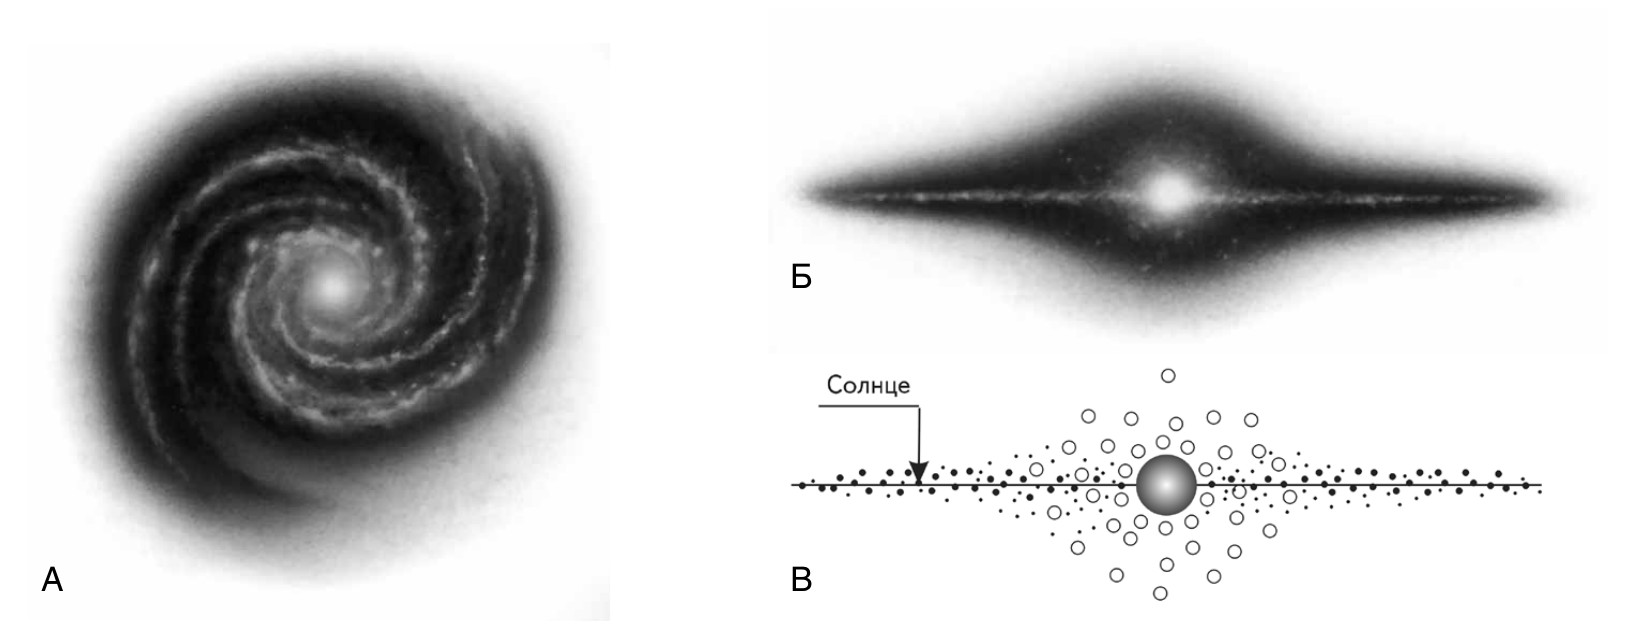 Fig. 1.53. View of our Galaxy from above (A) and from the side (B). In the center is a spherical halo, which includes stars of population type II (white circles in diagram C – the first generation of stars) and spiral arms consisting of stars of population type I (black dots – the second generation)
It is believed that the first epoch of star formation was followed by a second, longer epoch, during which stars of the galactic disk were formed in our Galaxy.
The second epoch, according to V. Baade, was less turbulent and probably lasted several billion years.
Now, according to S. A. Kaplan3, the third epoch is underway, which should cease in the Galaxy in \(10^8\)–\(10^9\) years, since at the present rate of star formation the reserves of the interstellar medium will not be sufficient for a longer time.
At present, sufficient observational data have been accumulated to show that the star formation process is not uniform. Epochs of rapid star formation are separated by periods of relative quiescence.
For our purposes, however, it is important to note that the very first stars began to appear at the time of the expansion of the Metagalaxy, when its size was about \(10^{27}\) cm (1 billion years).
It is obvious that the primary stars could consist only of hydrogen and helium, since the appearance of heavier elements, according to the generally accepted concept of the chemical evolution of matter in the Universe, could occur already during the evolution of the stars themselves.
Other stars, which are mainly concentrated not in the halo but in the Galaxy disk, appeared at the next stage. They differ significantly from the first stars by their location in the Galaxy itself, by their saturation with heavy elements, and by other parameters. These two types of stars are easily distinguished in astrophysics as two relatively independent classes. In the following, we will show this in more detail.
Now let us consider the peculiarities of interdependence of physical parameters of stars. Modern astronomy has methods for determining the main stellar characteristics: luminosity, surface temperature (color), radius, chemical composition, and mass.
An important question arises: are these characteristics independent? It turns out that they are not.
First of all, there is a functional dependence connecting the radius of a star, its bolometric (integral over the entire spectrum) luminosity and surface temperature. In addition, as early as at the beginning of our century, the Dane Hertzsprung and the American Ressel established the dependence between the luminosity of stars and their color on a large statistical material. A remarkable feature of the latter dependence was that the position of all the stars of the Universe on the diagram “Luminosity – spectral class, or color” (the Hertzsprung-Ressel diagram) turned out to be by no means disorderly or random (see Fig. 1.53A). The stars form certain sequences (see Fig. 1.53B), among which there is the most rich in stars – the GENERAL STAR LABEL (GS).
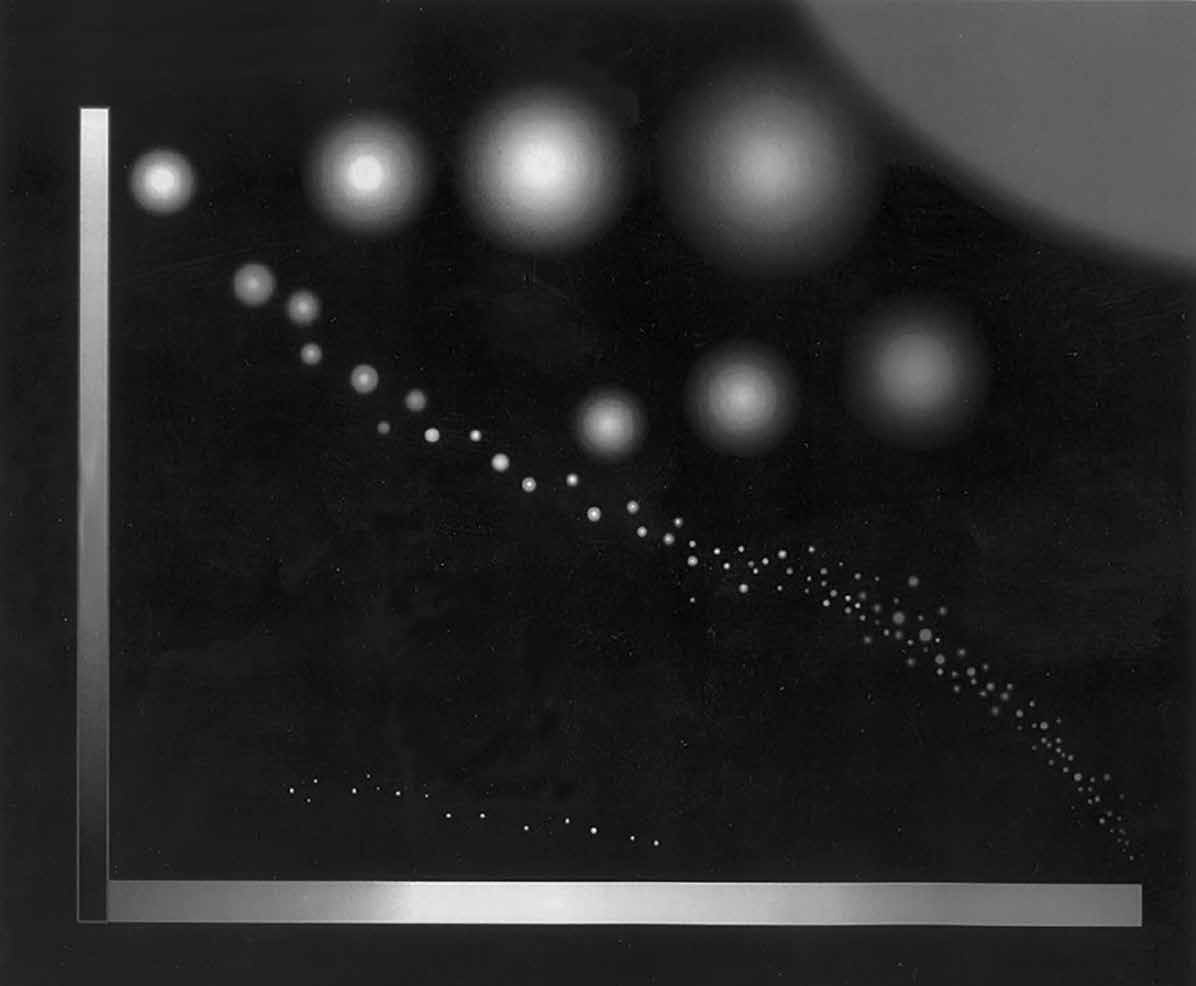 Fig. 1.54. Location of the stars of the Universe on the diagram “Absolute stellar magnitude – spectral class (color)”, which was discovered by Hertzsprung and Ressel
The star densification zones in diagrams of this type are often called branches and are depicted as lines along which the evolution of stars takes place.
The fact that practically all stars “choose” very narrow parametric zones in diagrams of this type testifies to the presence in the nature of stars (and hence in the bulk of matter) of stable parameter ratios that ensure their stable and long existence. Although the presence of such stable selected parameter zones is an interesting problem in itself, what is of interest to us are primarily the special sizes in this range of scales. Therefore, using the values of these parameters, let us calculate the sizes and construct similar diagrams for stars, but in slightly different coordinates. For this purpose, it will be convenient to construct the “spectral class - diameter” diagram (Sp-D), on which the interposition of the sequences of stars is rather accurately preserved. Typical sizes of population type I stars are taken from the reference*. For type II population stars, the sizes were determined from a known relation: \[ M_b = 42.31 - 5 \lg \left( \frac{R}{R_0} \right) - 10\ T_{\text{eff}}, \tag{1.9} \]
Where:
- \(M_b\) is the absolute bolometric stellar magnitude
- \(T_{\text{eff}}\) is the effective temperature of the star
- \(R\) is the radius of the star
- \(R_0\) is the radius of the Sun
The relation (1.9) can be rewritten for the diameter (\(D\)) of the star:
\[ \lg D = 19.62 - 0.2M_b - 2 \lg T_{\text{eff}} \tag{1.10} \]
The values of \(M_v\) and \(T_{\text{eff}}\) were taken from the reference book (See: Allen K. W. Astrophysical Magnitudes. M.: Mir, 1977) and after conversion by the formula:
\[ M_b = M_v + BC, \tag{1.11} \]
where:
- \(M_v\) is the absolute visual stellar magnitude
- \(BC\) is the bolometric correction
The dimensions for the population type II stars were obtained using formula (1.10).
All these data and calculation results are summarized in their final form in our Spectral Class–Diameter diagram (Sp–D). For convenience of comparison with other S-axis diagrams, this diagram is arranged not traditionally, but such that the dimension axis is horizontal (see Fig. 1.54).
Let us consider this somewhat unusual astrophysics diagram. Three bell-shaped functional dependencies are highlighted on it.
We emphasize once again that this diagram is unusual only in the choice and orientation of the coordinate axes, and the data for it do not differ from the data of the classical G-P diagram.
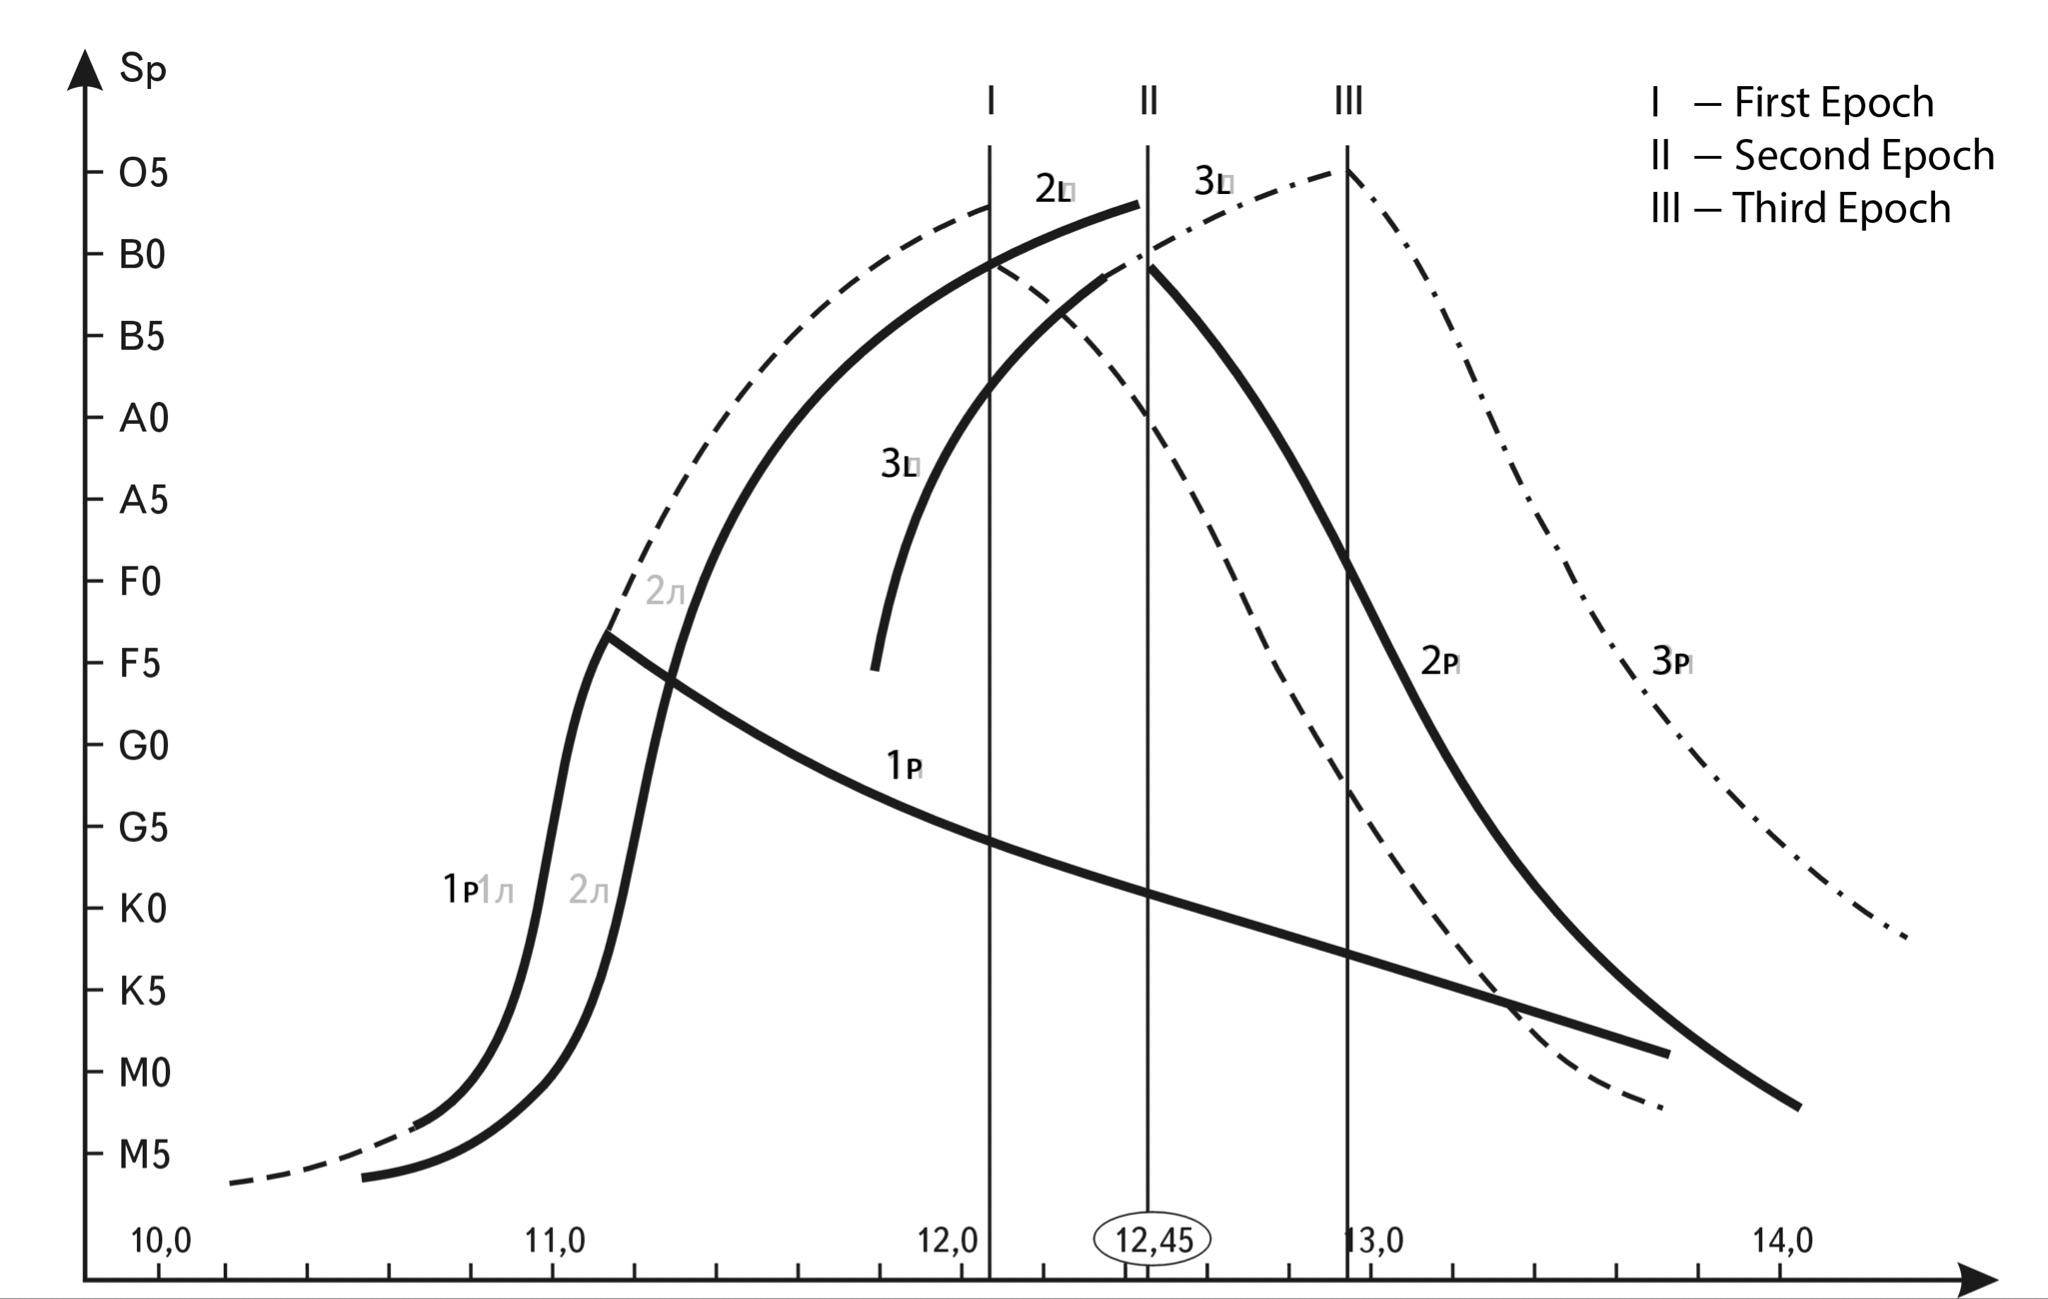
Fig. 1.55. Spectral class-diameter diagram, which was obtained by the author from the Hertzsprung-Ressel diagram by translating absolute stellar magnitude into stellar diameter. Thick lines - existing stellar sequences. Dashed lines - assumed sequences in the past (- - - ) and future (- . - . - . -)
Later we will explain why some of them are represented by dashed lines.
The average bell-shaped dependence consists of two branches: the “main sequence” - 2l (left) and the “supergiant branch” - 2p (right).
They are almost mirror symmetrical about a vertical axis that passes through the top of the bell and has a coordinate on the dimension axis equal to about 12.45.
Let us turn once again to the astrophysical ideas about stars. Recently, a consistent theory of stellar evolution has been created, in the framework of which each star describes different tracks on the Hertzsprung-Ressel diagram during its evolution (depending on the initial mass).
If the GENERAL LETTER (depicted by the line 2l in Fig. 1.55) is the main region of existence of most stars, then the supergiant branch (2p) is the subsequent stage of development of massive O and B class stars 4.
In this case, we can say that the branch of supergiants is the track of their development: due to their large mass, supergiants pass extremely quickly to the right, ending their journey at the bottom. They seem to “roll down from the top of the bell” to the right, expanding in size.
One of the peculiarities of the GENERAL sequence is that, on closer examination, it consists of parallel lines-sequences, each of which is populated by stars with a strictly fixed percentage of heavy elements (see Fig. 1.56).
The lower edge of the HEAT band is populated by stars with insignificant presence of heavy elements in the stars (the number of elements heavier than hydrogen Z = 0.01).
As one moves upward, the fraction of heavy elements increases, and at the right edge of the DIRECTIONAL FIGURE Z = 0.6.
Taking into account the fact that later stars are born in an environment richer in heavy elements, we can conclude that later stars are located higher (see Fig. 1.55) or to the right (see Fig. 1.54) than earlier ones.
Therefore, it can be stated that the main sequence is gradually “drifting” to the right, toward larger sizes (see Fig. 1.54). This allows us to take a new look at the branch of subdwarfs (1l) and the branch of red giants (1p) and make a number of PROPOSALS. Since the subdwarfs are very old stars, extremely poor in heavy elements, and their branch is noticeably shifted to the left of the main sequence branch and goes to its middle parallel to it, the following, not so groundless, assumption arises. The branch of subdwarfs is simply a remnant of the “primary main sequence”, as it was at the time of the Metagalactic expansion 1 billion years ago.
It was at this moment that the first burst of star formation occurred. This is convincingly confirmed by the studies of V. Baade: “The facts indicate that before the modern epoch of star formation, there was another epoch characterized by almost simultaneous appearance or formation of stars in galaxies “5.
The branch of red giants is, apparently, the right slope of the “primary main sequence”. Along it the stars of the first epoch of formation from the middle of the former GP complete their way.
All the hotter and brighter stars of the primary GP have completed their existence in a decade and a half. They simply disappeared from the diagram.
The author believes that if the primary charts could be restored, they would likely take the form of the same bell, but located to the left of the current one.
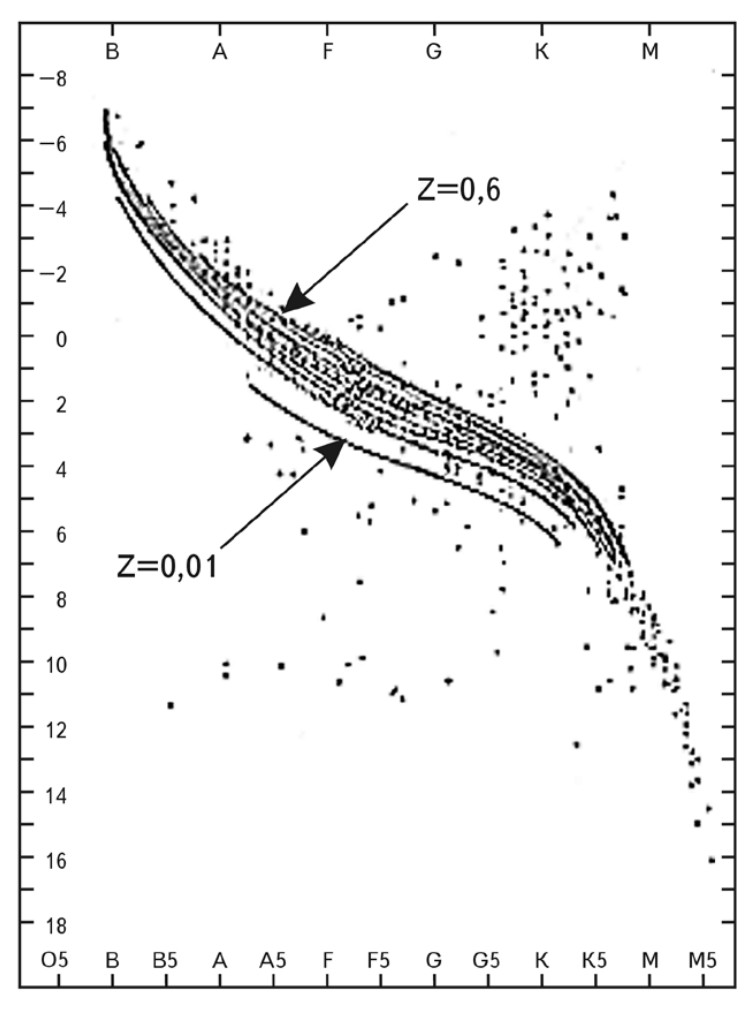 Fig. 1.56. This diagram clearly shows the “drift” of the GENERAL FOLLOW-up (GF) in the side of more brightness (and size) upwards as the transition from older stars (low heavy metal content) to newer stars proceeds
A simple geometrical restoration based on the principle of symmetry and similarity allows us to reconstruct the primary bell (dashed line), which we believe reflects the kind of diagram (I) that could be constructed immediately after the first epoch of star formation. The top of this bell would have an S-axis coordinate slightly larger than 12.0.
This idea of two domes, each of which belongs to a different epoch, agrees very well with the conclusion of V. Baade: “It would be interesting to find out whether we are really dealing with the superposition of two luminosity functions, which would mean the superposition of two mass spectra “6.
There is little left of this primary wave by now, it has settled and fallen off. In the same way, the present “bell” (II) is gradually “crumbling” with stars. Sooner or later it will lose its hot and bright top and settle down below.
If astrophysicists had lived during all 15 billion years together with stars and plotted the diagrams, they would have observed an elegant picture of rising and falling waves on the diagram (Sp -D). The wave would not just rise and fall but would follow the expanding Metagalaxy to the right.
By the way, purely visually it is very similar to an ocean wave. On the crest of this wave, the brightest and hottest stars shine to us, whose life, alas, is the shortest. True, it is necessary to note a fundamental difference in the images. Stellar waves have a discrete character, between the wave of the first epoch and the wave of the second epoch there is a gap of several billion years, so there is an empty parametric space between the branches of the diagram.
Let us summarize some results. Relying solely on a huge array of data on the parameters of many stars in the Universe, we have obtained a half-wave on the S-axis, the left edge of which (2l) rests on white dwarfs, and the right edge (2p) — on red giants inflated at the last stage of their existence. The center of this half-wave is the top of the bell-shaped dependence of the spectral class on the diameter of stars. Its modern coordinates are close to the value \(10^{12.45}\) cm.
If we accept a quite reasonable reconstruction, we can restore next to today’s half-wave the wave (1l–1p) that appeared in the first billion years of the Metagalactic expansion. When the size of the Metagalaxy was close to \(10^{27}\) cm, the top of the bell corresponded almost exactly to the coordinate — \(10^{12}\) cm on the S-axis.
We can speak at least about the BIMODAL DISTRIBUTION OF PARAMETRIC FUNCTIONS OF STARS.
And the first mode is associated with the simplest first-generation stars, or as astrophysicists call them - population type II stars - they consist primarily of hydrogen.
The second mode consists of second-generation stars, or type I population stars, saturated with heavy elements to a much greater extent.
TSWs, the analysis of the distribution functions of stars by their parameters has shown that stars can be divided into two types with sufficiently high reliability.
One type of stars, which appeared mainly in the first billions of years of the Metagalactic expansion, has smaller masses and almost no heavy elements in the composition of stars. In our Galaxy, such stars form its skeleton, the halo. The second type of stars, which appeared a few billion years later (their average age is about 5 billion years), are mostly located in the flat disk of the Galaxy.
-
Hodge P. Galaxies. M.: Nauka, 1992. С. 45. ↩
-
Baade W. Evolution of stars and galaxies. M.: Mir, 1966. ↩
-
Kaplan S. A. Interstellar medium and the origin of stars. M: Nauka, 1977. С. 60. ↩
-
Efremov Yu. N. Origin and Evolution of Galaxies and Stars. M.: Mir, 1976. С. 375. ↩
-
Baade W. Evolution of stars and galaxies. M.: Mir, 1966. С. 252. ↩
-
Baade W. Evolution of stars and galaxies. M.: Mir, 1966. С. 298. ↩
Galactic bimodality
Galaxies can also be divided into the two most common types: elliptical and spiral (see Fig. 1.8). According to many estimates1, these types of galaxies account for more than 70% of the total number of galaxies in the Universe. If we take into account that SO-type galaxies, which are a kind of intermediate class between spiral and elliptical galaxies, are the third most common, the other classes of galaxies account for no more than 15% of the total number of galaxies. What distinguishes the two main types of galaxies in the most general terms?
SHAPE AND STRUCTURE. Elliptical galaxies have a very simple shape and internal structure.
Elliptical galaxies, unlike the others, are structureless. Regarding the structure of elliptical galaxies, we can speak only in terms of the distribution of densities in them along the radius2
Spiral galaxies have a complex form of logarithmic spiral arms, disks, nucleus, core, and many other features of the structure. Moreover, every spiral galaxy has a halo, which is an elliptical formation of globular clusters of stars. Virtually every spiral galaxy has an inset, an elliptical inside it “galaxy” (see Fig. 1.52).
AGE. The age of most galaxies is estimated by astrophysicists to be about the same. They all formed at the very beginning of the expansion of the Universe, at the moment when it crossed the threshold of \(10^{27}\) cm.
At the same time in elliptical galaxies, star formation has practically stopped, they have no material — gas and dust — and they consist of old population II stars.
In spiral galaxies, old stars form a spherical “insert” — the halo — while dust and new stars are mainly distributed in the disk and spiral branches. In spiral galaxies, the process of star birth continues.
That is why we can say that elliptical galaxies (here we include elliptical components of spiral galaxies) are old systems of the first generation, and spiral galaxies (in terms of their specific structure) are young systems of the second epoch of star formation.
SIZES AND MASSES. The largest in size are spiral galaxies, the largest of them exceeding a diameter of \(10^{23}\) cm. The author was unable to find in the literature any mention of spiral galaxies with sizes smaller than \(10^{22}\) cm. On the other hand, all dwarf galaxies are elliptical, and for them the lower threshold is \(10^{20}\) cm.
In addition, according to statistical data 3, the mass range of spiral galaxies lies within \(10^9{-}10^{12}\) solar masses. For elliptical galaxies, however, this range is strongly shifted towards low masses: \(10^5{-}10^{12}\) solar masses. This indicates that spiral galaxies are on average larger and more massive, while elliptical galaxies are on average smaller and less massive.
ENTRY INTO CLUSTERS. Galaxy clusters include about 76% of elliptical galaxies and only less than 50% of spiral galaxies 4.
So, we see that the Universe is populated mainly by two types of galaxies. Elliptical galaxies are older, on average smaller in size, simpler in shape and structure, and they are part of the metagalactic cellular skeleton of clusters. Spiral galaxies are younger, the largest and most massive, and they are free from the structural skeleton of the Metagalaxy.
It is very important to note that there is a clear distinction between these two types in a multitude of parameters, which indicates their fundamental difference.
Based on these qualitative data, we can PROPOSE that elliptical galaxies belong to the first mode of the assumed bimodal size distribution of galaxies, while spiral galaxies belong to the second mode. And by analogy with atoms and stars, we can PROPOSE that there is a gap in the statistical distribution of galaxies by size between these modes.
-
Vorontsov-Vel’yaminov B.A. Essays on the Universe. Moscow: Nauka, 1969. ↩
-
Vorontsov-Vel’yaminov B.A. Essays on the Universe. Moscow: Nauka, 1969. С. 130. ↩
-
Vorontsov-Vel’yaminov B.A. Essays on the Universe. Moscow: Nauka, 1969. С. 114. ↩
-
Vorontsov-Vel’yaminov B.A. Essays on the Universe. Moscow: Nauka, 1969. С. 125. ↩
Epochs of structure formation of the Universe
TSWs, the analysis of statistical characteristics of the main structures of the Universe: atoms, stars and galaxies shows that at least two pronounced modes can be distinguished everywhere. And the first mode in all cases is formed by the objects of the first epoch of star formation. Since we are talking about the simultaneous formation of stars, galaxies, and atoms, we will use the term - FIRST EPOCH OF STRUCTURE FORMATION.
This epoch is revealed in many separate and special works devoted to the evolution of the Universe. It began, most likely, at the moment when the expansion of the Universe reached a size of about \(10^{27}\) cm, which occurred at time t0 ~ 1 billion years. This is when the first stars in the first elliptical galaxies formed, which most likely made up the primary cellular structure of the Metagalaxy. This is why elliptical galaxies mostly belong to galaxy clusters.
This first epoch of structure formation passed simultaneously through all scale floors of the Universe and generated its basic objects: elliptical galaxies, population type II stars, light atoms of the second period of the periodic system of elements of D. I. Mendeleev and, apparently, meta- and substructures, which, according to their sizes, are clearly distributed along the crests and troughs of our model SW.
This burst of structure formation was very powerful and relatively short-lived. After it, the Universe for the first time acquired its familiar to us appearance, but without much diversity of structures: there were no spiral galaxies, heavy chemical elements, molecular clouds, unusual stars, etc. There were representatives of all scale classes of the Universe, but shaped by a minimum of diversity. At this moment all statistical curves, if there was a statistical astrophysicist, would look very simple - unimodal.
Apparently, after this period, further expansion took place without a noticeable renewal of the structural composition of the Universe.
It is possible that the expansion has slowed down, which is understandable given that within our model the Metagalaxy has fallen into a resonant very stable large-scale state.
In any case, astrophysicists note a lull, which after about 5 billion years was replaced by a new, SECOND WAVE OF STRUCTURAL CONSTRUCTION, which produced objects several times larger in size and mass.
Perhaps this second era is over, perhaps it is ending, or perhaps it is still going on.
That said, it’s important to note:
- that it was the second epoch that gave rise to spiral structures in some elliptical galaxies, and predominantly in cluster-free galaxies;
- that it’s the one that gave birth to all the Type I stars;
- and it was the one that produced the bulk of heavy elements. All the listed objects in statistical distributions are grouped around the second mode.
These objects gave the Universe a diversity and a palette of new properties never seen before. By the way, it is possible that now we are experiencing not the remnants of the second epoch, but the beginning of the THIRD, the freshest Era of STRUCTURE-BREAKING, which generates the largest types of structures on all floors of the S-axis: heavy and superheavy elements, supermassive and very active galaxies, the newest stars.
As for the stars, there are some indications that the third epoch is separated from the second by a period of quiescence, and there is a gap between the stars of the second and third epochs in the diagrams. Once again we remember that the THIRD epoch of STRUCTURAL formation is distinguished, in particular, by the astronomer S. A. Kaplan. A. Kaplan. The basis for this is, apparently, a branch of bright giants (3L), separate from the main sequence and shifted towards larger sizes. It practically runs parallel to the main sequence in the Sp-D diagram.
We can assume that this is the main sequence of today’s star formation process. Then it will develop a continuation downward to the left, toward smaller stars, and to the right - a path for outdated stars, a roll toward red supergiants.
Extrapolation of this wave into the future allows us to find the upper point of the third, modern stellar bell. Its coordinate on the S-axis is approximately 12.9.
It is fundamentally important to note that all objects of the first epoch of structure formation are separated from each other on the S-axis by distances divisible by \(10^{5}\). These objects occupy the leftmost (first) modes in the bimodal distribution.
The location on the S-axis of the objects of the second epoch of structure formation is different. We refer to these objects in the second modes. The second modes of each class, as it can be tentatively PROPOSED, are shifted to the right relative to the first ones not by a constant value, but by some variable value of the shift, which increases as we move along the S-axis to the right from atoms to galaxies. What is the reason for this shift, we will try to explain it in the next section of this chapter.
Two S-waves of stability
Long-term reflections have led the author to the conclusion that characteristic (stable) sizes of the Universe cannot be explained on the basis of local interactions only. Many important sizes are determined by the boundary conditions of the scale range of the Universe. A possible physical interpretation of this conclusion will be given in the following sections, and here we will limit ourselves to its analysis within the framework of symmetry categories. Let us emphasize at the first stage the two most important dimensionless coefficients of the S-axis: \(10^5\) and \(10^{61}\).
The first coefficient is a phenomenological given, reliably manifested in the relationships of many different parameters on all scale floors. It is related to other Big Numbers, being the smallest common multiple for them: \(10^{10}\), \(10^{15}\), \(10^{20}\), \(10^{40}\). Let us call it the S - Symmetry Coefficient - SSC.
Its origin is considered in the work of the author together with N. P. Tretyakov “Arithmetic of the Universe”.
There are good reasons to believe that \(10^5\) is a previously unknown to science dimensionless constant of our world, no less important than the speed of light or the mass of a proton.
The second coefficient is the most reliably determined S - INTERVAL OF THE UNIVERSE (SIU), containing 61 orders on the scale of decimal logarithms: 28 - (-33) = 61.
Its more precise value depends on the true size (diameter) of the Universe, which is estimated in the range from (3.2…6.4) \(\cdot\) \(10^{28}\) cm, which gives a spread of 61.2…61.6. Rounding here its value to the minimum value of 61, we do not pretend to the final accuracy of the calculation, for it will be possible only when we obtain reliable data on the size of the Universe and on the rate of the interaction that determines the formation of the scale-hierarchical structure of the Universe.
Comparing two dimensionless quantities 5 and 61, we see that there is no integer relationship between them. If we postpone the MS basis coefficient starting from the left edge of the S-axis, it does not fit an integer number of times into the scaling interval of the Universe, with a residual of one order of magnitude.
However, if the Universe had dimensions of 1.6 \(\cdot\) \(10^{27}\) cm, then the total length of the S-interval of the Universe would be equal to 60 orders of magnitude, which is divisible by 5 orders of magnitude 12 times without remainder. It is very important to emphasize that such a situation in the model of the expanding Universe is quite physically real, it could have arisen at the moment of expansion when the Universe had an age of about one billion years. As astrophysicists are convinced, it was at that moment (at the moment of S-SYMMETRY) that a rapid process of structure formation took place on all floors of the Universe. We have shown above that all structures formed in this process have average sizes that are surprisingly precisely 5 orders of magnitude apart along the S-axis (nucleons, hydrogen,… old stars and elliptical galaxies).
In total, these main types of systems should have been formed in the Universe according to the SWS model - twelve, not counting the primary one - maximon, closing the S-band of the Universe from the left edge and taken by us as point zero.
Of course, at present we can confidently match the 13 nodes on the S-axis with only 6-8 real types of physical systems. However, the fact that in spite of gaps in the sequence, the sizes of the main representatives of the TWENTY-THREE CLASSES on the S-axis are obtained by translation of the base coefficient \(10^{5}\) quite accurately (sometimes - phenomenally accurately), allows us to put forward the following SCENARIO OF EVENTS DEVELOPMENT OF EVENTS IN THE UNIVERSE.
At the age of the Universe of one billion years, two parameters (\(10^{5}\) and \(10^{60}\)) created a special SCALE - RESONANCE situation (S-Resonance), which had no analogs in the subsequent expansion process. Probably, that is why on the S-axis the basic structural sizes of the main classes of the Universe objects are several orders of magnitude apart with the accuracy of the coefficient 1.6 in front of their values.
Further expansion of the Metagalaxy during the last 16 billion years led to the lengthening of the scale interval by only one order of magnitude. But this was sufficient for the mismatch of the large-scale resonance.
The number and nature of the main classes on the S-axis have not changed during this time: galaxies, stars, atoms and other objects have existed at least since the age of the Universe at 1 billion years. Since then, at least one new large-scale class of systems that occupies a strictly dedicated scale interval has not yet appeared. Consequently, the NUMBER OF CLASSES EQUAL to 12 is a of S-Axis Dimensionless Constant - (SADC)(we can accept another equivalent constant - 6 waves, which form 12 half-waves, taken by us as the basis for the separation of S-classes).
Note that the number 6 was not chosen by chance. The point is that 6 is the first complex even-even harmonic in the series of integers: 1, 2, 3, 4, 5… Because 1-2-3 = 6.
So, there are currently TWO MASSIVE INVARIANTS that have remained unchanged in the expanding Universe for at least the last approximately 10 billion years. The first is 5 orders of magnitude. The second is 12 classes, or half-waves.
The partitioning of the S-axis by these two invariants occurs according to different principles, - and this is fundamental for further considerations.
The first BASIS coefficient - \(10^{5}\) - as the whole phenomenology shows, is strictly exactly deferred from the left edge of the S - Interval (from point 0), breaking the whole S-axis into essential nodes alternating after 5 orders of magnitude.
The second coefficient splits the whole S - Interval of the Universe (SIU) exactly into 12 segments irrespective of its changing length. Naturally, at different moments of the Metagalactic expansion, the division of its S-interval into 12 parts leads to obtaining segments of different lengths. If we divide its present-day length of 61 orders of magnitude into 12 classes, we get a new dimensionless value of \(10^{5.083}\), which is not a constant but grows with the expansion of the Metagalaxy. Let us call it the S-Symmetry Evolutionary Coefficient (SSEC)
It would seem that obtaining a small correction after the decimal point at such scales is an insignificant trifle. However, thanks to this correction we can make one more fundamental step, namely, to pass from a simple partitioning to a wave partitioning. After all, from the formal point of view, the division of the changing interval into constant integer 6 waves (or 12 half-waves) is nothing else than a MODEL of a MASTER WAVE, whose length depends on the right changing scale boundary of the Metagalaxy.
In this case, it turns out that the S - Wave of stability has its “shadow” - the phase-shifted EVOLUTIONAL WAVE of stability (EWS), which fits into the scale range of the Universe an integer number of times (Fig. 1.57), being a large-scale standing wave.
Recall that, according to the theory of oscillations, any standing wave always fits within the boundaries of the medium in which it propagates an integer number of times.
The characteristic stable points on the S-axis for the Evolutionary Wave depend on the radius of the Universe.
As the Universe expands, the second sinusoid, unlike the first one, will stretch to the right like an accordion, and all stable points that it sets will shift to the right along the S-axis. This allows us to make the following important PROPOSITION. In the Universe, all characteristic, stable dimensions have a BIMODAL (most pronounced) distribution. The first modes are formed by translation (shift by 5 orders of magnitude) along the S-axis from the left extreme point (10-32.8 cm) of the coefficient \(10^{5}\). All characteristic sizes of the main types of systems are associated with them.
These dimensions (with a correction factor of 1.6) are shown in the Wave of stability graph we used in the previous sections.
The second mode in the distribution of objects by their size will always be located to the right of the first mode.
As shown by calculations, these modes are formed by translation along the S-axis of the MS Evolutionary Coefficient, which is currently equal to 5.083.
Consequently, a more complete model of the Stability Wave will look bifurcated, as depicted in Fig. 1.56. The SWS has its twin - a wave with some phase shift. If you examine the figure, you can see that the crests and troughs of the second wave (EWS) - as you move from point 0 - move away from the crests and troughs of the first wave EVOLUTIONAL WAVE of stability -EWS). At the rightmost point C, the TEW is in a state of maximum stability. So, we BELIEVE that if the first wave - SWS is formed due to the integrity of the initial coefficient \(10^{5}\), then the second wave - EWS owes its origin to the integrity of waves that fit into the scale interval exactly 6 times. In both cases, the integrity is preserved, although one kind of symmetry at this moment of the life of the Universe does not agree with the second. The value of mismatch for the whole interval of the Universe is equal to 1/61 or 1.64 %.
METHODOLOGICAL DEPARTURE
Let us make a small methodological digression and introduce some mathematical forms for describing the BASIS and EVOLUTIONAL scaling WAVES OF stability. They will be needed further for the convenience of calculation of characteristic points on the S-axis.
First, let us do it for the SWS, which has a stability period of \(10^{5}\). Let us assume, to a first approximation, that the SWS is a sinusoidal curve in which the argument is the logarithm of the system size - \(\lg L\). For simplicity of expression, we renormalize the value of the argument in such a way that the leftmost point of SW corresponds to the value of the argument equal to 0. For this purpose, we introduce the size in units of fundamental length - \(l_f\) . Then the size of the system in centimeters will be converted by the following formula into the size in units of fundamental length:
\[ \lg D = \lg L - \lg l_f \tag{1.12}\]
Accordingly, the fundamental length itself in fundamental length units will have a coordinate on the S-axis:
\[ \lg D_f = -32.8 - (-32.8) = 0 \]
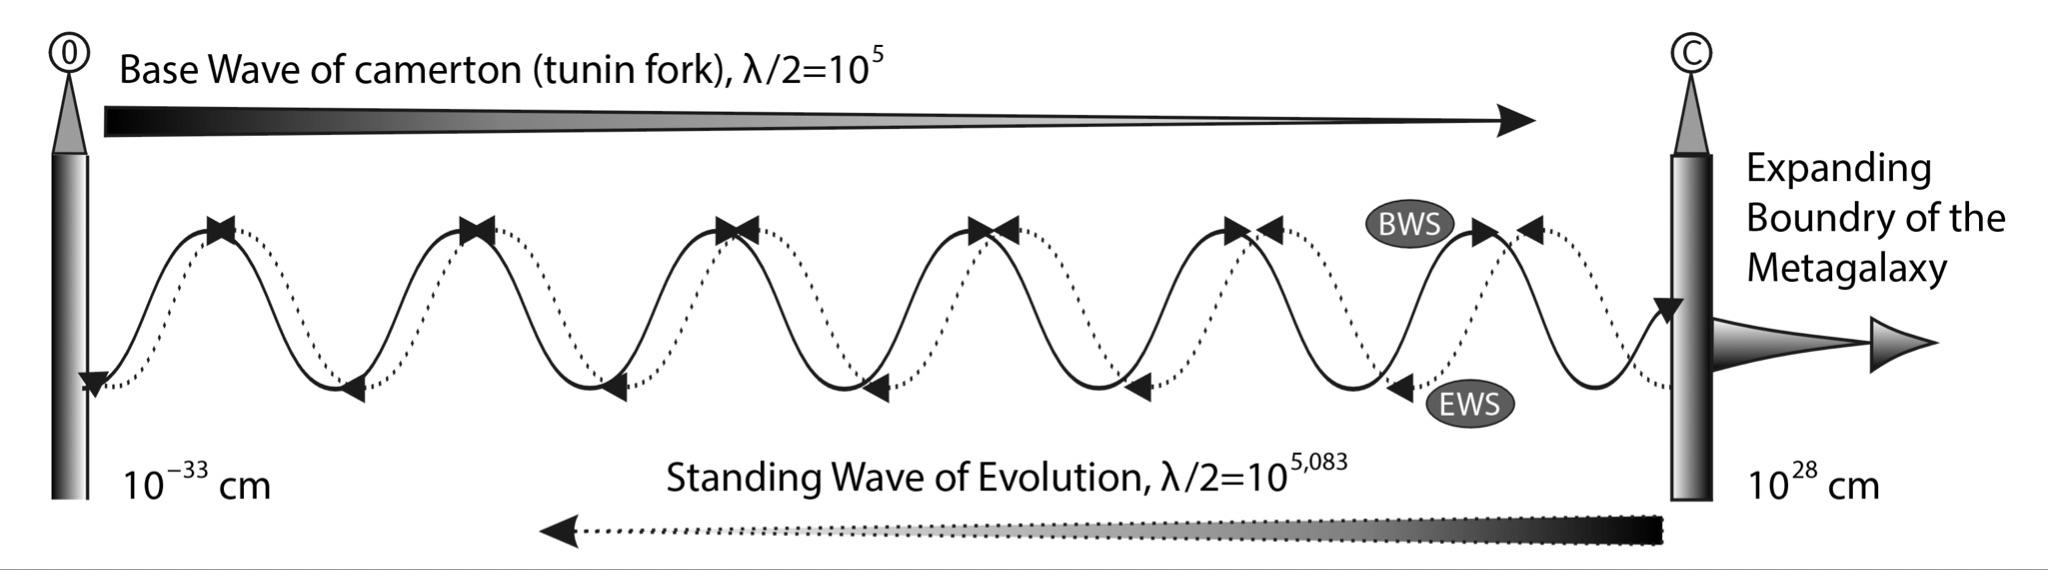 Fig. 1.57. Characteristic stable points on the S-axis (dimensions) for the second wave - ESW depend on the radius of the Universe. As the Universe expands, the second sinusoid, unlike the first one (HLE), will stretch like an accordion to the right, and all the stable points it defines will also shift along the S-axis to the right
Then, for example, the coordinate (dimensions in fundamental length units) of the average human height on the S-axis will look like this: \(\lg D\) = 2.2 - (- 32.8) = 35. This shows that the “size” of a person is exactly 35 orders of magnitude larger than the size of the fundamental length.
Now let us choose a function for modeling the SWS, let us take the cosine function. Let us denote by a unit the state of ultimate stability of the system in each of the seven potential stability holes on the SWS. Accordingly, in the places where the cosine crosses the X-axis, its values will be equal to zero. Let us assign to it the value of the limit unstable state of the system. The upper points of the function will respectively take the value “minus 1”, which will reflect their stable saddle equilibrium (see Fig. 1.58).
Recall that the stability vector in our SU model is directed downward, hence below the S-axis the function values are positive, and above the S-axis they are negative.
All these notions are very and very conventional since the concept of system stability itself has a complex and rather complicated meaning, which we will not discuss here. The introduction of these formalisms is necessary, first of all, to give the SWS a semblance of functional dependence and to be able to calculate the characteristic points on the S-axis using a formula rather than a ruler.
With the accepted notations, the SWS has the following functional form:
\[ F_0(L) = \cos\left(2\pi \cdot \frac{\lg D}{\lg 10^{10}}\right) = \cos(36° \cdot \lg D) \tag{1.13} \]
where \( F_0(L) \) is the basis scale stability function of the system, and \( 10^{10} \) is the dimensionless scale wavelength (meaning the length of the BASIS scale wavelength).
Calculation by formula (1.13) will allow us to find all the most characteristic dimensions and determine their rank by HLB.
Particular attention should be paid to the fact that at integer values: \( \lg D = N = 0, 1, 2, 3, 4, 5, 6… \), which characterize all points on the S-axis, going through the factor of increasing the size by a factor of 10 times, the function (1.13) takes values:
\[ F_0(L) = \cos(36° \cdot N) = 1, (0.809), (0.309), (-0.309), (-0.809), (-1), (-0.809),… \]
In the obtained series, in addition to the obvious, predetermined values 1 and -1, we find intermediate values of the function, which can be represented in another form:
\[ \pm 0.809 = \pm (0.5 \cdot 1.618), \] \[ \pm 0.309 = \pm (0.5 \cdot 0.618). \]
In the parentheses, we find two very important symmetry coefficients. One of them is the golden ratio (This fact was first brought to the author’s attention by V. Komarov) and the other is equal to \({1}/{2}\).
As will be shown in the next book of the cycle, these two symmetry coefficients are the basis for two different types of symmetry: similarity and equality.
Consequently, the function we obtained takes a multiple of the golden ratio at the point between the two stability limit states on the S-axis.
What is the connection between WU and the famous golden ratio, it is difficult to say yet, but it is impossible to pass by this coincidence.
The stability function for the evolutional standing wave (ESW) has the following form:
\[ F_Э(L) = \cos \left(2\pi - \frac{\lg D}{\lg 10^{10.167}} \right) = \cos \left(35.4^\circ \cdot \log D \right) \tag{1.14} \]
That is, it is shifted in phase toward increasing the period on the S-axis by 0.167 units.
In the following, we will use this formula to determine the coordinate of the second mode \(X_Э\) on the S-axis:
\[ X_Э = \frac{1}{12}(r_В + 32.8) \cdot K - 32.8 \tag{1.15} \]
Where:
- \(X_Э\) is the exponent (power of 10) of the coordinate on the S-axis,
- \(K\) is the class number on the ESW,
- \(r_В\) is the exponent of the Universe’s radius at the time of interest (in cm).
Example:
Let the radius of the Universe be \(10^{28.2}\) cm. Then \(r_В = 28.2\). For Class #7, we get:
\[ X_Э = \frac{1}{12}(28.2 + 32.8) \cdot 7 - 32.8 = (12 \cdot 7 - 32.8) = 35.58 - 32.8 = 2.78 \]
This gives a characteristic size of \(10^{2.78}\) cm, or approximately 5 meters.
That means:
If the SWman (standing wave human) height is located on the S-axis at the HLB node with a coordinate of 1.6 meters, then five-meter giants (if they ever existed on Earth) would correspond to the HLB node at 5 meters on the S-axis.
You can write another formula to calculate the value of evolutionary fashion:
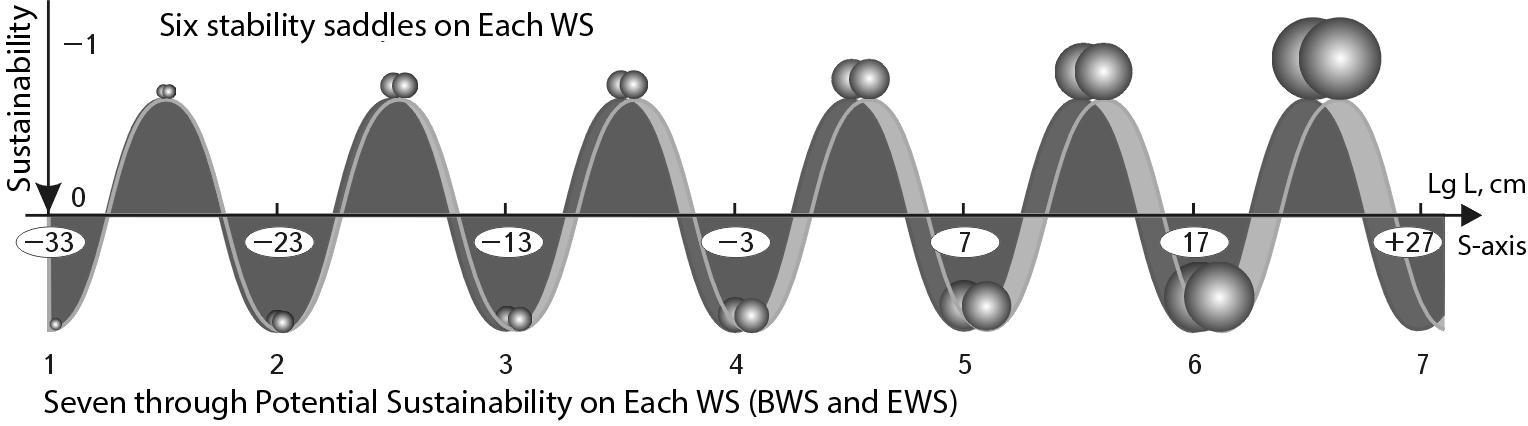 Fig. 1.58. Model of two Waves of stability. At the top, on the crests of the SWS and EWS, there are the ranges of maximum stability sizes for the objects of the structural series - peculiar “stability saddles”. At the bottom, in the seven troughs for SWS and EWS, there are zones of stable equilibrium for the objects of the nuclear series. The points of intersection of the EI with the S-axis are the points of maximum instability of objects
\[ L_K^{\mathbb{Э}} = l_f \left( \frac{R_B}{1_f} \right)^{K/12} \tag{1.16} \]
If we take the value \( R_B = 10^{27.2} \) cm, which corresponds to the scale-resonance state (approximately at the moment of its age of 1.6 billion years), then formula (1.16) will take the form that corresponds to the formula for calculating the basis first mode in the distribution on the SWS:
\[ L_K^{\acute{A}} = l_f \cdot 10^{5K} \tag{1.17} \]
We can verify the validity of the application of these modeling considerations by plotting the distribution diagrams of the main parameters of the main types of IS objects depending on their sizes, and then comparing the obtained mode values with the model values calculated based on two stability waves (see Fig. 1.57). Let us carry out such a comparison for the classes considered above.
NUCLEI OF ATOMS (CLASS #4). This is the first scale level from which we can rely on empirical data on the sizes of systems.
The first mode of the steady size according to SW is equal to
\[
1.6 \cdot 10^{-13} \text{ cm}
\]
(4 steps of 5 orders of magnitude from the point 0 – the fundamental length).
Let us repeat that the diameter of the most common particle in the Universe, the proton, has exactly this value.
The second stable size, determined based on the currently accepted size of the Universe of
\[
1.6 \cdot 10^{28} \text{ cm}
\]
according to the evolutionary formula (1.15), is equal to
\[
10^{-12.47} \text{ cm} \approx 3.4 \cdot 10^{-13} \text{ cm}
\]
The diameter of the second most common atomic nucleus in the Universe, the helium nucleus, is empirically determined from the geometry of its tetrahedral packing (see Figure 1.51).
It fits into a sphere with a diameter of
\[
2 \cdot 1.6 \cdot 10^{-13} = 3.2 \cdot 10^{-13} \text{ cm}
\]
Comparison of two values – model and empirical – shows a deviation of 6%. Taking into account the very approximate determination of the Universe radius at the present moment and as a consequence very approximate determination of the evolutionary coefficient of scale symmetry, the obtained result looks even too accurate.
We state that on the S-axis in the region of atomic nuclei on the basis of two SW the two most stable sizes are obtained: 1.6 and 3.4 fermi, which almost exactly correspond to the experimentally determined diameters of the two most stable nuclei and particles of the Universe (proton and α-particle).
However, this conclusion leads to a very serious contradiction with the whole cosmological theory. The matter is that the HW model is treated by us as a system of stable sizes allowed by nature.
At present, due to HLE, the stable existence of a nucleus with a size of about 3.4 fermi is allowed. If we go back in time, the value of the second stable point on the S-axis is less than 3.4 fermi.
This can be interpreted in such a way that before the age of the Universe of 10…12 billion years, helium could not be in a stable state. Simply put, it did not exist!
This contradiction can be partially removed if we PROPOSE that the tetrahedron of the helium nucleus has two stable dimensions:
the maximum is the diameter of the circumscribed sphere and the minimum is the height of the tetrahedron (see Fig. 1.52).
Calculation by formula (1.16) shows that at ESW the second mode reached the value of the minimum stable size, equal to 2.6 fermi for the α-particle, at an age of about 7 billion years.
Based on these models, we can reconstruct EVERYTHING that happened in the early universe.
Expanding to the right along the S-axis, the Metagalaxy has gradually shifted to the right all second modes of stable sizes since 1 billion years. For the first 7 billion years, this shift did not allow the helium nucleus to consolidate in a steady state.
However, after 7 billion years the shift reached the lower threshold of dimensional stability of the tetrahedral configuration of nucleons, which created preconditions for the continuous flow of hydrogen nuclei from the first mode of stability to the second one. The stormy process of the SECOND EPOCH of STRUCTURE-BREAKING began, in which the most favorable matrix-scale conditions were created for helium nuclei, which gave a start to the beginning of the mass synthesis of helium in the depths of stars. Since 7 billion years, these nuclei began to fall into stable spatial cells with sizes greater than 2.6 fermi and could be preserved in them for quite a long time.
Perhaps, it is these modeling considerations that lead to the explanation of the quiescence between the first and the second epochs of structure formation in the Universe.
Calculations with the SWS model show that the size range from the minimum size of the α-particle to the maximum second mode has passed in about 8–10 billion years of the Metagalactic expansion.
At present, the maximum size of the helium nucleus (\(3.2 \cdot 10^{-13} \text{ cm}\)) is slightly smaller than the value of the second mode of stability (\(3.4 \cdot 10^{-13} \text{ cm}\)) calculated by the formula (1.16).
ATOMS (CLASS #5). Once again, we recall that the calculated value for the first mode by SWS is \(1.6 \cdot 10^{-8} \text{ cm}\). The diameter of the hydrogen atom, according to the reference data, is \(1.4 \cdot 10^{-8} \text{ cm}\). The deviation is 13%, which is not so much if we take into account that the radius of the atom is empirically determined through the radius of the radial density maximum in the charge distribution of the neutral hydrogen atom. Clearly, beyond this radius extends some more space directly related to the hydrogen atom. It may extend just up to a diameter of \(1.6 \cdot 10^{-8} \text{ cm}\).
The evolutionary mode for the size distribution of atoms at a Metagalactic diameter of \(1.6 \cdot 10^{28} \text{ cm}\)
calculated by the formula (1.16), is \(4.1 \cdot 10^{-8} \text{ cm}
\). We see (see Fig. 1.50) that the most significant mode in the size distribution of atoms (actual data) is noticeably smaller than \(\sim 3.0 \cdot 10^{-8} \text{ cm}\).
Several explanations are possible here.
First. Since the electron cloud does not have the same rigid structure as the nucleon droplets of nuclei, it can be secondarily affected by the nuclear characteristic sizes. They give rise in this case through the basis scale factor (\(10^5\)) of their twins:
1.6 and 2.4–3.6 angstroms (Fig. 1.59). The second range corresponds exactly to the width of the second model on the curve of the statistical distribution of atoms by size (see Fig. 1.49).
Second. It is possible that the size of the Metagalaxy is simply somewhat smaller, e.g. \(10^{28}\) cm. In this case, the evolutionary coefficient of scale symmetry will also be smaller. Consequently, the theoretical calculation will give a value closer to the real one.
Third. The second mode could have been generated by the second epoch of structure formation, which lasted from the age of 7 to 15 billion years. If we take the size of the Metagalaxy equal to \(7 \cdot 10^{27} \text{cm}\), then, using formula (1.16), we can obtain the coordinates of the second mode: \(10^{-7.53}\text{cm} = 2.9 \cdot 10^{-8} \text{cm}\), which is quite consistent with the value of the second mode in the distribution of chemical elements along the S-axis.
The model shows that the synthesis of atoms from the second mode mainly occurred during the second epoch of structure formation, and this is quite consistent with the astrophysical ideas about this process. Of course, this does not mean that the model imposes a ban on the synthesis of elements of this size class at the present time. It only means that the most rapid process of their formation coincided with the resonance state of the second epoch. The atoms of the second mode were preserved as a trace of this process. Now, probably, favorable is the SYNTHESIS OF THIRD MODE ELEMENTS, with the average diameter of atoms more than 4 angstroms, which corresponds to the weakly expressed third mode. Of course, we do not aim here to create a complete model of large-scale conditions for the process of synthesis of chemical elements during the expansion of the Universe. As we will show below, for more accurate calculation of all fine spectra of characteristic sizes it is not enough to involve simple logic of symmetry laws. Here it is necessary to apply in all its power the METHOD OF HARMONIC ANALYSIS. Only in this case it is possible to obtain a sufficiently accurate agreement with the available experimental data. But at the first stage, it is important to show the NEUTRALIZABILITY of the approach. After all, it is obvious that the statistical curve of atom size distribution clearly shows 2-3 modes, which are logically linked to 2-3 epochs of structure formation by means of simple translation along the S-axis of scale symmetry coefficients. Let us now evaluate to what extent the two-wave stability model allows us to obtain characteristic dimensions for stellar statistics. STARS. Since most modern stars are about 10 billion years old, they appeared around the second epoch of star formation and on average at the time of the expansion of the Metagalaxy, when it was about 7 billion years old. At that moment its dimensions were equal to 7 \(\cdot\) \(10^{27}\) cm = \(10^{27.85}\) cm. Let us determine by formula (1.16) the coordinates of the second mode for stars. They are equal to \(10^{12.69}\) cm.
Fig. 1.59. Conditional scheme of atom size distribution.
The values of the three modes (1.6; 2.6; 3.55 angstroms) can be obtained by relying on the dimensions of the proton and the helium nucleus (at the two extremes) by multiplying these dimensions by the constant \(10^{5}\).
Consequently, the characteristic size for stars of the second epoch of star formation has a degree index of 12.69. Observational data give a slightly smaller size of 12.45 (see Fig. 1.54), which corresponds to an age of the Universe of 3.4 billion years. For an age of 5 billion years, the coordinate on the S-axis would be 12.58. However, given the very approximate and averaged determination of the size of the Metagalaxy at the time when it was passing through the second epoch of violent star formation, the figures obtained by calculating the characteristic points of the SW can be considered satisfactory. It remains only to determine the characteristic size for the hypothetical third bell in the diagram (Sp-D), the bell that is populated by stars of the third epoch of star formation, the epoch that is going on now.
We determined the scale translation factor for the present-day size of the Metagalaxy earlier, it is equal to 5.083. The characteristic size for the stellar half-wave will be 12.95. The restoration of the third bell (see Fig. 1.54) shows that the sequence of bright giants is apparently an unfinished branch of the main sequence of the third epoch of star formation, which is in progress now. The coordinates of its top (12.9) are very close to the value obtained in our model. We can also predict the appearance of a branch of “new supergiants”, which is probably represented only by very rare stars.
Now let us compare the first mode on the graph of atom size distribution with the first mode on the star diagram (Sp-D). We obtain that they are exactly 20 orders of magnitude apart: \(10^{12}\) cm : \(10^{-8}\) cm = \(10^{20}\) = (\(10^5\))^4, and to the nearest coefficient. The second stellar mode also correlates with the second atomic mode, only through a different coefficient - (\(10^{5.058}\))^4.
Concluding this section, we can state that the calculations using the two GPs of characteristic sizes on the S-axis for the stellar systems of the Metagalaxy do not contradict the available observational data, are logically consistent with them, and are confirmed in the main conclusions. Since our calculations use both free parameters and parameters not determined with sufficient accuracy, their correspondence to the actual data is certainly very approximate. But the logic of these calculations and the nature of the shift of the second mode as the class increases on the SW model are consistent.
So, our PROPOSAL about the role of integer symmetric divisions of the S-axis finds its very convincing confirmation. On the S-axis interval, as a space closed (by phase transitions) from both sides, with a length of 61 orders, exactly 12 times half-waves (or 6 times waves) of stability are arranged, generating a spectrum of stable dimensions every 5.083 orders, starting from any point (right or left). On the same S-axis we also find characteristic dimensions generated by another integer quantity, \(10^{5}\). It generates every 5 orders of magnitude its stable and characteristic dimensions, but they start from the left, and by the end of the interval there is a “tail” of one order on the right.
This “tail” at first sight spoils the whole integer symmetry. However, we remind that at the moment of the Universe expansion, when it reached the size of 1.6 \(\cdot\) \(10^{27}\) cm, the basis coefficient was exactly 12 times within the length of the whole S-interval, and there was no “tail”. It was in this scale-resonance period that the first turbulent epoch of structure formation took place.
If we now depict the two stability waves side by side, we get a new picture of the MASTER HARMONY. We see a split spectrum of characteristic sizes along the whole S-interval. Consequently, any basic characteristic size in the Universe has another larger size standing next to it like a shadow. THUs, although the modes are very close, the sources of their stability are at opposite edges of the S-Interval of the Universe. The first mode is generated by the HLB, which “chamber tone” sounds from the left edge of the S-interval. The second mode is generated by the HEV, which is reflected from the right edge of the S-interval and forms a standing scale wave. THUs, very different, extremely different systems always “live” side by side in each of the classes, like INH and YAN.
Of course, if our model is correct, there can be no exceptions to this rule for any class of systems. We can speak in this case about GLOBAL BIMODALITY (multimodality) in the distribution of all kinds of systems of the Universe, which is determined by the harmonic interaction of the two main stability waves.
To test this assumption, we have chosen a level intermediate between the atomic and stellar levels - the scale level \(10^4\)-\(10^{10}\) cm. This choice is because in this size range one can find sufficiently representative information on some types of systems with stable sizes for a long time, and the number of which on the Earth, due to their scale, is small, which allows us to make a complete statistical sampling.
Peculiarities of global distribution of geological and social structures by their size
The ideal object for such a study is blocks of the Earth’s crust and all the structures associated with them. The blocks were most likely formed at the time of the Earth’s crust’s origin, about 5 billion years ago.
During this period, the size of the Metagalaxy could have been about \(10^{28}\) cm (15 - 5 = 10 billion years). Calculation by the Double Wave Stability model using formulas 1.16 and 1.17 gives the following predictions regarding the statistics of the size distribution of these blocks (CLASS #8):
\[ L_B = l \cdot 10^{5K} = 1.6 \times 10^{-33}\text{ cm} \times 10^{5 \times 8} = 1.6 \times 10^7\text{ cm} = 10^{7.2}\text{ cm}\] or 160 kilometers.
\[ L_E = l \cdot \left(\frac{R}{L}\right)^{\frac{K}{12}} = 1.6 \times 10^{-33}\text{ cm} \times \left(\frac{10^{28}}{10^{32.8}}\right)^{\frac{8}{12}} = 5.4 \times 10^7\text{ cm}\] or 540 kilometers.
The issue of identifying statistically significant selected sizes of crustal blocks was addressed in the 1980s by a team led by the director of the Institute of Earth Physics, M.A. Sadovsky. In this size range, the scientists found1 that blocks with sizes of 120 and 500 km are the most common. Taking into account all probable errors, the coincidence of our model values with statistical data is very high. Let us further consider the following chain of logical reasoning. If the crustal blocks gravitate to bimodal distribution, and since they determine the boundaries of geographic regions, they, in turn, should reveal the predicted bimodality when processing the statistical array. Geographical boundaries, in turn, are determined by climatic, soil, and vegetation differentiation of the Earth’s surface. As established2, socio-economic territories are also tied to landscape-geographic arrays. Consequently, the distribution of countries and their internal structures (states, provinces, etc.) by size should show the same bimodality.
Let us make a logical PROPOSITION that in the process of formation of social territories, the block structure of the Earth’s crust plays a significant role at all scales, both in the static formation of ethnic groups through landscape specifics (soils, vegetation, etc.) and in the dynamics of settlement of peoples to natural barriers (mountain ranges, rivers, deserts, etc.). In other words, lithospheric fragments, as a matrix, give rise to the geographical structure, and the latter, in turn, gives rise to the socio-economic one.
The data on the distribution of countries and their regions by size were statistically processed by the author in his time and obtained quite remarkable results3.
To simplify the calculations, the notional size of any region was defined as the square root of its area.
They confirmed the predictive power of the law of bimodality in the distribution of all scaled systems.
Let us consider how social structures are distributed on the S-axis (see Fig. 1.60 and Table 1.3).
Curve No. 1 shows the statistical distribution of all countries of the world by size.
The distribution is clearly multimodal, with a step of 0.5 orders of magnitude on the S-axis. By the way, in M.A. Sadovsky’s data, one can also detect an average step of 0.5 order for the crustal blocks.
Calculations of conditional sizes from areas showed the following. The most representative modes are 130 km (30 countries) and 450 km (58 countries) (see Table 1.3). Another significant mode, 15 km (24 countries) is represented by dwarf and island states. We see that most of the countries of the world gravitate in one way or another to the sizes of the crustal blocks, or the two most stable sizes on the S-axis in the CLASS #8 we have chosen for consideration. Incidentally, the closest to the exact cosmological size (162 km) is the notional size of the UK. Curve #2 shows the statistical distribution of the regions of the former USSR. In fact, all internal regional distribution in the USSR has a bimodal character.
The first mode is 180 km (65 areas) and the second mode is 420 km (37 areas).
Curve No. 3 shows the generalized distribution by size of internal regions of large countries of the world: USA, Brazil, India - states, China - provinces.
Table 1.3 shows that the same two modes are distinguished in each country, with the second mode - about 450 km - being the most significant. The total number of regions in the first mode - 150 km is equal to 17, and the second mode - 450 km is represented by 73 regions.
So, all countries of the world and their hinterland regions are characterized by a bimodal size distribution.
The first mode: 120-180 km coincides with the calculated value of the SWS stability size FOR CLASS #8-160 km.
The second mode: 420-450 km is close to the calculated value of EVOLUTIONAL WAVE of stability -EWS - 540 km.
Both modes are related to the sizes of the Earth crust blocks and their natural boundaries. But it is not so much important for us as the fact that the model calculation of stable sizes, which was based on the factors of the integral scale symmetry of the Universe, seemingly far from geological and social processes, leads to surprisingly accurate (for such an interval of scales) predictions.
One more conclusion cannot be passed by. For all countries of the world and for their internal regional areas, the second evolutionary mode - 450 km - clearly dominates in the statistical distribution by size.
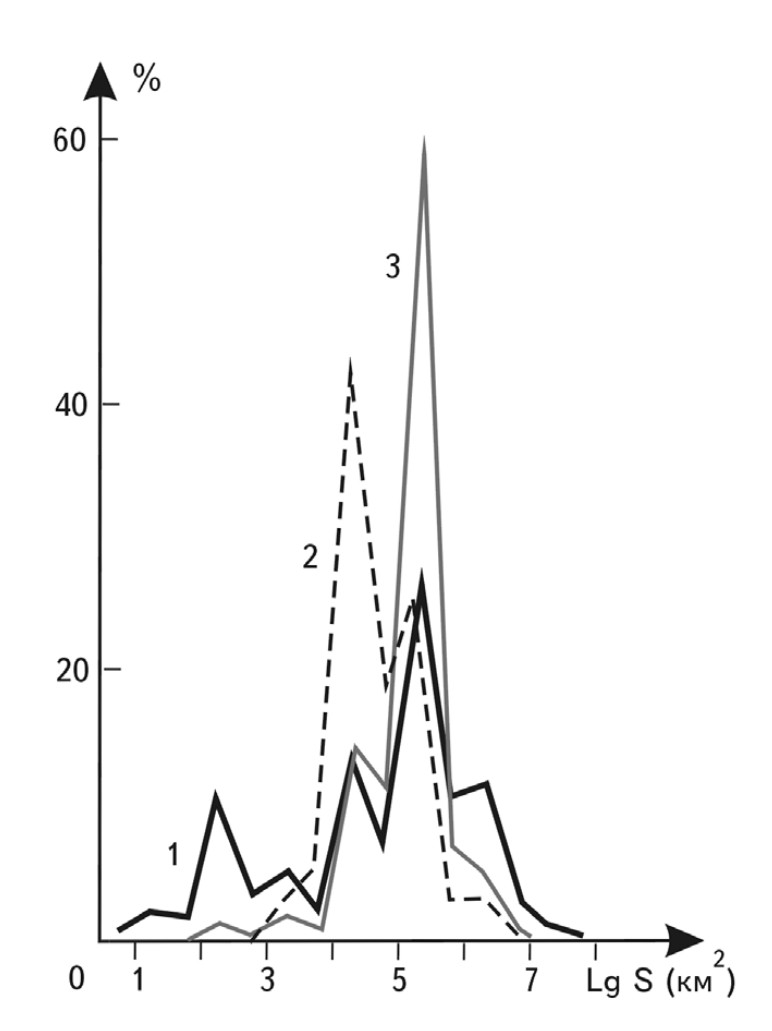 Fig. 1.60. Distribution of social territories by size (S - area). 1. - countries of the world; 2. - regions of the Russia; 3. - states of the USA, regions of China, India, Brazil
For all… except Russia. The only country in which the regional distribution has as dominant the first basic mode - 180 km, was the USSR (now - Russia). What does this undoubted statistical fact of our socio-cultural reality testify to?
First, Russia (USSR) is fundamentally different from the rest of the world in its internal geographical and socio-territorial structure.
TABLE 1.3.
| № | Region | \(1_l\) | \(1_d\) | \(2_l\) | \(2_d\) | \(3_l\) | \(3_d\) | \(4_l\) | \(4_d\) | \(5_l\) | \(5_d\) | \(6_l\) | \(6_d\) | \(7_l\) | \(\bar{X}\) | \(M_0\) | \(\sigma\) | \(V,\%\) | \(\gamma_1\) | \(\gamma_2\) |
|---|---|---|---|---|---|---|---|---|---|---|---|---|---|---|---|---|---|---|---|---|
| 1 | Europe | - | 1 | 4 | - | 2 | - | 5 | 5 | 16 | 1 | - | - | - | ||||||
| 2 | Asia | 1 | - | 1 | 1 | - | 3 | 6 | 4 | 15 | 7 | 5 | 1 | 1* | ||||||
| 3 | America | - | 1 | 11 | 3 | 3 | 1 | 7 | 3 | 9 | 1 | 6 | 3 | - | ||||||
| 4 | Africa | - | - | 2 | - | 3 | - | 8 | 3 | 16 | 11 | 12 | - | - | ||||||
| 5 | Australia and Oceania | 4 | - | 6 | 3 | 3 | - | 4 | - | 2 | - | - | 1 | - | ||||||
| 6 | General Nos. 1-5 | 5 | 2 | 24 | 7 | 11 | 4 | 30 | 15 | 58 | 20 | 23 | 5 | 1 | 4.52 | 5.30 | 1.50 | 33 | 0.80 | -0.16 |
| 7 | Regions of the Russia | - | - | - | - | 5 | 6 | 41 | 2 | 2 | - | - | - | - | ||||||
| 8 | “Oblast” units. | - | - | - | - | 5 | 7 | 65 | 28 | 37 | 3 | 5 | - | - | 4.76 | 4.64 | 0.57 | 12 | -0.45 | 0.49 |
| 9 | United States (states) | - | - | 1 | - | 2 | - | 6 | 5 | 33 | 1 | 1 | - | - | 4.88 | 5.24 | 0.63 | 13 | 1.88 | 5.10 |
| 10 | China | - | - | - | - | - | 1 | 1 | 2 | 19 | 4 | 2 | - | - | 5.34 | 5.28 | 0.47 | 9 | 0.99 | 2.60 |
| 11 | India | - | - | - | - | - | - | 6 | 2 | 11 | - | - | - | - | 4.42 | 5.23 | 1.13 | 26 | 1.10 | 0.14 |
| 12 | Brazil | - | - | - | - | 1 | 1 | 4 | 4 | 10 | 3 | 3 | - | - | 4.99 | 5.23 | 1.00 | 20 | 1.80 | 3.90 |
| 13 | General No. 9-12 | - | - | 1 | - | 3 | 2 | 17 | 13 | 73 | 8 | 6 | - | - | 4.95 | 5.24 | 0.86 | 17 | 1.92 | 4.47 |
| 14 | General #8-12 | - | - | 1 | - | 8 | 9 | 82 | 41 | 110 | 11 | 11 | - | - | 4.90 | - | 0.75 | 15 | 0.98 | 3.49 |
| 15 | General No. 6, 14 | 5 | 2 | 25 | 7 | 19 | 13 | 112 | 56 | 168 | 31 | 34 | 5 | 1 | 4.76 | - | 0.75 | 24 | 1.23 | 2.02 |
Notes:
\[S_{N_i} = \begin{cases}(1 - 5) \cdot 10^n, & i = l; \ (5 - 10) \cdot 10^n, & i = d\end{cases}\]
The asterisk marks the value for the territory of the USSR
Secondly, since the first fashion is connected with all ancient and most simple, but fundamental structures of the Universe, we can PROPOSE that the scale-resonance space of Russia is tuned to a different frequency than the space of the rest of the world. It is tuned to the frequency of preservation of the basic properties of the social space, or to the frequency of Yin.
We see that the comparison of a simple analysis of the statistical distribution of world regions by their size gives very deep grounds for thinking about the connection between geopolitics and the processes of structure formation in the Universe. Here only the edge of this large and fruitful topic is touched upon.
-
Sadovsky M. A., Bolkhovitinov L. G., Pisarenko V. F. Deformation of geophysical medium and seismic process. Moscow: Nauka, 1986. С. 100. ↩
-
Razumovsky V. M. In Vn.: Socio-economic and ecological aspects of geography. L.: LSU, 1983. С. 17-28. ↩
-
Sukhonos S. I. On the possibility of the influence of the Earth’s crust blockiness on the peculiarities of the size distribution of social territories // DAN. -1988. 303. № 5. С. 1093-1096. ↩
Results
The above analysis shows that the phenomenon of bimodal (in more precise consideration - multimodal) distribution of systems by their sizes has a universal character. This opens up incredible opportunities for rethinking the multitude of statistical distribution curves in all fields of science. After all, since the main modes of the overwhelming majority of systems (atoms, stars, etc.) have a clear connection to two waves of stability, all possible varieties of systems of the Universe must be somehow connected in their diversity with these waves.
We PROPOSE that the regularities of distribution of any systems by their sizes should reflect the presence of two or three epochs of structure formation. This is a kind of a CONNECTED MASSWIDE RESONANCE MAP.
The discovery of this pattern leads to the need to consider three corollaries of it.
First, there is no doubt that both the revealed coefficients and the patterns of scale symmetry and stability have a common physical cause, presumably - some UNIVERSAL MASCALE INTERACTION.
To understand what it is, is to understand the reason for the appearance of the detected scale symmetry.
Second, even if we do not go into the physical meaning of this phenomenon, remaining within the symmetry categories, it becomes clear that the presence of two neighboring stability waves cannot but lead to their very complex interaction (in particular, to the interference of two “large-scale radiations”), which should generate a whole cascade of consequences.
Third, the gradual “sliding” of the evolutionary EWS to the right of the basic SWS sets a certain SUSTAINABLE ACTING VECTOR OF EVOLUTION IN THE direction of SYSTEMS WITH LARGER SIZE. We can say that the Universal evolution has on the S-axis a chosen direction, a kind of MASSIVE VECTOR. In this the local in time scale asymmetry manifests itself. Further, we will consider all these consequences.
S-dynamics of the Universe
So far we have considered a static picture of the scale symmetry of the Universe, deliberately avoiding, as far as possible, examples of dynamic symmetry. This technique was necessary for us in order for the reader to form some image of the CARCASE OF THE MASSIVE SPACE OF THE UNIVERSE so that the mentioning of any dimensions automatically evokes associations with the world of specific universal systems and their scale classes.
However, the mosaic composed of pieces of empirical facts has its own dynamic life and obeys the laws of symmetry of motion along the S-axis. Therefore, we will pass from STATICS to DYNAMICS of the large-scale structure of the Universe. And here no less, if not more, mysterious and surprising regularities are waiting for us.
Preceding the conclusions of this part, we note that the dynamics of object motion along the S-axis can best be described based on the image of the hilly “surface” of the Stability Wave. We will show that there are often processes in which objects seem to strive to roll down its slopes to the lowest points. Recall that this process is accompanied by a very significant increase (or decrease) in the size of these objects.
To make it easier for the reader to navigate in the sea of new facts, we recommend keeping before you (mentally or actually) a picture of the SW (see Fig. 1.7) and imagine yourself sliding on a sled (or skis) of large-scale movement, when the movement up the slopes of the SW requires energy expenditure, and the movement down occurs “with a breeze”, i.e. the energy is released. At the same time, both on the slope and especially at the top, you can get a foothold and look around. So, let’s go on our amazing walk along the slopes of SW.
Let us start with a few vivid and figurative examples on the STAR MASTER DIAPASON (see Fig. 2.1).
All stars sooner or later end their active life. The process is different for stars of different masses. PLANETARY NEBULAE. According to modern astrophysical ideas 1, planetary nebulae form at the final stage of development of red giants, when they shed their outer shell. It turns into a planetary nebula, and the remaining core gradually turns into a white dwarf, the minimum size of white dwarfs is \(10^{8}\) cm. The radius of detachment of the shell is about \(10^{13}\) cm, and its maximum size after expansion reaches \(10^{18}\) cm.
Planetary nebulae in the Galaxy are quite numerous, they are even considered the main suppliers of cosmic dust. So the process of their formation from red giants has been repeated many times in the Universe and is statistically significant. Now let us pay attention to the fact that on the S-axis this process goes symmetrically in both directions: in the direction of size increase - from 13th order to 18th order there is a shift by 5 (!) orders of magnitude; and in the direction of decrease - from 13th order to 8th order there is a decrease by 5 orders of magnitude (see Fig. 2.1). The distance between the two “shards” of the red giant on the S-axis reaches 10 orders of magnitude.
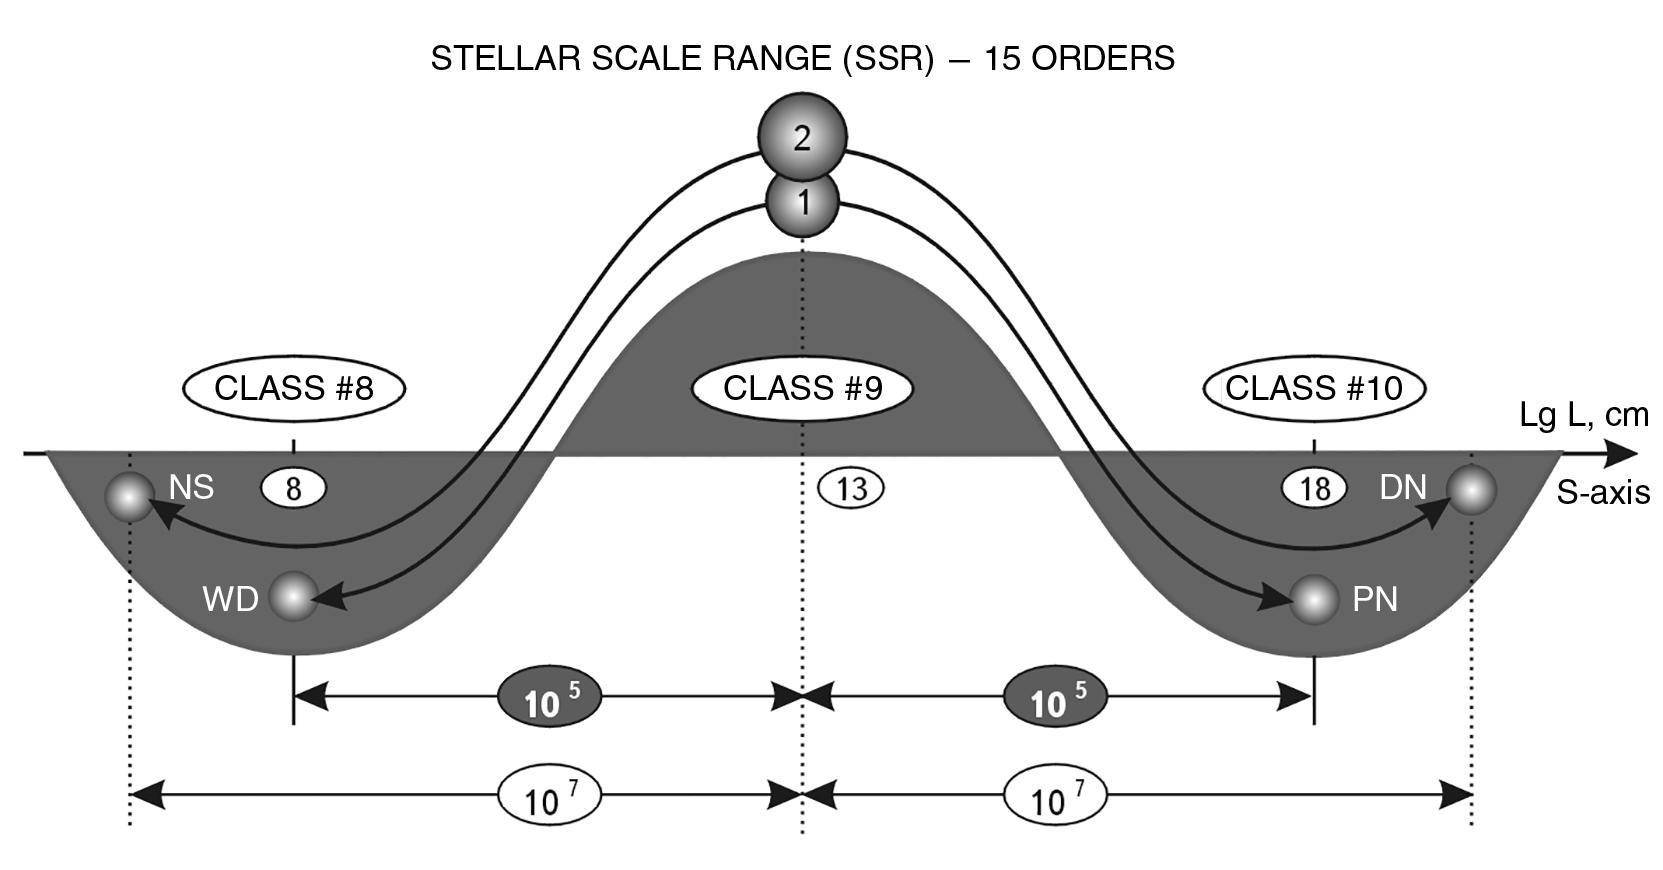 Fig. 2.1. Symmetry of stellar death dynamics on the S-axis. Star 1 (M<M0) explodes along the S-axis into two “fragments”: PT - planetary nebula and BK - white dwarf, which are at a distance of 5 orders of magnitude from the initial point of collapse. Star 2 (M>M0) splits along the S-axis into two other “fragments”: DT - diffuse nebula and NS - neutron star. (M is the mass of the star, M0 is the mass of the Sun)
DIFFUSE NEBULAE. Such nebulae, according to theoretical considerations, can be formed only after the explosion of a star with a mass exceeding 2-10 solar masses 2. According to reference data 3 , stars with such masses are either supergiants of all spectral classes with sizes \(10^{12.45}\)- \(10^{14}\) cm, or main-sequence giants with sizes greater than \(10^{12.4}\) cm.
For a short time on cosmic scales, the shell, thrown off by the exploded star at a speed of 10,000 km/s, expands maximally to a size of about \(10^{20}\) cm and turns into “faint fibers and fragments” - a diffuse nebula. At the same time, the supernova core shrinks to the size of a neutron star, with a minimum diameter of \(10^{6}\) cm.
If we assume that, on average, the diameter of an exploding star is \(10^{13}\) cm, then on the S-axis we again observe a symmetric dispersion of “fragments”: the shell of the star moves 7 orders of magnitude to the right, and the core moves the same amount to the left (see Fig. 2.1). So the question arises. Why do all stars, ending their life, “divide” into two parts, each of which moves along the S-axis symmetrically in opposite directions? Let us note for now only the obvious.
We have an example of DYNAMIC MASTER SYMMETRY, to which the most widespread form of matter in the Universe - stellar matter, which makes up 99% of its mass, is subordinated. At first glance, it is impossible to find a physical explanation for this regularity. After all, when we consider the symmetrical dispersion of grenade fragments from the center of the explosion, we understand that the symmetrical expansion force of the blast wave acts on them. When we consider the collision of two identical billiard balls on the table, rolling at the same angles in symmetrical directions, we realize that the law of mechanics - the law of conservation of momentum - is acting here.
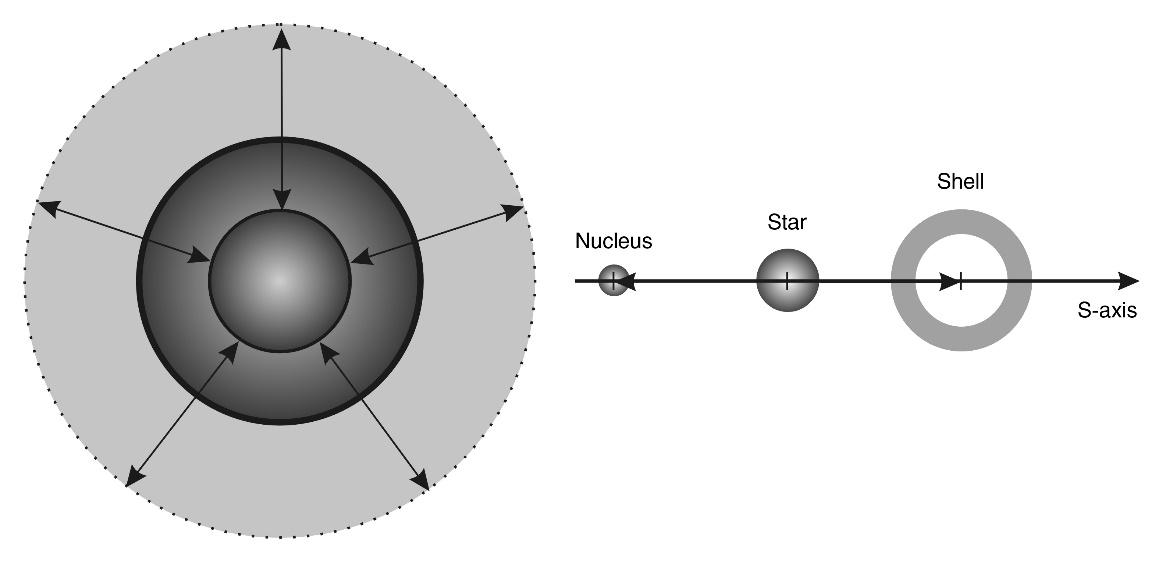
What forces can act along the S-axis to bring to symmetry such different processes as the expansion of the shell of a star and the compression of its core? After all, we are talking about symmetry in the dynamics of processes that in one case go inward to the object, and in the other case - outward to it. Maybe in nature, the momentum is preserved in the scale dimension as well?
-
Shklovsky I. S. Stars. Their birth, life and death. Moscow: Nauka, 1977. С. 213-214. ↩
-
Allen K. W. Astrophysical quantities. Zh-M.: Mir, 1977. С. 295. ↩
-
Mukhin K. N. Physics of atomic nucleus // Experimental nuclear physics. Т. 1. M.: Atomizdat, 1974. С. 50. ↩
Division-synthesis
Consider the Nuclei of Atoms (CLASS #4). The twentieth century was marked in the energy industry by two tremendous events:
- by successfully mastering the decay (division) energy of atomic nuclei;
- the failure of attempts to master the energy of thermonuclear synthesis (synthesis) of atomic nuclei.
Moreover, the number of scientists involved in the work on the second direction and the sums allocated by the states to master thermonuclear energy were by no means less than the indicators of the first direction. Consequently, the failure of thermonuclear synthesis is due to some deep and fundamental defect of knowledge in this area of modern science. It is important for us to emphasize here that, despite the closeness of these processes on the S-axis, synthesis proceeds on smaller scales than division (see Fig. 2.2)1. And we can assume that the boundary of the ~ \(10^{-12}\) cm scale zones of synthesis and division is simultaneously some invisible but very fundamental physical barrier (see Fig. 2.2).
It may be noted in passing that this barrier, figuratively speaking, divides the scale interval for atomic nuclei into “the right part of knowledge” and “the left part of ignorance”.
Let us consider this physical barrier between synthesis and division in more detail, using data from nuclear physics.
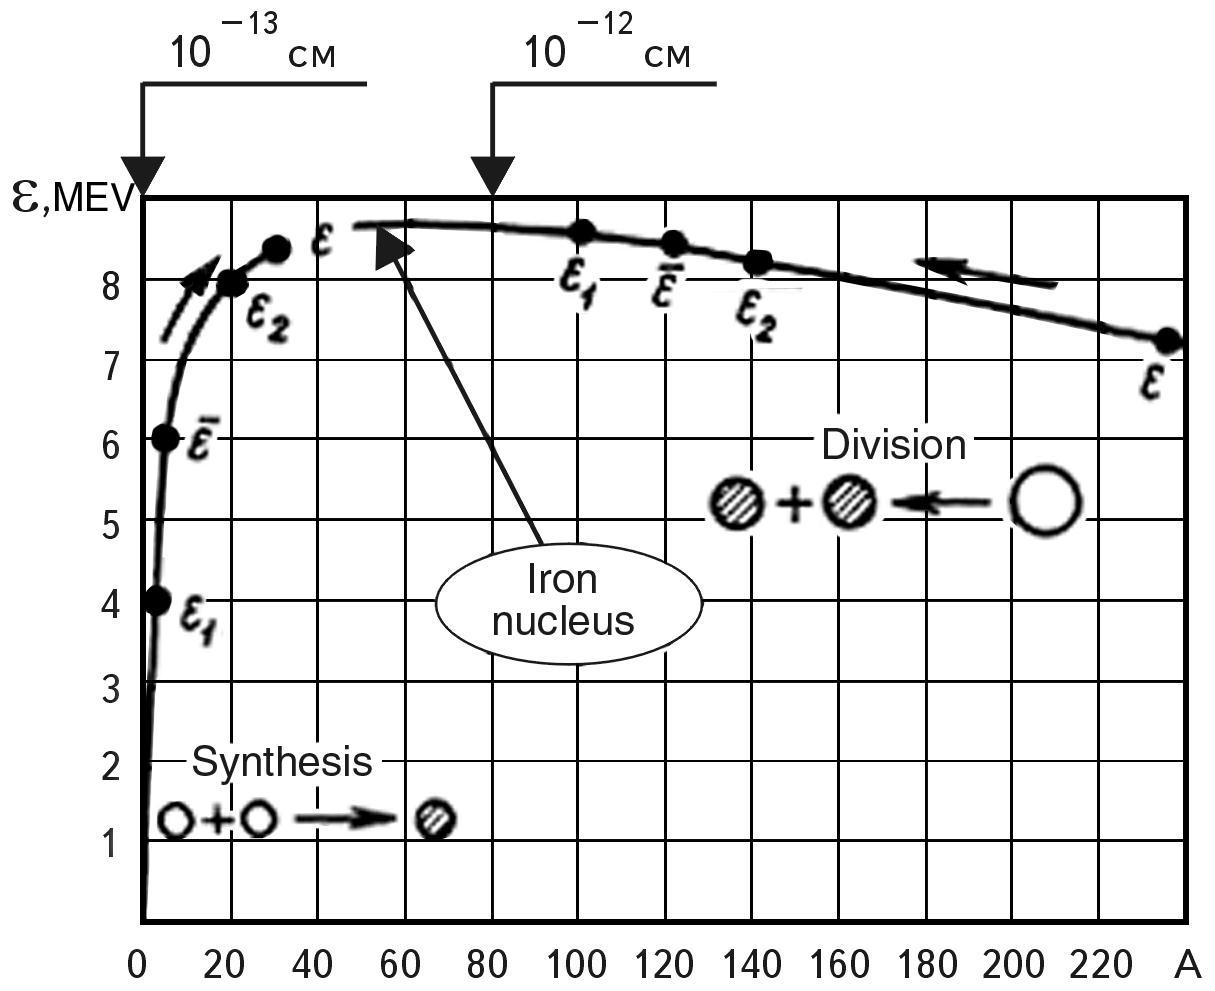 Fig. 2.2 Experimental dependence of the specific binding energy of a nucleon in the nucleus ε on the mass number A, or, obviously, on the size of the nucleus.
We know the experimentally established dependence (see Fig. 2.2) of the specific binding energy of nucleons in the atomic nucleus on the number of nucleons (A). The higher the binding energy, the stronger the nucleus.
The nuclei of elements in the middle part of the periodic system (28 < A < 138), i.e., from Si (28) to Ba (138) , are the strongest. Nuclei with the number of nucleons less than 28 have lower stability, which increases as A increases. For nuclei with the number of nucleons greater than 138, the binding energy and strength decrease with increasing A. The trend reversal occurs somewhere in the region of nuclei of the iron group. It is the nature of this dependence that determines the difference between the two types of nuclear energy production.
To better visualize this difference in the model logic of SWS, let us display the dependence in Fig. 2.2 mirror wise with respect to the X (A) axis. For this purpose, let us introduce a concept: the relative instability of the nucleus 1/ε, which characterizes the excess specific binding energy of nucleons in the atomic nucleus (Fig. 2.3). The larger it is, the more energy can be “taken” from the nucleus during its synthesis with another nucleus or during its division.
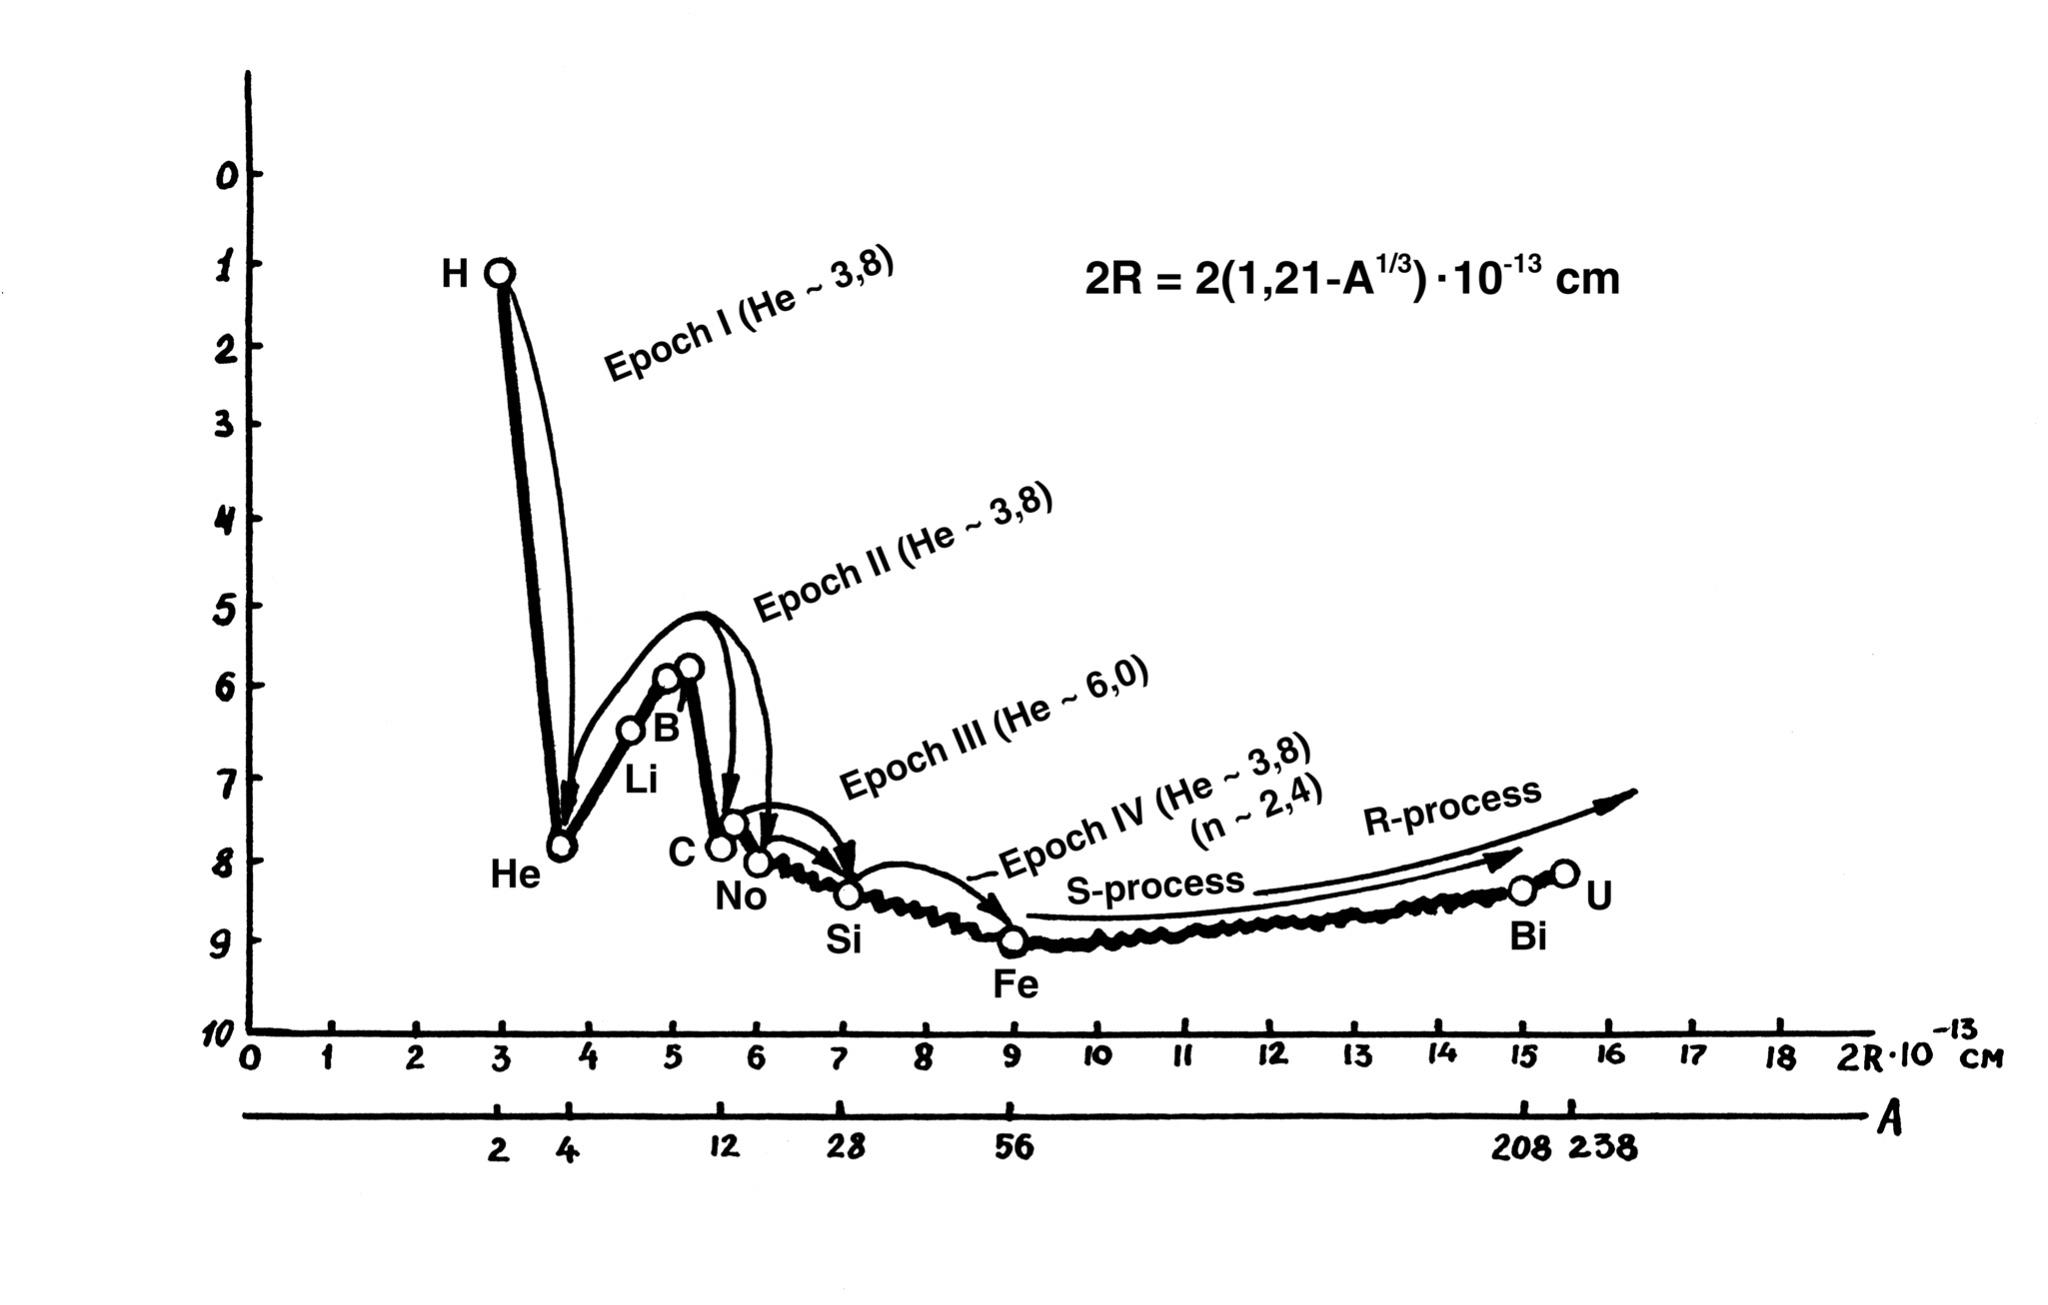 Fig. 2.3. Image of the potential “stability trough” for atomic nuclei. On the left slope of the diagram there is one type of synthesis, and on the right slope (to the right of the Fe point) - another type. This diagram is constructed by the author in a somewhat unconventional form. Its form is essentially mirrored to the dependence in Fig. 2.2, but due to the fact that the bonding energy in the atomic nuclei - ε - decreases as we move upward along the Y axis.
This construction technique allows us to better create a mnemonic image of the nuclei rolling down to the lower stability point (ε ~ 9 MeV).
The diagram shows that the first four epochs of nuclear synthesis in stars reflect the cascade “flow” of the growing nucleus over the fractal surface of the “stability trough” depending on its size to the zone of increased stability - to the group of iron nuclei.
It can also be seen that the synthesis of nuclei heavier than iron (S-process and R-process) on the right slope of the trough proceeds energetically differently: the atomic nuclei seem to roll from the lower point of maximum stability up the right slope of the trough.
* A is the number of nucleons in the nucleus
At the same time, we see that we have obtained, in fact, a potential stability trough for atomic nuclei. All nuclei of elements on the left slope (1< A < 56) of this trough, when moving to the lower stability point, increase in size, which is possible only due to synthesis, the addition of additional nucleons to them. Increasing in size, they naturally move along the S-axis to the right.
All nuclei of elements (56 < A < 238) on the right slope of the stability trough “tend” to roll down and move to the left along the S-axis. This process is possible only at their division, i.e. reduction in size of the final division products.
Both processes - synthesis and division - go with energy release and are directed along the S-axis towards each other, and they converge in some zone of the highest stability dimensions. We see that in this trough of the highest stability, where the nuclei of the elements of the iron group are located, there is no excess energy. In the future we will precisely determine the size of this zone, but already now it should be noted that if the graph in Fig. 2.3 is converted to a logarithmic scale and superimposed by its S-axis coordinates on the SW, it will coincide with the lower bend of the corresponding part of the SW (see Fig. 1.7). It can be seen that the transition from synthesis to division occurs in the lower zone of the SWS of CLASS No. 4.
The kink of the model SWS in this zone is similar to the kink of the experimental stability curve of atomic nuclei (see Fig. 2.3). The image of the “stability fossa” (one order of magnitude long) as the lower fragment of the SWS for CLASS #4 prompted me at one time to an unusual HYPOTHESIS: the experimental curve (see Fig. 2.3) is just a fragment of a more general natural dependence of the stability of objects of scale \(10^{-13}\)… \(10^{-11}\) cm on their size. Before getting into this, let us introduce some methodological schemes and images.
MODEL OF THE S-Trough of Potential stability - (STPS) WITH A synthesis-division BARRIER (CDB)
Let us imagine that we are trying to move an imaginary object placed in the lower point of the potential trough of atomic nuclei to the right or to the left. This is equivalent to raising it to a greater height, which requires additional energy expenditure. Figuratively speaking, it is like rolling a stone up a mountain. If we place our imaginary stone on the left slope, a small push is enough, and it will roll to the right, to the lowest point of the trough. If we place it on the right slope, it may, after a little push, roll down to the left.
Since the left slope is much steeper than the right slope (see Fig. 2.3), there is an allegory here: it is much more difficult to keep the “sled” of synthesis on the left very steep slope than the “sled” of division on the right, more gentle slope. Perhaps, that is why the control of the left descent has not yet been mastered, while the control of the right one has already been worked out to the last detail.
Let’s forget about atomic nuclei for a moment. Let’s abstracts to a conditional model of a potential stability trough. Since the whole process takes place in parametric space, where any motion along the S-axis leads to a significant change of the system’s dimensions, we should consider how these phenomena occur with some conditional objects endowed with conditional density and dimensions.
Suppose that on the right slope of a potential trough there is a certain object, which under the influence of some factors tends to take a more stable position and go down. For this purpose, it needs to change its dimensions, specifically, to reduce them.
The first simple option is that the object decreases in size due to compression, which leads to its compaction (see Fig. 2.4). But what if this is impossible, as, for example, with nucleons, which are not compressed? In this case, there is another option - the object decreases in size due to fragmentation into smaller independent parts, each of which by its size occupies on the S-axis a position to the left of the primary object (see Fig. 2.5).
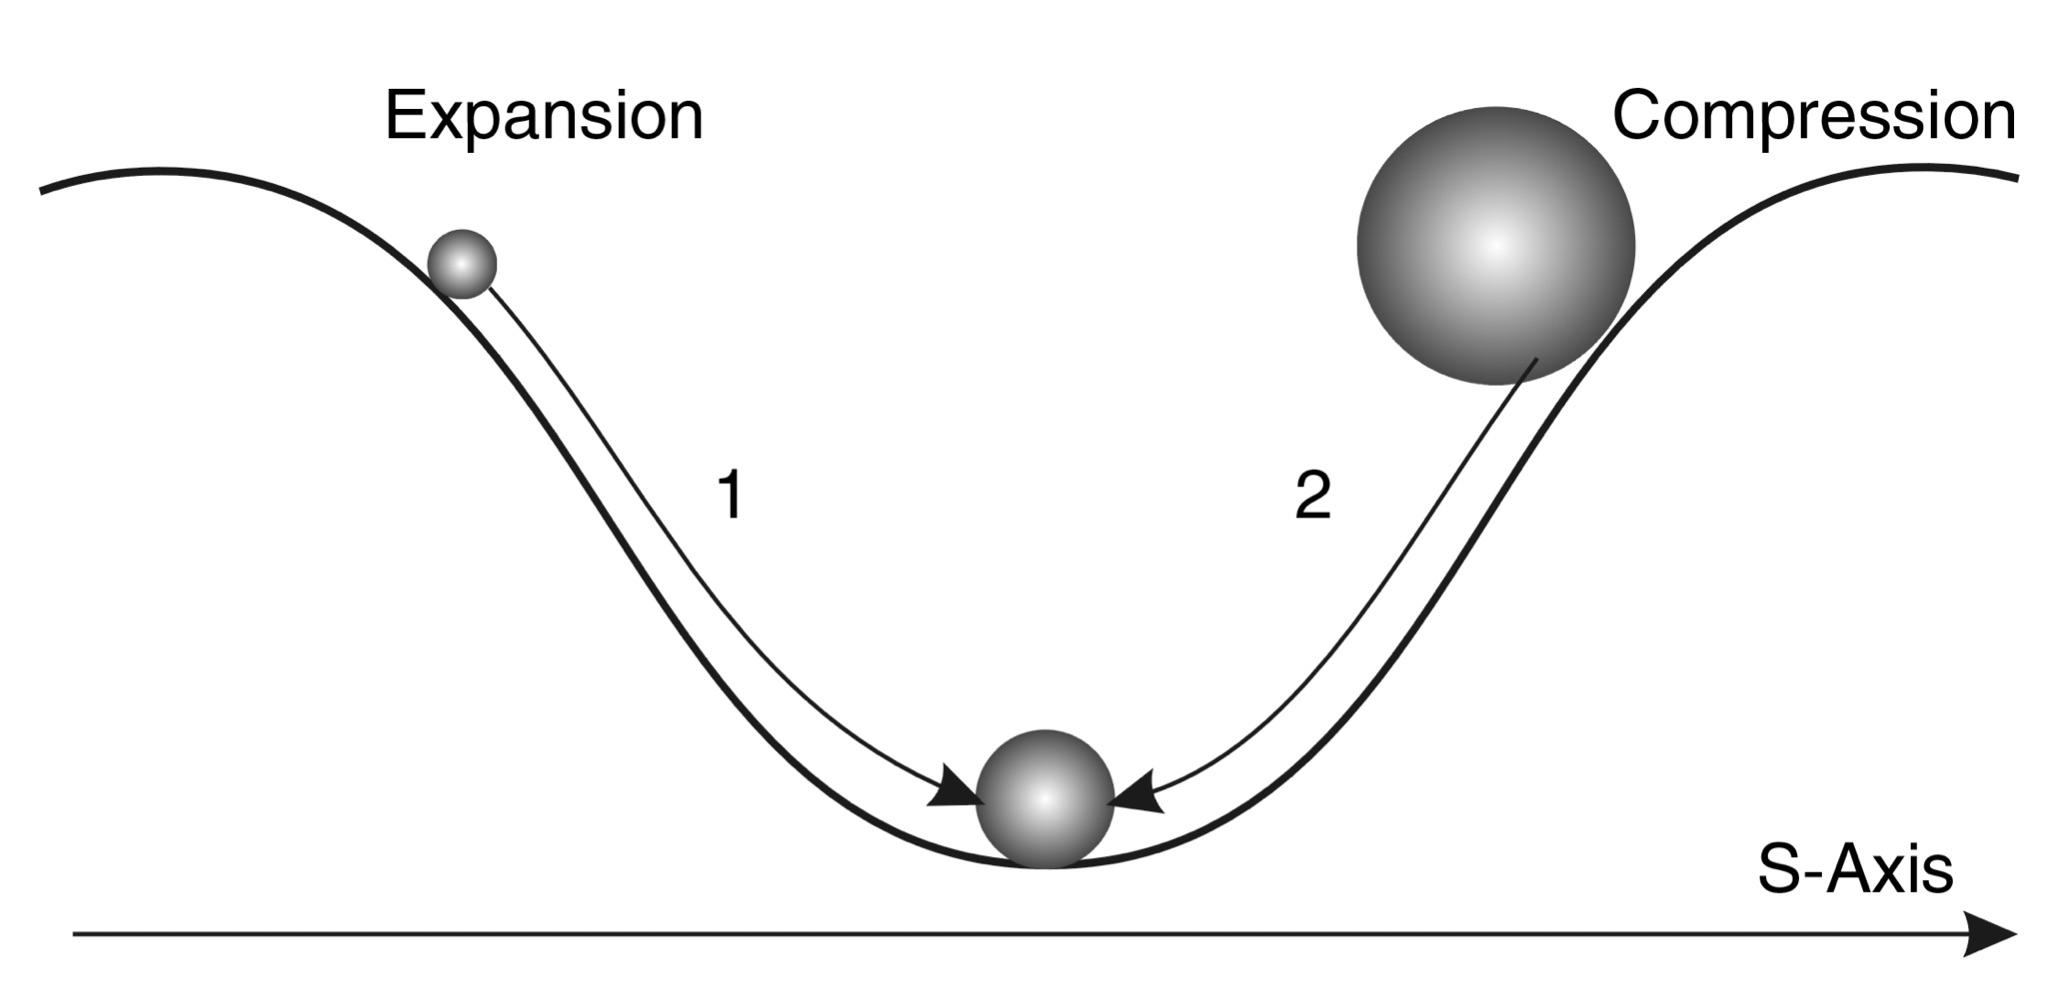 Fig. 2.4. S-through model and scheme of motion in the potential field of stability with preservation of system integrity: 1 - expansion of the system, 2 - compression of the system
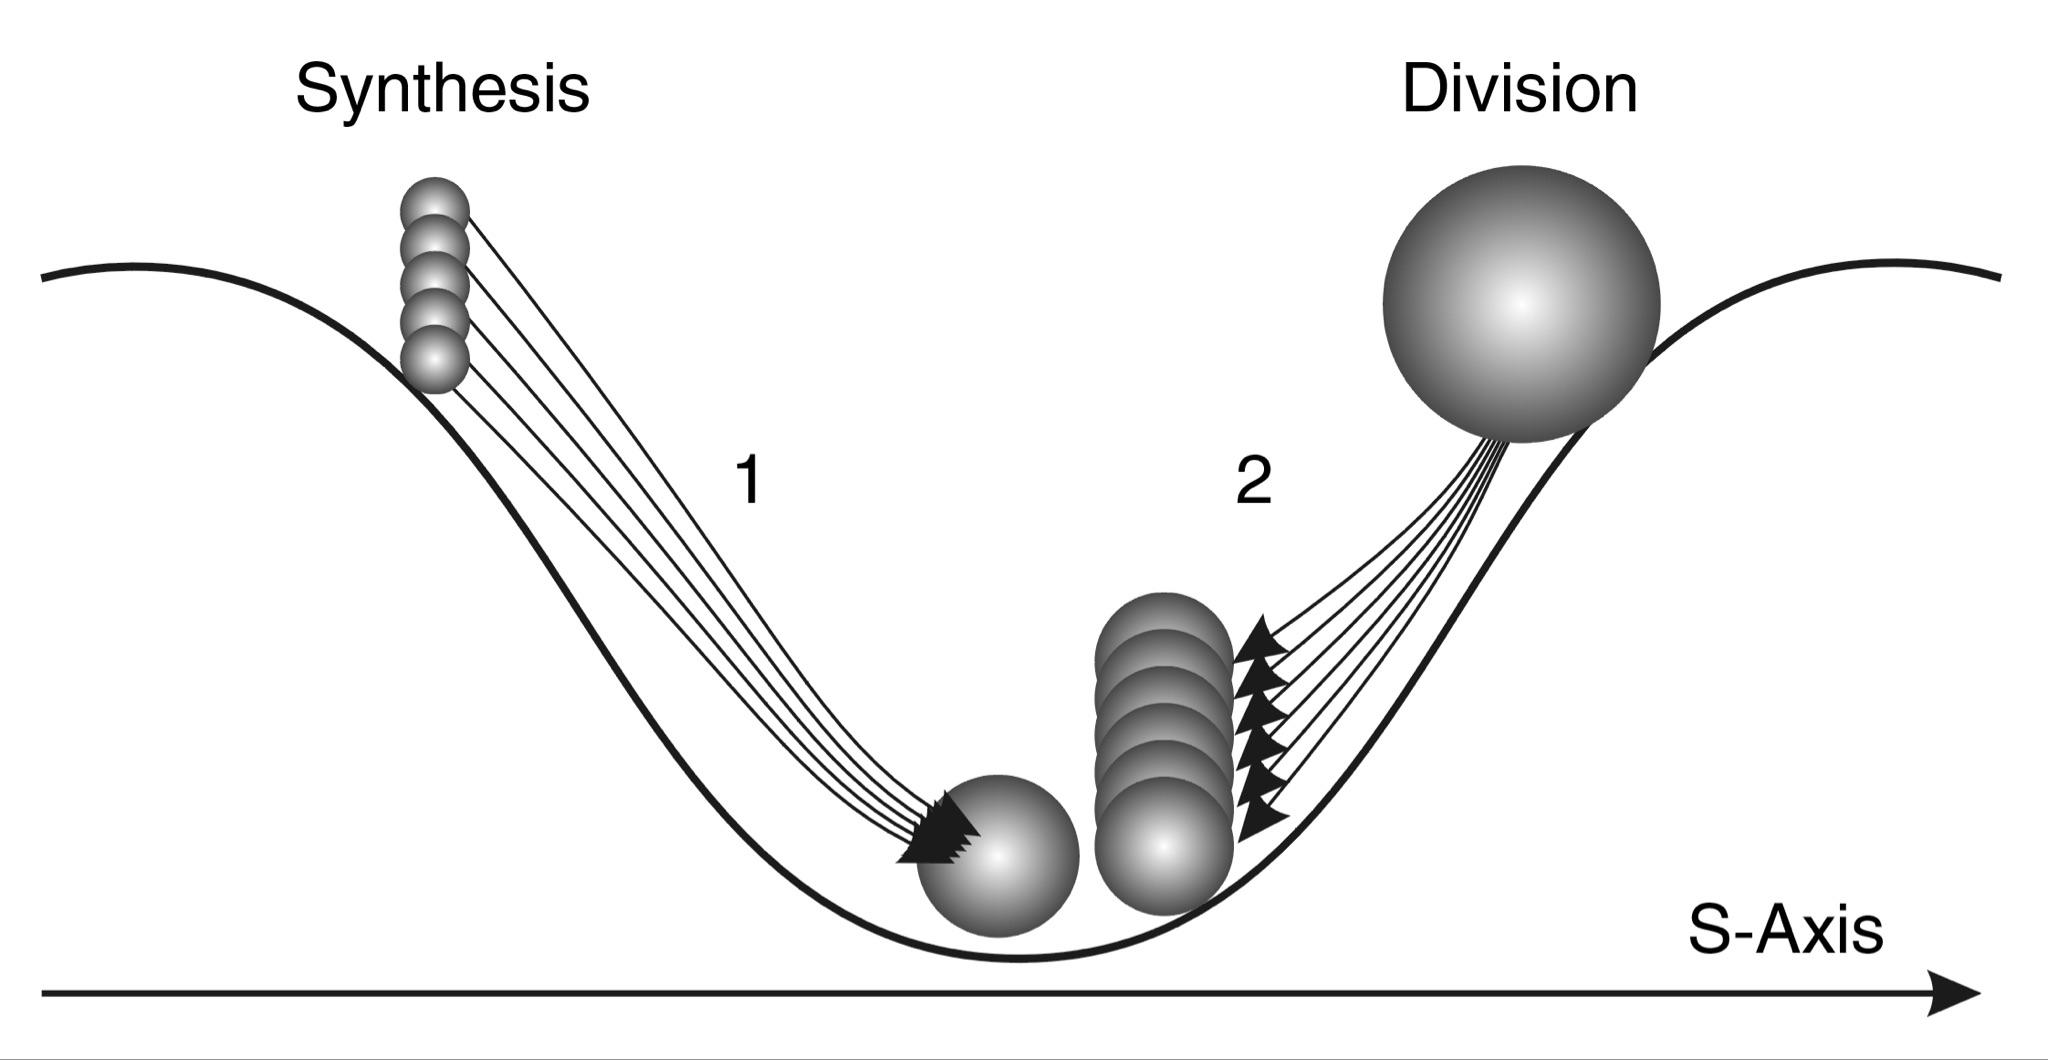
Fig. 2.5. S-trough model and scheme of motion in the potential field of stability without preserving the integrity of the system: 1 - system synthesis, 2 - system division
Let us now consider the system variants of moving the object on the left slope. Two variants are also possible here (see Figs. 2.4 and 2.5). The object increases in size and moves to an energetically more favorable position:
- through expansion;
- by combining different objects into a new holistic object - a variant of synthesis.
Further we will show that two variants of behavior on the right slope and two variants of behavior of systems on the left slope are universal schemes for many processes in the Universe. For now, let us introduce here a new notion - the synthesis-division barrier (S-D). This notion denotes the scale dimension corresponding to the lowest most stable point of the M-trough. It separates energetically favorable synthesis scale zones (left) from M division scale zones (right).
Now let us return to the Nuclei of atoms (see Figure 2.3).
What does the graph of the dependence of the stability of atomic nuclei on their size look like? First, its “bottom” has several local “depressions” in which the stability of nuclei increases. Secondly, if we move to the left from the lower stability point, the curve goes steeper and steeper upwards. We see a bend of the curve line, but less steep, to the right of the stability center. Let’s consider those data of physics of nuclear reactions, which illustrate this dependence. All atoms of the left part of the trough are obtained in the process of constant thermonuclear synthesis in the depths of stars, where nuclei of heavier elements are constantly created from hydrogen nuclei. Astrophysics distinguishes 2 several synthesis cycles: hydrogen combustion, helium combustion, carbon and silicon combustion. The maximum that is obtained in space as a result of this process is the nuclei of atoms of the iron group, since “iron and nuclei close to it are characterized by the maximum binding energy per nucleon” 3. “These reactions are called e-processes, and they finally lead to the formation of iron (Fe, 56) and close to elements under conditions of thermodynamic equilibrium and in stellar explosions… For the transformation of the nucleus
$$ ^{56}_{26}\text{Fe}^{30} $$
into the nucleus
$$ ^{238}_{92}\text{U}^{46} $$
it is necessary 182-fold neutron capture alternating with acts of β-decay “ 4. In this case, heavy nuclei are obtained, according to modern astrophysical ideas, as a result of catastrophic shock processes occurring during the explosion of supernovae. The point is that the synthesis of nuclei of atoms heavier than iron is an energy-consuming process, so it occurs only due to the shock feeding by the energy of the explosion of a star.
All attempts to create artificially atomic nuclei with the number of protons greater than \(10^{6}\) have failed due to the sharp increase in the energy expenditure required for this and the low stability of artificial nuclei. If we turn to the stability trough model and visualize the experimental curve in Fig. 2.3. as a model like Fig. 2.5, then, figuratively speaking, nuclear physics becomes like SisypSWs, rolling his stone up the mountain on the right slope, but unable to get it to the top, where it could rest stably.
Consequently, if the “sled” of nuclear synthesis rolls down the left slope under its own weight, it can climb the right slope only by the inertia of a strong push.
In addition to this difference, there is a fundamental structural difference between the synthesis of nuclei on the left slope and on the right slope of the S-Trough. It consists in the fact that both nuclei of the same size and different nuclei can participate in synthesis on the left slope. In the latter case, even the smaller of them is a complex nucleus. At the same time, synthesis on the left slope is always a ONE-ACT process. Two nuclei fuse together and form a new nucleus, resulting in the release of free energy.
On the right slope - synthesis is realized only by attaching to heavy nuclei individual neutrons - the smallest possible elements of nuclear synthesis. Moreover, the process becomes MULTI ACT, synthesis, in fact, passes into the process of absorption of small particles by a large nucleus, and energy is not released, but on the contrary - expended.
Here, it is quite correct to use the concept introduced earlier - “SYNTHESIS-DELIVISION BARRIER” (see Fig. 2.6). This barrier divides the M-NMU into two sections: the left one, where nuclear synthesis is energetically advantageous, and the right one, where nuclear division is energetically advantageous. A general rule can also be introduced: SYNTHESIS DOMINISES ON THE LEFT SLope of the S-trough, and division DOMINISES ON THE RIGHT SLope.
However, if we introduce the notion of synthesis prohibition for the right slope of the nuclear S-Trough, the question arises: how can we explain the known fact that in nature there is still synthesis of nuclei heavier than iron? After all, these nuclei are in the scale zone corresponding to the right slope of the S-Trough.
We will show that the agreement with the model is not violated in this case.
First, as already mentioned, the synthesis of these heavy nuclei (on the right slope) proceeds in very rapid explosive processes, and the source of energy of these explosions are nuclear reactions of synthesis of light nuclei of the left slope of the S-Trough. Just a part of the energy released in this process is absorbed by energy-costly synthesis on the right slope. Figuratively speaking, the synthesis of the right slope “parasitizes” the synthesis of the left slope.
Second, on the right slope we see a fundamentally different type of process. It is no longer the synthesis of two identical (or close in mass) nuclei, as on the left slope, but the addition of neutrons. AND THE MODEL DOESN’T FORBID synthesis FOR NEUTRONS! It forbids it for heavy nuclei on the right slope.
So, for one participant of synthesis, which is located on the right slope (heavy nucleus), the model “forbids” synthesis, and for another participant of synthesis (neutron), which is located on the left slope, it does not “forbid”. And this partial prohibition, figuratively speaking, nature overcomes due to the explosive character of the process (the explosive character of the process is due to the absorption of energy from the left slope, where light elements are explosively synthesized (see Fig. 2.6)).
TSWs, we see that when moving from left to right along the S-axis while passing the C-D BARRIER, the type of synthesis reaction changes significantly - in fact, the transition from synthesis proper to multiple neutron capture takes place.
The maximum core size that is involved in SYMMETRIC SYNTHESIS on the left slope is about 7 \(\cdot 10^{-13}\) cm.
It is a synthesis in which the parts joining are equal or close in size.
On the right slope, synthesis of two almost identical components becomes impossible and gives way to ASYMMETRIC SYNTHESIS, i.e., absorption of small neutrons by one large component. As will be shown later, this distinction is of system-wide significance.
Let us now consider the MASSIVE FEATURES of nucleus division.
All nuclei on the right slope division with the release of excess energy, shifting along the S-axis to the left (“sliding” down into the S-Trough of Potential Stability - STPS). It is known that active spontaneous division is inherent only to very large nuclei (they are located on the rightmost edge of the S-Trough of Potential stability - STPS of the SWS model). Smaller nuclei do not spontaneously division, but they can gradually transform into the most stable nuclei of the iron group 5.
On the left-hand slope, nuclear division is an energetically extremely disadvantageous process, since the resulting fragments will collectively have more energy than the original nucleus.
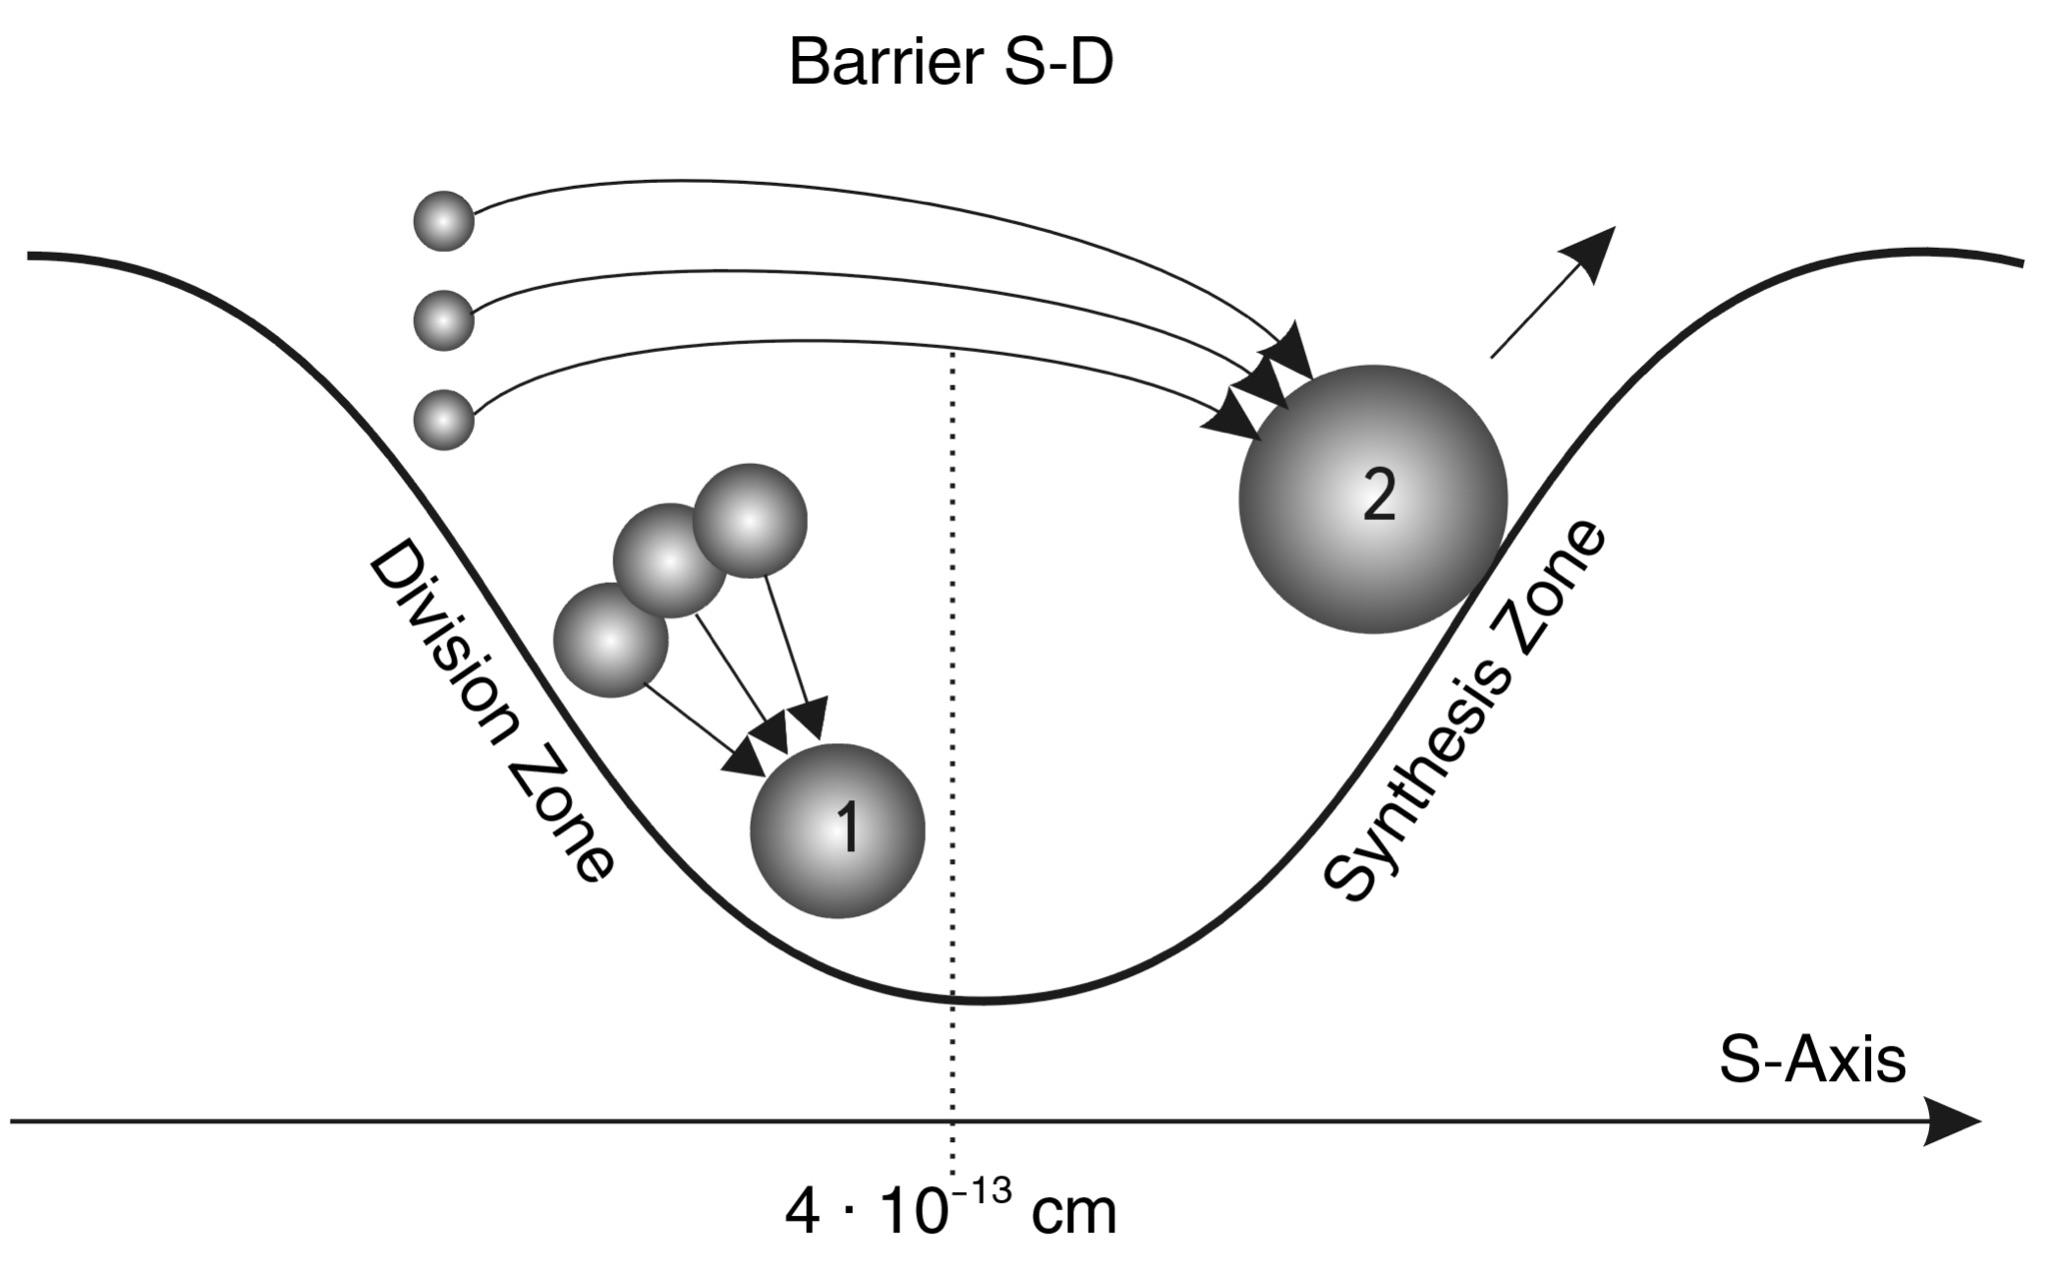 Fig. 2.6. SYNTHESIS PROCESS (1) in the synthesis zone (on the left slope of the S-Trough of Potential stability - STPS).
The SYNTHESIS PROCESS (2) in the division zone (on the right slope of the trough) proceeds due to the participation of elements inclined to synthesis. Their sizes are smaller than synthesis-division BARRIER (CDB), so synthesis in the forbidden zone of the model occurs as if by overcoming CDB by small elements
Therefore, the division of nuclei, which are lighter than iron group nuclei, cannot spontaneously proceed.
So, synthesis-division BARRIER (CDB) divides the S-Trough for the process of nuclear division also clearly into two parts. To the left of the barrier, division is “forbidden”, to the right - “allowed”. The steepness of the slopes of the S-Trough of Potential stability - STPS here (see Fig. 2.2) gradually increases, as evidenced by the fact that the heaviest nuclei (the right edge of the S-Trough) roll to the left very easily, and to split nucleons (the left edge of the STPS) into quarks experimental physicists have not yet succeeded, despite titanic efforts. One can continue the above allegory and say that rolling a stone down the left slope is even more difficult for Sisyphus than rolling down the right slope.
The question arises: how far do the slopes of the model S-trough go to the left and right and do they flatten or kink?
The analysis of regularities of the most diverse dynamical processes of nature at different scale levels of the Universe led the author to the following HYPOTHESIS.
THE stability WAVE IS AT THE SAME TIME A MODEL FOR DISTINGUISHING THE PREVAILING PROCESSES OF division OR synthesis ON DIFFERENT SCALES OF THE UNIVERSE.
Therefore, we can consider the energetic S-Trough of Potential stability in the region of atomic nuclei as a small fragment of the whole SWS, figuratively speaking, as a small bone of a dinosaur, by which we will try to reconstruct its whole skeleton (see Fig. 2.7). Then the left slopes of all SWS SW are large-scale zones of energetically advantageous synthesis of systems, and all right slopes are large-scale zones of energetically advantageous division of systems. The tops of SWS are the zones of saddle stability, and the troughs are the zones of stable equilibrium of systems.
We call the S-Trough of Potential stability - STPS the segments of the model sinusoid from crest to crest. The central part of the S-Troughs coincides in location on the S-axis with the even scale classes. Therefore, the numbering of the troughs will preserve the numbering of even classes (see Fig. 2.7).
To test this hypothesis, let us consider sequentially, starting from the proton (S-trough No. 4) and up to the Metagalaxy, what types of processes dominate at different scale levels of the Universe.
S-Trough #4 [-18; -13; -8]
In the most general terms, as already mentioned, the potential stability hole for atomic nuclei can be modeled by a fragment of the lower part of the S-N SWS (CLASS #4).
Moreover, the center of stability for the nuclei is the iron group nuclei, the size of which is close to \(10^{-12}\) cm*. However, the model trough is smooth, while the real one (see Fig. 2.3) is serrated and uneven. In addition, in the model STPS there is one lower stability point - 1.6 \(\cdot 10^{-13}\) cm, while in the real trough there are at least two of them: 1.6 \(\cdot 10^{-13}\) cm (hydrogen nucleus) and 9 \(\cdot 10^{-13}\) cm (iron nucleus).
In the previous part we considered bimodality in the distribution of objects by size and in this interval (\(10^{-13}\)… \(10^{-12}\) cm) we identified only two highest stability points: 1.6 \(\cdot 10^{-13}\) cm and 3.4 \(\cdot 10^{-13}\) cm. Both of them are clearly visible in Figure 2.3. But the third point identified on the S-axis, equal to 9 fermi (9 \(\cdot 10^{-13}\) cm), is a surprise for the SW model built here. This indicates the incompleteness of the model and the need for its further more detailed development.
However, the two stability points on the S-axis (1.6 \(\cdot 10^{-13}\) cm and 9 \(\cdot 10^{-13}\) cm) are within one order of magnitude of each other. For the whole S-trough, the scaling length of which is 10 orders of magnitude, this gives a spread of 1/10 (10% error). This deviation can be neglected.
At the end of this part of the book, we will touch upon this problem again, but at a higher level of generality. Here we only note that the experimental stability curve of atomic nuclei (see Fig. 2.3) testifies to the fractal form of the SWS. It is also important to note that while the first stability point (1.6 х \(10^{-13}\) cm) belongs to a proton particle, the second (9 х \(10^{-13}\) cm) belongs to an ensemble of particles (56 nucleons). Therefore, the character of their stability is fundamentally different.
* As we see, the stability center for the STPS is shifted by one order of magnitude to the right. This phenomenon, in the author’s opinion, is related to the bimodality of the SWS, so all the STPS have the highest stability zone slightly shifted from the lower model point of the STPS.
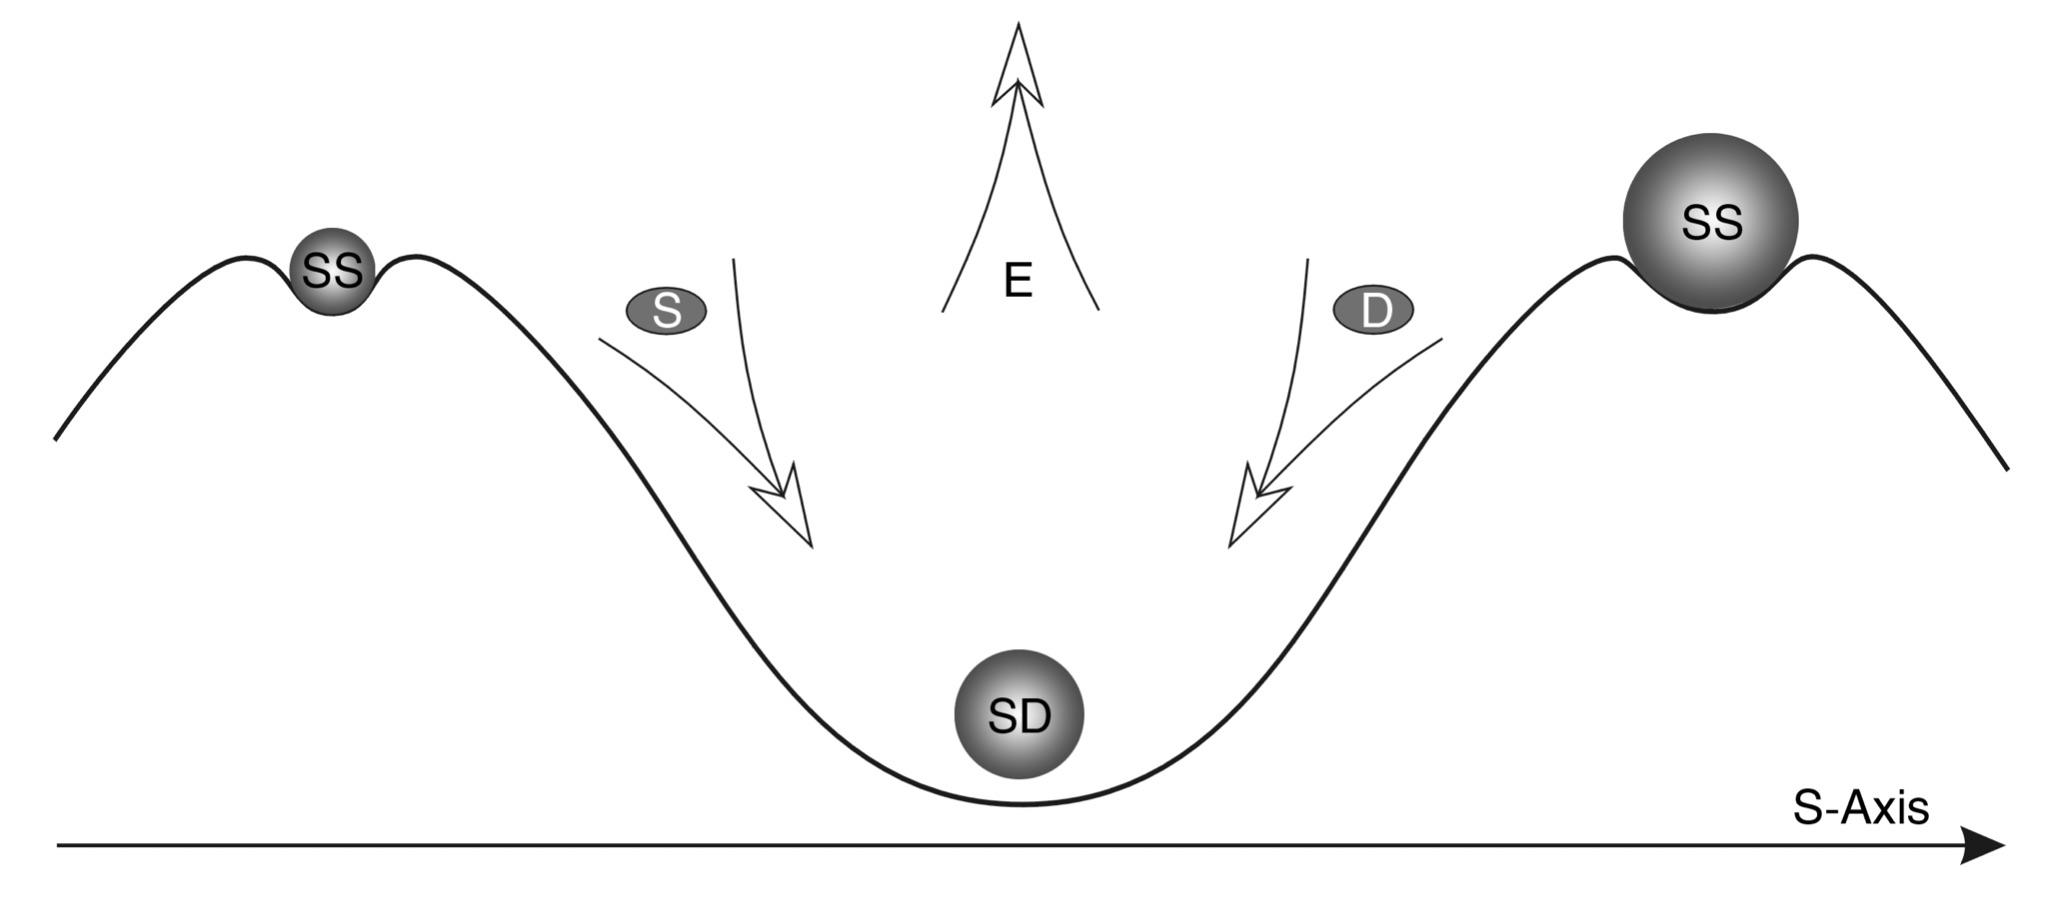
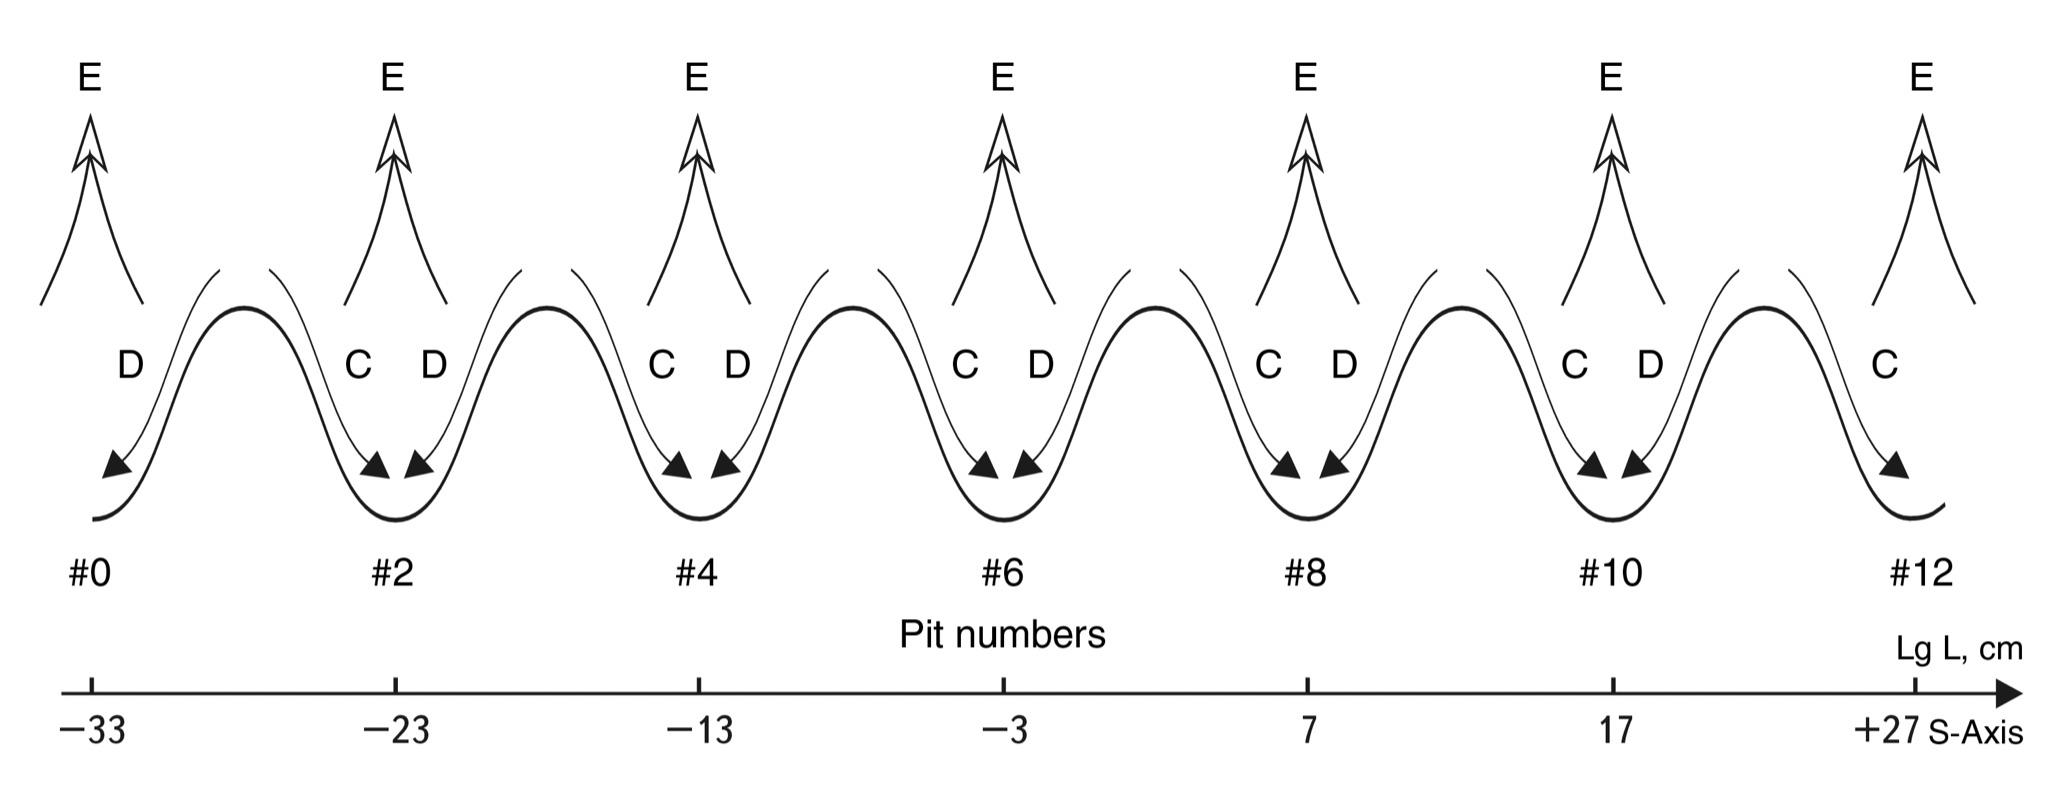 Fig. 2.7. Dynamic model of SWS
However, we’ll leave that problem for now.
Let us now go beyond the range of \(10^{-13}\) cm - \(10^{-12}\) cm. Let us start with the left slope of S-Trough No. 4. According to the SW model, it goes all the way to the saddle region of stability, which has a coordinate on the S-axis (-18). According to our PROPOSITION, this is exactly the size of the electron. Physicists managed in experiments to get only to the size of about \(10^{-17}\) cm. Let’s think about what is the essence of these experiments.
The essence of these experiments is that elementary particles were accelerated in gas pedals to gigantic speeds to break them into small fragments. Since for the destruction of particles of \(10^{-15}\) cm in size it was necessary to build gas pedals with a diameter of more than 2 km (\(10^{5}\) cm), we can say that the “strength” of particles is very high.
Let us imagine that we need to break down an alarm clock into its component parts, and for this purpose we build a machine whose dimensions are 20 orders of magnitude larger. Such a rig would have a diameter a million times larger than the orbit of Jupiter.
At the same time, not all particles can be separated into their constituent parts. For example, quarks could not be separated from nucleons. What does that tell us? On the left slope of S-Trough No. 4 the separation of elementary particles into their constituent parts is an energetically very costly procedure.
On the right slope of S-Trough No. 4, as already noted, there is spontaneous decay of larger nuclei into fragments. Here the picture is mirror-opposite. It costs nothing to break large nuclei into their constituent parts. But it is still not possible to synthesize, to put together from parts nuclei, the sizes of which would exceed \(10^{-12}\) cm, although it uses gigantic energies.
According to the dynamic model of SWS (see Fig. 2.7), the stability saddle for CLASS No. 5 (the coordinate of the S-Trough of Potential stability - STPS (-8)) should be 5 orders of magnitude to the right of the lower point of STPS No. 4. The whole Periodic Table of Elements really “sits” there, as atoms have diameters from \(10^{-8}\) to 6 \(\cdot 10^{-8}\) cm. Unfortunately, the author has no information about the processes going on with systems whose sizes would be in the range from \(10^{-12}\) to \(10^{-8}\) cm. Therefore, it remains to assume that here, too, the decay of systems is energetically more favorable than their synthesis.
S-Trough #6 [-8; -3; +2]
Let us leave the microcosm for the time being and move to the next in order potential S-Trough of Potential stability. The central range of sizes in this S-trough is 10…100 μm. Theoretical points of increased stability are 1.6 \(\cdot 10^{-3}\) cm (SWS) and 5 \(\cdot 10^{-3}\) cm (EWS).
According to the hypothesis on the similarity of stability troughs (see Fig. 2.7), on the left of the central range up to the top of the SW (\(10^{-8}\) cm), synthesis should be energetically more advantageous, while on the right, up to the size of \(10^{2}\) cm, division should be more advantageous.
Let us consider the factual data on the nature of scale-dynamic processes in this scale region. The most dynamic systems with such dimensions are living cells.
CELLS. As already mentioned, almost all eukaryotic cell types have an average size in the range from 10 to 100 microns. Just in the scale region of interest, which, according to the SW model, is the zone of highest stability. It is known that all cells reproduce by division and thus increase the number and complexity of living systems in the Biosphere.
METHODOLOGICAL APPROACH
Before we proceed to a systematic analysis of the cell division process, let us agree on some concepts and semantic constraints.
First, it is extremely difficult to determine the energy parameters of processes in the living world by analogy with nuclear division and synthesis. Therefore, we will determine the advantage of one or another type of process by its dominance in the evolutionary movement of systems: reproduction, complication, etc. For example, it is known that proteins complicate their structure by synthesis, but cells reproduce by division.
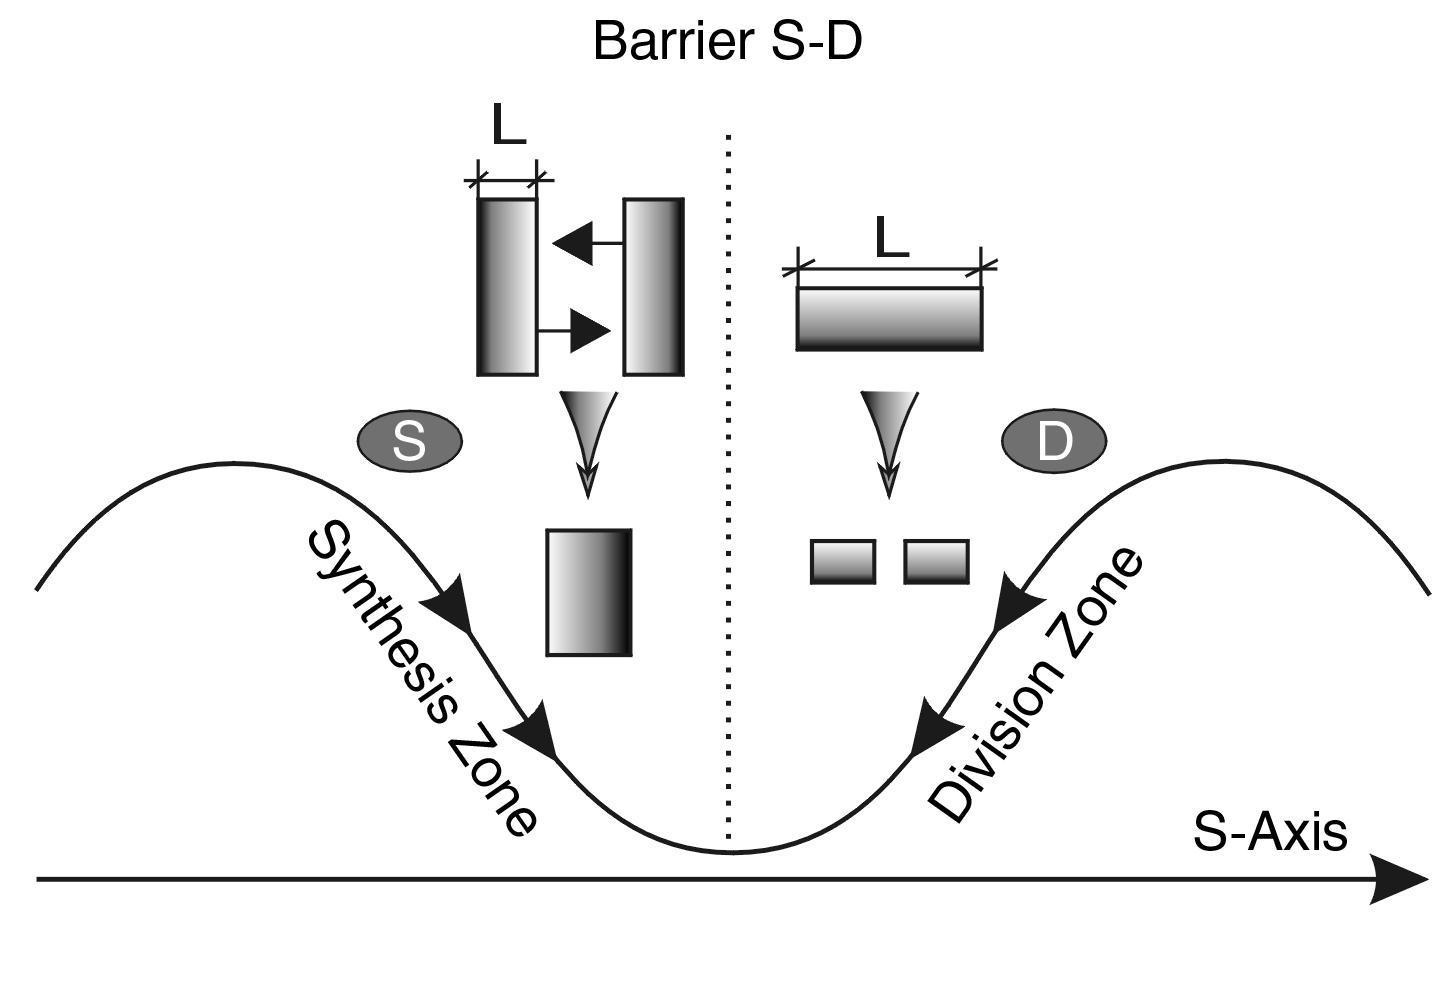 Fig. 2.8. EXTREME SIZE RULE (L). To determine the synthesis size (S), the smallest system size should be taken. To determine the division size (D), the largest system size should be taken
Secondly, the latter does not mean that synthesis processes are not involved. Therefore, when speaking about the predominance of one or another process, we will mean the following.
-
It will be exclusively about the upper scale level of the system. To put it simply - about the processes going on with it as an integral system and not about the processes going on at the scale of its form. So, for example, for a cell we will speak about its external dimensions at the moment of division. We do not take into account all the synthesis processes going on inside the cell during its vital activity at the moment of division, as they are going on other, lower scale levels.
-
We will emphasize the final act of the process. After all, before dividing, the cell grows (due to synthesis on the left slope). The final act, after which a new qualitative state appears (either the birth of a pair of cells or the next stage of development of a multicellular system), is division.
Let’s consider an example - the absorption of food. Chewing pieces of food, we absorb them, but they will not be able to combine with the body until they are divided into elements with sizes so small that they can participate in the natural process of synthesis. Useful assimilation does not occur even at the large-scale cellular level; the food cells must be broken down to a molecular state.
Of course, biology has all the explanations for why food must be digested, i.e., broken down to its molecular state, before it can be absorbed. We do not intend to substitute our own for these explanations. Here we are only generalizing various well-known facts to the level of a single scheme.
If “assimilation” of cellular systems does occur, it is a parasite infestation of the organism, i.e. clearly an anti-evolutionary process.
Consequently, a multicellular organism is able to synthesize into itself usefully only those objects that are smaller than cells (starting from useful bacteria and smaller). Since the average cell size is 10…100 µm, we are talking about synthesis of elements to the left of the S-D barrier.
It is true that science has recently succeeded in overcoming this barrier and has begun to implant alien organs, which is a typical synthesis on the right slope. But what a price to pay for this overcoming! How much labor and money such operations cost!
Again, we note that we should not be confused by the parallelism in time of the processes of synthesis and division in one cell. It should be said that such a strict fixation of one of the scale slices is a necessary condition for primary analysis in all cases of work with the S-axis.
-
In the zone of transition from synthesis to division, it is sometimes difficult to establish which size is the critical “synthesis size”. So, for example, a dividing bacterium may be several times longer than its diameter. Or another example: two sex cells at the moment of their synthesis may differ in size by more than 10 times. To avoid discrepancies, we will adopt here a GENERAL RULE. ***If the system has a significant difference in width, height, and length, the size of synthesis (division) should be determined along the direction of the process (***see Fig. 2.8).
For example, if a bacterium has a diameter 10 times smaller than its length and is divided into two parts across, the coordinates of the process on the S-axis will be determined by the length of the bacterium, not by its diameter. Similarly, if the synthesis of two elongated systems goes sideways (see Figs. 2.8 and 2.9), then the diameter should be considered the critical size.
A more complicated situation for consideration arises when two systems of different sizes are involved in the act of synthesis (division). In this case, two sizes should be distinguished for synthesis: critical (minimum) and secondary. Thus, we have already considered an example when a heavy nucleus (secondary size) absorbs neutrons (critical size). Here too, if at least one of the participants in the act of synthesis is to the left of the C-D barrier, synthesis is possible.
-
Obviously, both division and synthesis can have positive and negative consequences for biosystems. If, for example, any vertebrate animal is divided into two equal parts, it will lead to its death, but this does not mean that division at this scale level leads only to degradation, because the birth of vertebrates is from the systemic point of view also an act of division. On the other hand, if you surgically fuse two vertebrates together (synthesis), it is obviously a negative act, but this does not mean that synthesis at this level always leads to bad consequences, for example any sexual act is a temporary synthesis of two bodies with further consequences.
Therefore, in order to avoid ambiguous interpretations of the conclusions to be drawn later on, we shall at once stipulate that for the consideration of tendency we select only the most natural, stable, frequently repeated and final acts leading to the complication or reproduction of a biosystem. In this respect, the sexual act as a synthesis does not fit the latter criterion; it is not the final act of the emergence of a new system. Such an act is the birth of a new being, i.e. the separation of the fetus from the mother.
-
When analyzing empirical data and introducing some dimensional restrictions, barriers to this or that process, we will have in mind tendencies and rules that can manifest themselves both in a rigidly deterministic and statistical way. In the latter case, it will always be possible to find a few exotic examples that violate the proposed restriction. We assume that the reader in this case will always have in his memory the curve of the statistical distribution with its sufficiently wide dispersion, while we will be guided by the curve’s mode. This will allow us not to drown in details at the first step, to reveal, albeit approximated, but main tendency.
After all these reservations, let us proceed to the ANALYSIS OF FACTUAL MATERIAL FOR BIOSYSTEMS LOCATED IN S-Trough #6.
PROTOZOA (UNICELLULAR PROTOZOA). For them, the main method of sexless reproduction is division. During division, the body of the parent splits into two more or less independent parts. Some protozoa are inherent and sexual reproduction, “characterized by the fact that the actual reproduction … preceded by the sexual process, the characteristic feature of which is the synthesis of two sex cells (gametes) or two … nuclei, leading to the formation of a single cell - zygote, giving rise to a new generation.”6
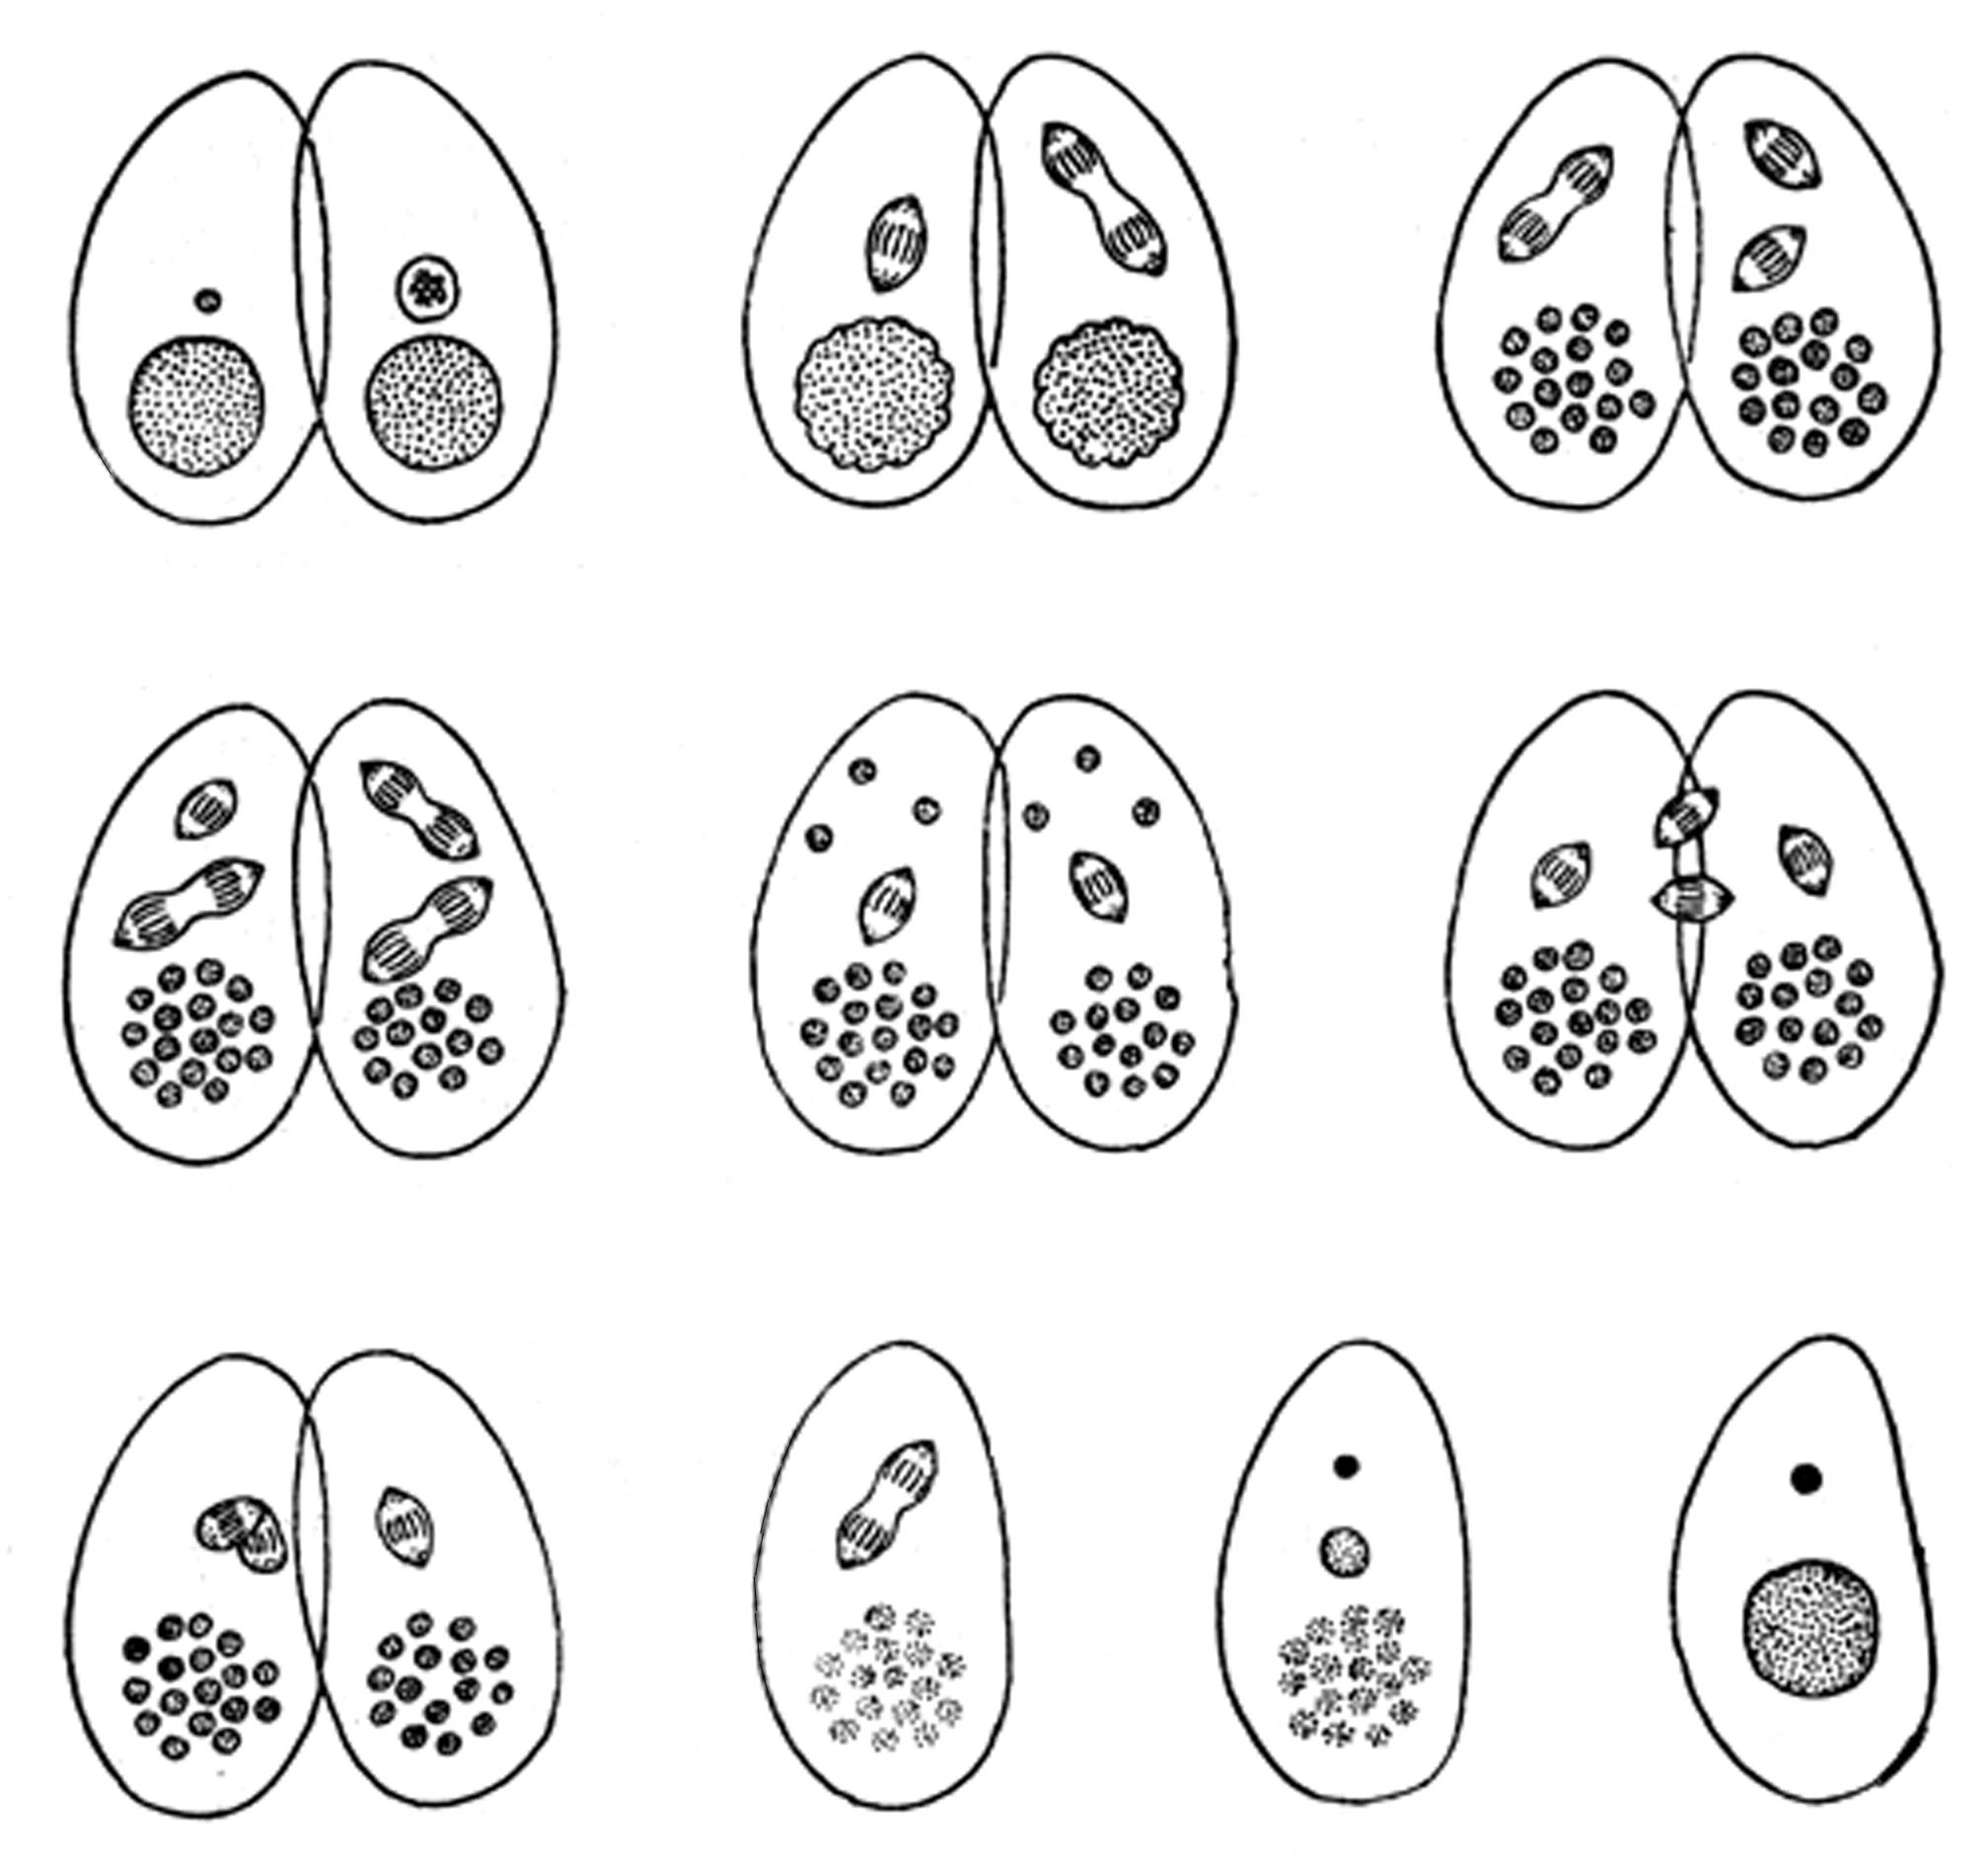
Fig. 2.9. Conjugation of infusoria (schematized). From time to time infusoria have a special and extremely peculiar form of sexual reproduction - conjugation. Since infusoria have sizes that belong to the right slope of division, the process of exchange of genetic material occurs according to a very complex and tense scheme, which requires infusoria to temporarily “stick together”, i.e. synthesize.
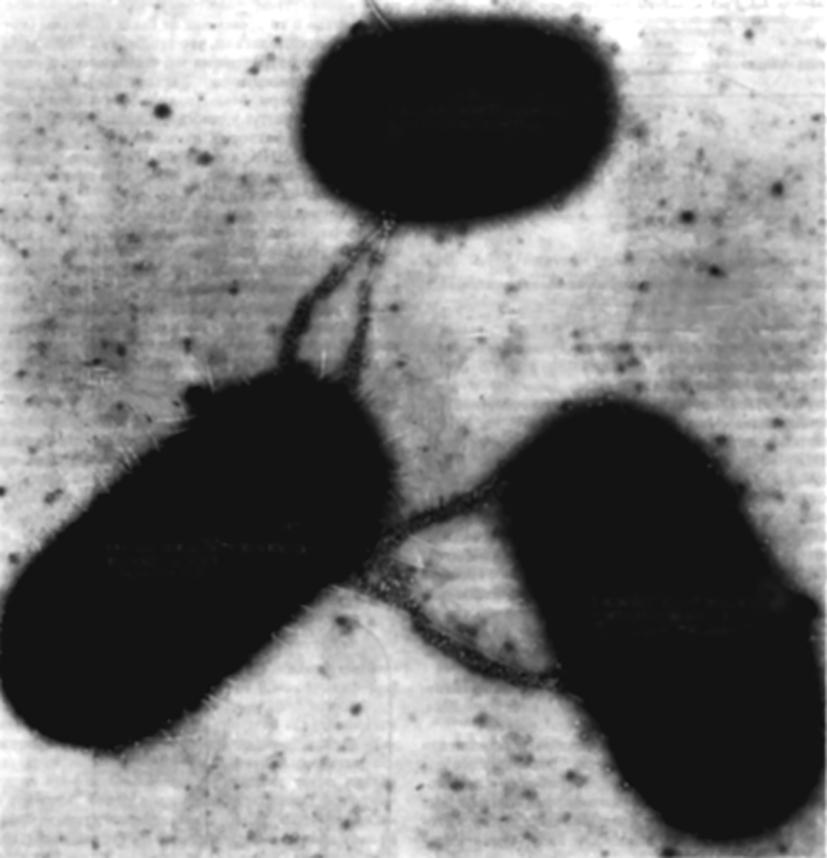
Fig. 2.10. Microphotograph of conjugating bacteria (one “male” and two “female” individuals) obtained with a transmission electron microscope. The scale of the entire field of the process (about 10 µm) is such that it takes place at the lowest point of the stability trough, where synthesis occurs virtually without any structural changes. This is what allows bacteria, unlike infusoria, to “calmly” exchange genetic material. This process resembles the draining of oil from tankers
This same barrier is also a SYNTHESIS BARRIER, as basically only organisms smaller than the barrier are capable of synthesis and subsequent reproduction.
Already for the majority of organisms with the size more than \(10^{-2}\) cm synthesis is not peculiar, and if it occurs, it is in the form of a peculiar sexual act for protozoa, called conjugation - temporary synthesis for exchange of hereditary information from parts of their nuclear apparatuses (see Fig. 2.9).
“The two infusoria come close together, are closely attached to each other, and in this form swim together for quite a long time… Then the conjugates separate “ 7.
Conjugation cannot be attributed to a full synthesis according to item #2 (see page 256), it is like a quasi-synthesis, which is manifested as mating on the right slope of S-Trough #6.
Indeed, for infusoria, conjugation is restricted to individuals larger than 1.6 \(\cdot 10^{-2}\) cm, i.e., on the right slope of the S-Trough.
It is noteworthy that for bacteria, conjugation occurs according to a different scheme 8, reminiscent of oil draining from tankers (see Fig. 2.10). Thus, while infusoria “embrace” in a passionate impulse (otherwise, the synthesis process cannot be held on the right slope), bacteria calmly exchange hereditary material, because on the left slope synthesis proceeds simply and without tension. Let us give some concrete examples of the existence of division-Synthesis BARRIERS among protozoa.
-
Ichthyophthirius infusoria grows and, only after reaching a size of about 0.1 cm, begin successive divisions 9.
-
Sporozoites of the coccidia, with average lengths of less than \(10^{-3}\) cm, grow and divide into several spores when they reach a size of 3 \(\cdot 10^{-3}\) cm. The development of blood sporozoites is approximately the same 10.
-
In gregarines of various kinds, a macrogamete with a maximum size of (0.35 - 0.7) \(\cdot 10^{-3}\) cm fuses with a microgamete (0.35 \(\cdot 10^{-3}\) cm), the newly formed body grows to the oocyte stage (more than 3 \(\cdot 10^{-3}\) cm) and only then experiences repeated division.
Analyzing the process of reproduction of unicellular cells, we come to the following CONCLUSION.Unicellular cells, which have sizes larger than the synthesis-division BARRIER (CDB) (average value - 3 \(\cdot 10^{-3}\) cm), do not increase in size before division, they seem to already have the potential to divide. In this variant, daughter cells grow after division to the size of the original mother cell.
Unicellular cells, which are less than \(10^{-3}\) cm in size, usually grow to sizes greater than 3 \(\cdot 10^{-3}\) cm before the act of division itself. The products of their division are immediately formed of the “right” size for subsequent life activity (see Fig. 2.11).
So, those of the protozoa whose size is less than the division threshold grow before division, those of the protozoa whose size is greater than the division threshold grow after division. However, in both cases, the size of the fissile system at the moment of division is greater than the SYNTHESIS- division BARRIER.
No protozoan cells BETWEEN the assembled form any complex systems.
There is no joining together of individual adult and independent cells in nature. Figuratively speaking, individual cells are “individualists.”
Colonies of protozoa, which sometimes reach a very respectable size (for example, the colonies of Volvox gloobator includes up to 20 thousand individual cells, their size reaches 2 mm), are always formed as a result of “sexless reproduction by division, in which the products of division remain associated with each other “ 11.
Here we should note the terminological inconsistency of the concept of colony for protozoa and for social systems. In the latter case, colonies are most often formed through colonization - the process of settling, assembling, joining different individuals into one geographical space. Nothing of the sort is observed in the world of protozoa. There is no assembly and connection, cells create colonies by dividing mother individuals without detaching “children” from them.
MULTICELLULAR CELLS. The growth process inherent in cells always has its limit - it is either death or division with the formation of new cells.
The process of cell reproduction occurs only by dividing cells into two or more parts. There are several types of division: amitosis, mitosis and meiosis (listed in order of complexity). Each type of division carries a specific burden in the life of an organism.
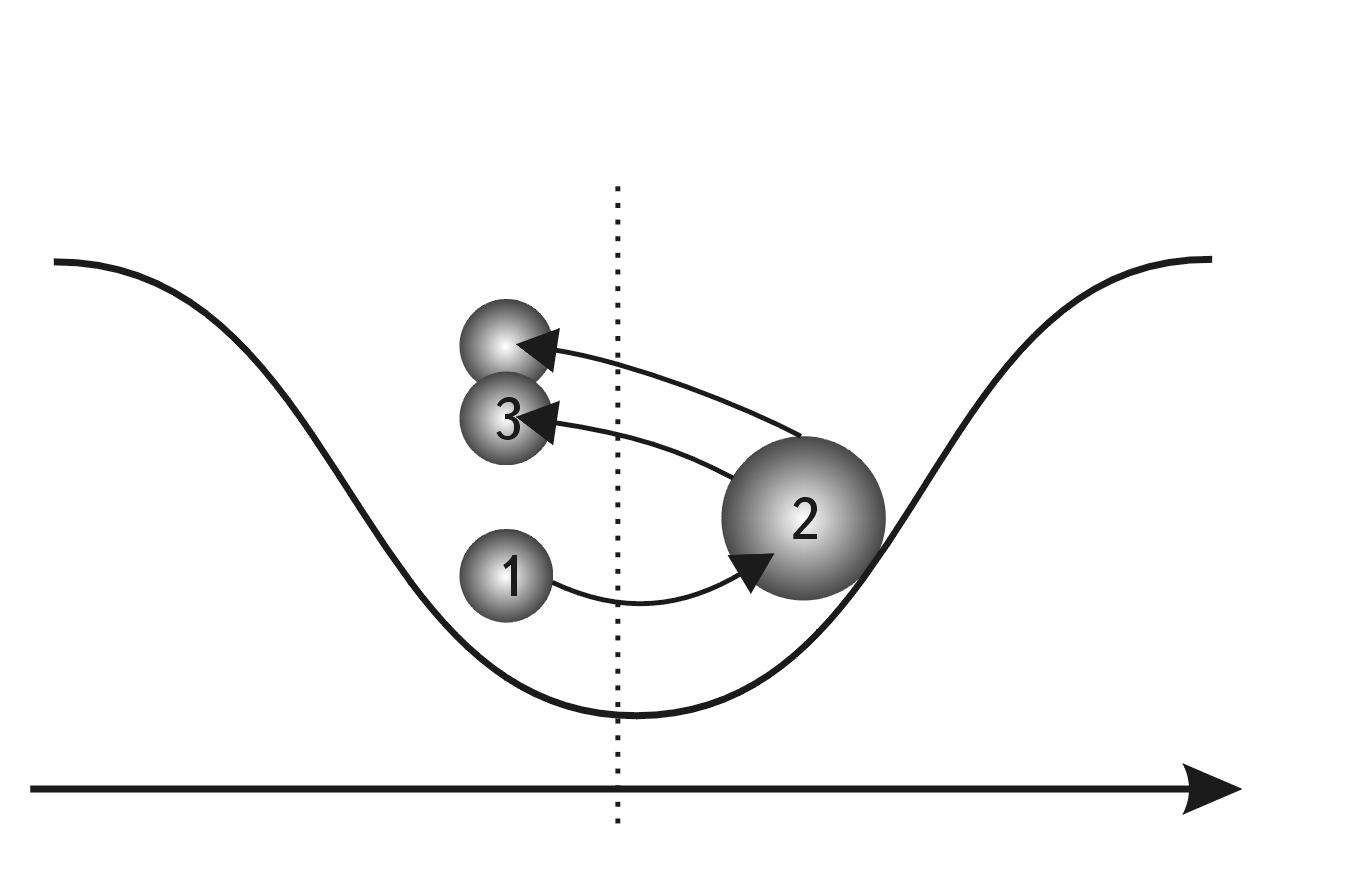
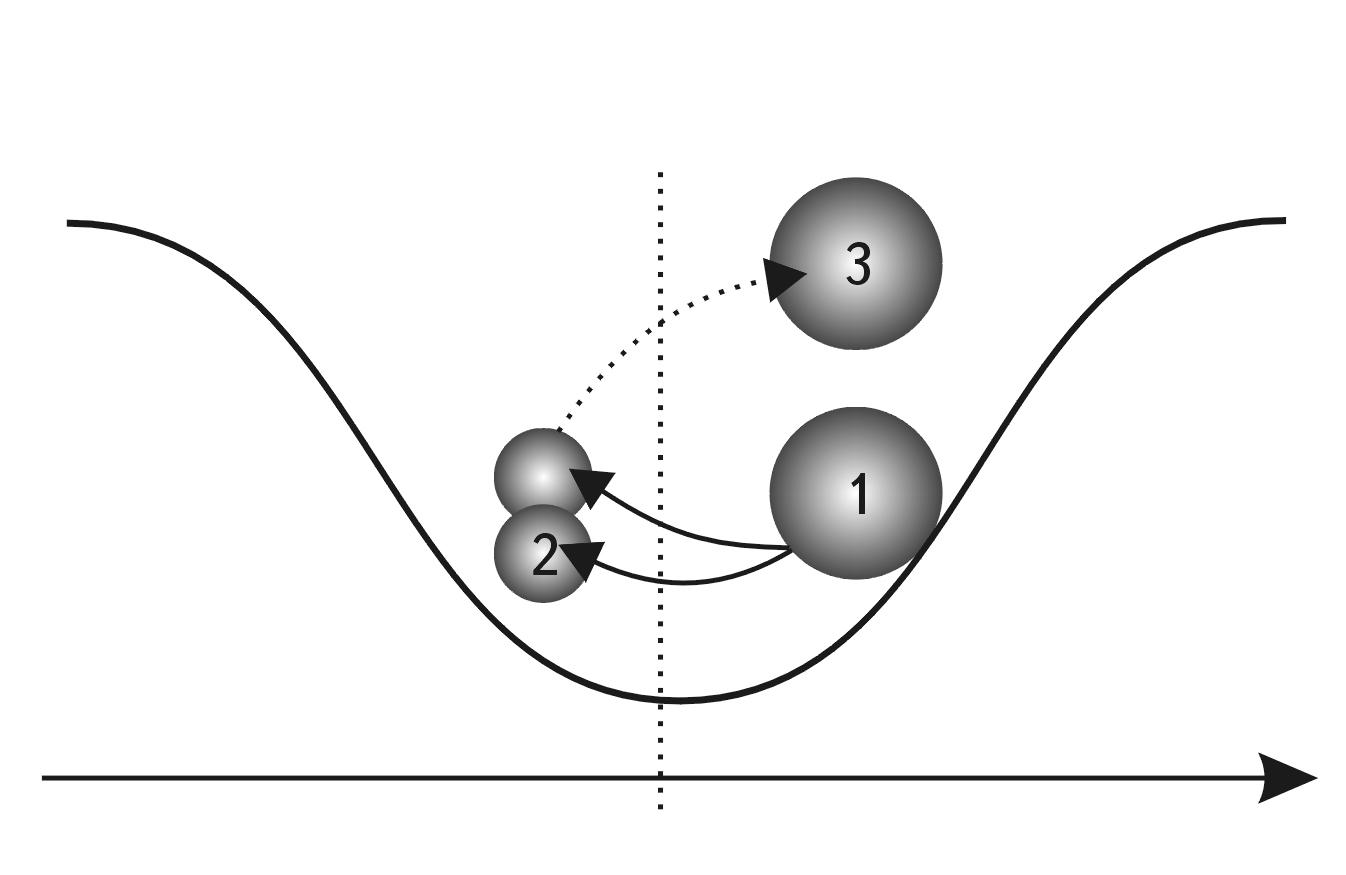
Fig. 2.11. Two types of cell division process. А. If a cell is smaller than the SD barrier, it first grows (1-2) to a size that exceeds the SD barrier before dividing, then divides (2-3) to its original size and continues to function at that size thereafter (3). B. If a cell is larger than the SD barrier in its normal state, it does not grow before division. The process of division occurs (1-2), and then the resulting “fragments” grow back to the original normal state (2-3).
Despite the fact that all types of division are characterized by their morphological and functional peculiarities, they have similar features, so we are able to make some generalizing conclusions.
The most studied and most common type of division in multicellular organisms is mitosis. It occupies approximately 4% of the life cycle time of cells capable of division 12. Mitosis is preceded by growth in the size of the nucleus and the cell itself. This growth is, according to most scientists, the main cause of division.
Thus, for example, “on bone marrow smears of healthy people and people with various disorders of hematopoiesis… in the norm, the division of maternal cells occurs only after the cell reaches the optimal size (diameter 18-19 microns)… (emphasis mine - S. S.) Sometimes… at hyperfunction of hematopoietic organs the cells do not reach the optimal size, and their division completely stops.” 13.
Analysis of the work of the famous American cytologist D. Mezia 14 has shown that the characteristic size of cells during division is (3…6) \(\cdot 10^{-3}\) cm, and the divergence of chromosomes occurs at distances of (1…5) × \(10^{-3}\) cm. Consequently, for cells of multicellular organisms, the minimum threshold of division is the size of 10 μm, but, most likely, normal division always begins at 30 μm and above.
D. Mezia himself summarizes the data considered in the following way: “All these experiments seem to indicate that a cell must reach a certain critical mass before it can divide… Cells are incapable of further division and die when their size exceeds the critical minimum.” 15
However, D. Mezia is very uncertain about the specific value of this minimum. This once again indicates that the question of the threshold of division (synthesis) in cytology, judging by the data available to the author, has not been studied to the end. We see that it is of fundamental importance, especially since for S-TroughNo. 6 this barrier is closely related to the scale center of the Universe.
But the most striking thing is that in cytology the true cause of division has not yet been determined. For at first sight the cell has no reason to enter into such a complex and unnatural process for its whole life as division into two parts. Purely speculatively, it could grow to a substantially larger size, perfecting its internal structure and increasing its mass. So why did evolution put a barrier to this process of cell growth by synthesis at a threshold of about 30 microns? Why didn’t nature create meter-sized living systems in the form of a giant cell with developed external and internal structures? It is impossible to say that the cell lacks a reserve of informational complexity, because the processes going on in the cell amaze the imagination with the virtuosity of nature, and they are by no means simpler than the processes going on in multicellular systems. Why did Nature put a BARRIER for these systems at the lowest point of S-Trough of Potential stability #6?
The complexity of the answer to this question in modern biology is quite understandable. Biologists cannot imagine, around what important barrier to the Universe all this “purely biological” controversy takes place. It is impossible to guess that a growing cell reaches the size of the MASSIVE CENTER OF THE UNIVERSE and then passes from the large-scale zone of dominant ALLENSE SYNTHESIS to the large-scale zone of dominant ALLENSE division, if we rely solely on biological data. Here only the PRINCIPLE OF MASSIVE SUBJECT helps, which allows to transfer the regularities of synthesis-division of atomic nuclei through 10 orders to the zone of synthesis-division of biological systems. Let’s return to the synthesis-division BARRIER. Consideration of the totality of cytological data leads to the impression that cell division (under all changing external conditions) occurs almost always at the boundary of the transition from synthesis to division, at the lowest point of SWS #6. If the initial cell has very large dimensions and, as a consequence, is removed along the S-axis from the BARRIER C-D zone very far to the right, it divides according to a different scheme. Here the fragmentation of the fertilized cell is very indicative. When the size of the ovum is close to \(10^{-2}\) cm, it divides into two, four, eight, etc. parts each. During the process of fragmentation, the egg does not increase in size, but divides into increasingly smaller cells. The number of cells reaches several hundred or thousands during the period of crushing 16. Synchronous fragmentation with size reduction apparently ends when the cells reach the lower division-synthesis threshold of 10...16 µm. Figuratively speaking, the oocyte rolls down the right slope to the lowest point of stability of the S-trough, after which the process of development through division becomes impossible.
For even smaller systems, development is only possible by synthesis. The pattern of fragmentation of very large oocytes is even more different. They mostly do not divide into large halves, but their body is literally fragmented (Fig. 2.12 17), the emerging new cells having sizes close to 100 µm. For the largest oocytes (Fig. 2.13 18), division essentially becomes a separation of small cells from the egg; it does not follow the pattern of two, four, eight. The appearance of small cells in this case is a vivid example of the fact that the most active natural division zone is very close to the division-synthesis threshold on the SW model.
Consequently, regardless of the initial size of the oocyte, the very process of division takes place in the same size zone: 10…100 microns, i.e. in the range of ICV and in the lowest part of the potential stability trough #6.
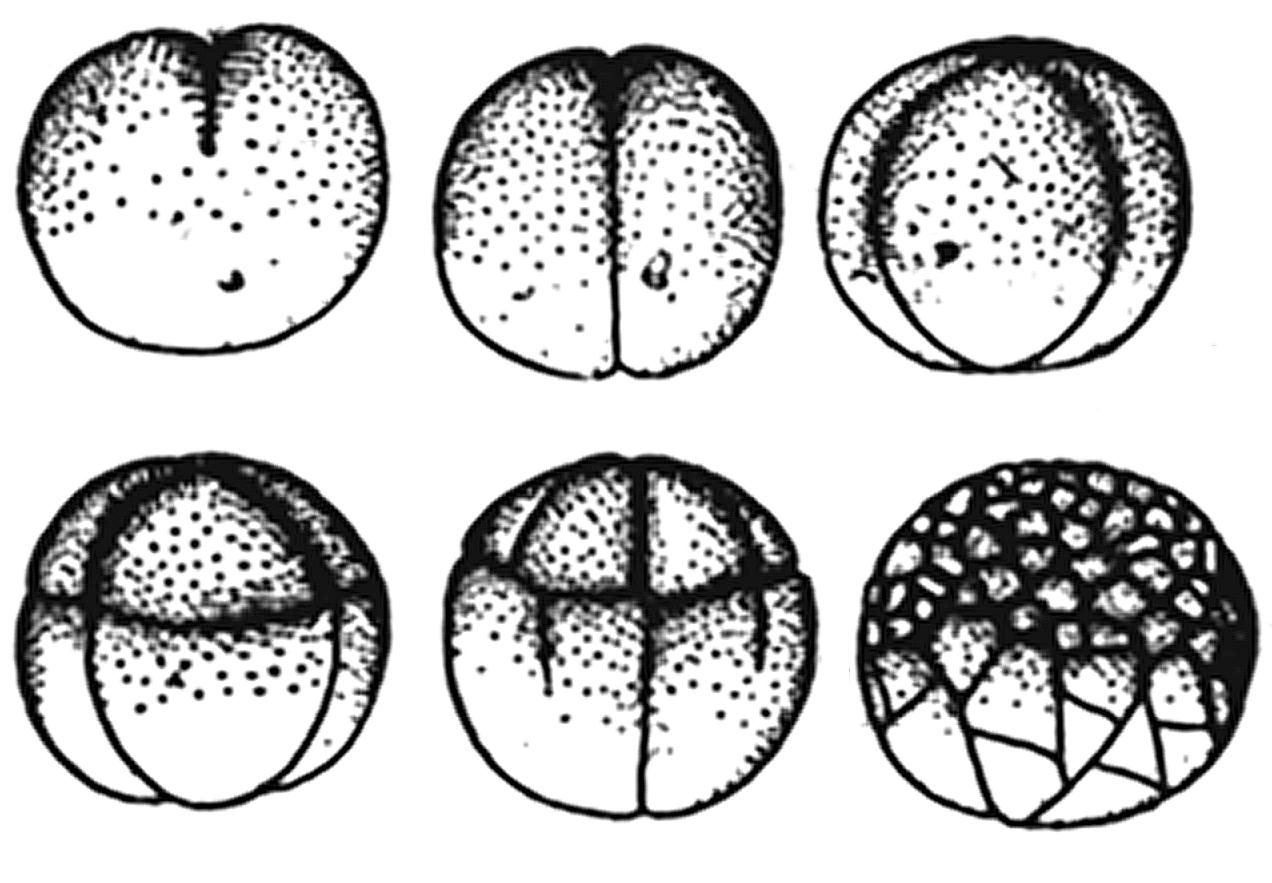 Fig. 2.12. Uneven (starting from the third crushing) crushing of a frog egg. Unevenness crushing is explained in the model by the fact that the egg is much larger than the average cell size
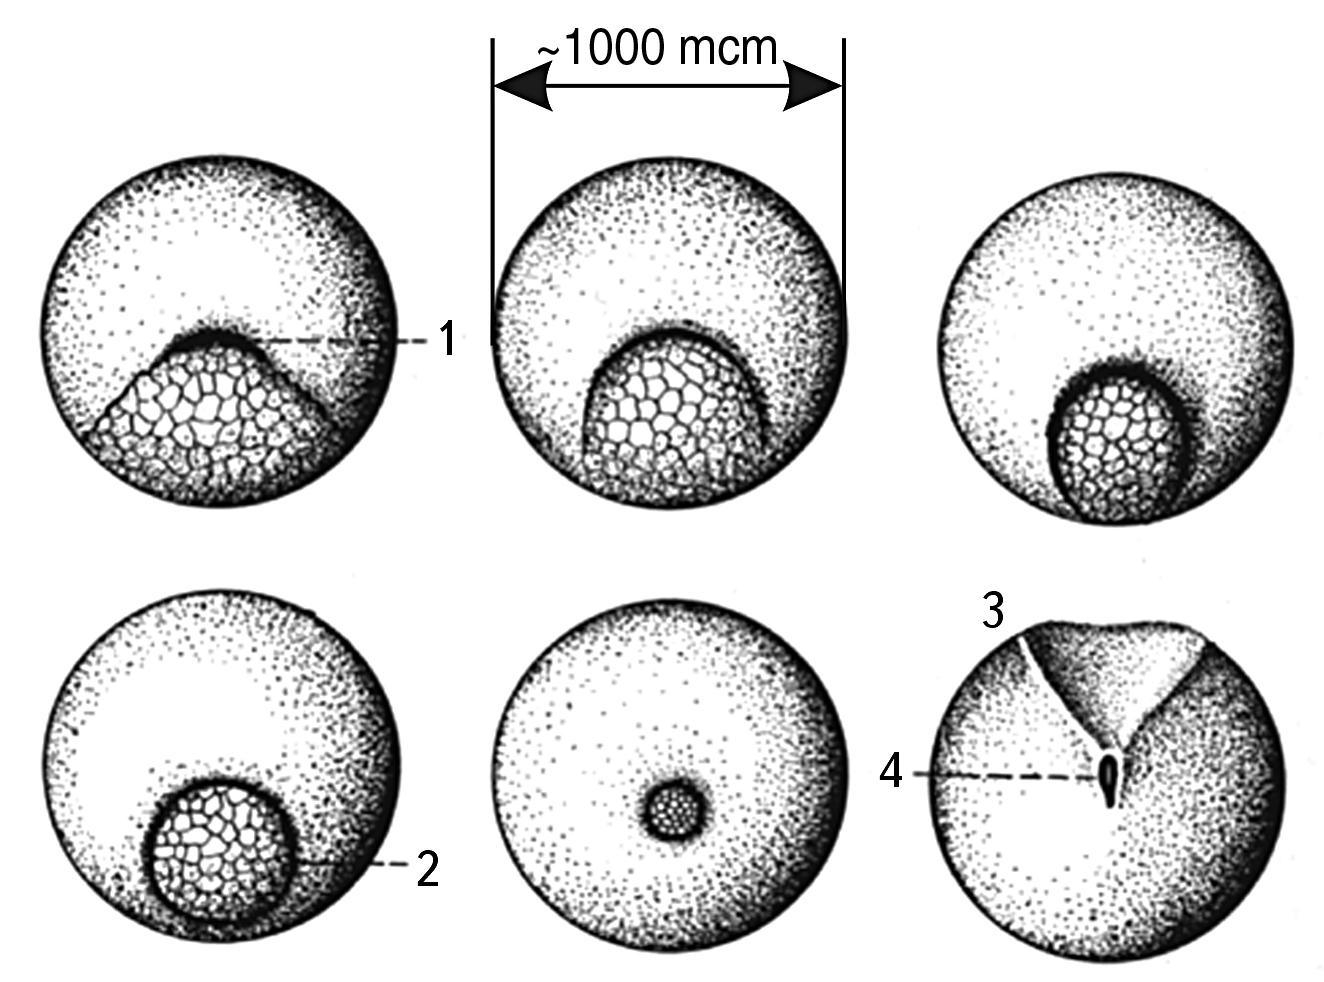 Fig. 2.13. Sequential stages of amphibian gastrulation 19.
The figure shows that the emerging cells have sizes much smaller than the primary germ cell. This indicates that the division occurs in the size zone close to 10-100 µm
Thus, we have shown that cell division of multicellular organisms occurs only on the right slope of S-trough No. 6 and mainly in the lower part of this slope.
Let us now consider some peculiarities of the division and synthesis of sex cells.
To start the process of division of different types it is necessary to gain different “height” in M-NAME. This takes different time. At the same time, nature does not need to include any special stimulants for simple division: the cell grows naturally and having “climbed” just above the division threshold, divides into two parts. This is not the case with the division of a sex cell. Here nature needs to “roll” the cell to a higher potential level so that before fertilization it does not start dividing, and after fertilization it can experience division up to several thousand times until the size of all cells “descends” to the minimum possible threshold.
“A small somatic cell 10-20 µm in diameter would normally take about a day to double in mass in preparation for division. The same cell, at the same rates of macromolecule synthesis, would take a very long time to reach a thousand times the mass characteristic of a mammalian egg (100 µm diameter) or a million times the mass of an insect egg (1000 µm diameter). It is clear that their oocytes must have special mechanisms to achieve such large sizes “ 20. We can add: and special mechanisms that inhibit division until the right moment.
The male germ cell has the exact opposite task. It needs to fuse with a female germ cell. As already mentioned, cells in general are not characterized by the process of synthesis. The only exception is the case of sexual reproduction, when the sperm literally pierces the shell of the ovum and its nucleus fuses with its nucleus (see Fig. 1.6). Let us verify our PROPOSITION that synthesis takes place only when the size of objects is smaller than the C-D threshold.
If nature “knows” about the S-Trough of Potential stability and the synthesis-separation barrier, then in order for the synthesis process to proceed actively and surely, the male sex cell must “roll up” to the opposite left slope of the M-trough before fertilization. This does occur during the process of spermatogenesis. The initial male and female sex cells have the same size. Then nature triggers different preparation processes: female cells grow in size, while male cells, on the contrary, shrink. “Haploid cells that fuse at fertilization are called gametes. In a typical case, two types of gametes are formed: large, immobile oocytes (or eggs) and small, mobile sperm (or spermatozoa.) “21
Figuratively speaking, nature takes initial cells of approximately the same size, then spreads them out from the synthesis-division barrier to the left and right by a distance of several orders of magnitude** and only then lets them go, after which they roll up to the center of highest stability in M-NAME #6.
As a result, the synthesis of two germ cells always proceeds in such a way that one of them (male) is on the left slope of the S-Trough, in the size zone of allowed synthesis. Example: a human spermatozoon, its main part is very small (see Fig. 1.6) (the length of the spermatozoon is not a characteristic size, since the tail performs the function of a transport agent and is discarded at the moment of synthesis like a spent stage in a rocket). Despite the enormous variation in the size of the animals themselves, the length of their spermatozoa differs very little and is practically unrelated to body size. For example, the length of spermatozoa22:
- sperm whale - 4.1 \(\cdot 10^{-3}\) cm;
- foxes - 5.3 \(\cdot 10^{-3}\) cm;
- elephant - 5 \(\cdot 10^{-3}\) centimeters;
- of a human being is 5.3 \(\cdot 10^{-3}\) cm;
- mice - 8 \(\cdot 10^{-3}\) cm;
The size of the head, the main body of the spermatozoon, is much smaller. For humans, they are 4-6 microns, or ~5 \(\cdot 10^{-4}\) cm. While the egg is the largest cell in the body, the sperm (or spermatozoon) is usually smaller than all other cells. Its head is practically the smallest in the body. Here, nature has not spared on reliability: sizes of 4-8 μm belong, in full accordance with the requirement of the dynamic SW model, to very stable synthesis sizes.
So, as we assumed, based on the similarity with S-trough No. 4, the SYNTHESIS-DIVISION THRESHOLD is clearly manifested in the 10-100 MCM size range.
This barrier is likely to have a double or even triple structure: 16-18 μm, 30-35 μm, 45-50 μm; it is possible that these three barriers relate to mitosis, amitosis, and meiosis, respectively.
Systems with sizes up to this barrier can evolve and grow only through synthesis, with sizes after it - only through division. Proceeding from this assumption, going to the right from this barrier up the right slope of S-Trough, we should theoretically encounter only evolution through division. Going to the left - evolution through synthesis. The author has no opportunity to analyze in depth and in detail the subtleties of this process in biology. We will give here only a cursory and fragmentary analysis of some indicative facts.
RIGHT SLOPE OF S-Trough of Potential stability #6. If we analyze the process of reproduction and growth of multicellular organisms, the whole right slope of S-trough No. 6 provides us with examples of division only. Passing mentally to the right of the synthesis-division barrier, one can find an example of budding of new individuals from a hydra, even to the right - scale coordinates for egg and larvae laying in insects, genera - in viviparous animals, etc. It is obvious that in all cases the final stage in the process of emergence of a new creature is division (for unicellular) or separation from the mother body (for multicellular). It is already quite obvious that on the right slope of the S-Trough there is no synthesis of two individuals into a new whole. Nature has left all evolutionary processes of synthesis behind the barrier (on the left). synthesis on the right slope is possible only as a temporary act (e.g., sexual).
LEFT SLOPE OF S-Trough of Potential stability #6. Here, the formation of new systems mainly proceeds by synthesis.
Although the division mechanism is also often used as a preliminary preparation for it. But, most likely, the division always takes place in the dimensional zone of the stability saddle: from 1 to 10 angstroms (see Fig. 2.7).
Biosystems in this range include such biomolecules as DNA, proteins, as well as viruses, bacteria, and intracellular organelles.
Proteins and nucleic acids. Proteins make up about 50% of the dry body weight of all organisms, and they are organized in a very hierarchical way: they have secondary, tertiary and quaternary structures23. The primary polypeptide chains of proteins are synthesized on a “conveyor belt” in ribosomes (which are about 200 angstroms in size) by assembly.
“Protein biosynthesis is a multistep process, it is carried out with the participation of many organoids of the cell: nucleus, ribosomes, mitochondria, various types of nucleic acids, ATP and other compounds.
The protein synthesizing machinery of the cell works in an extremely coherent manner in both space and time. It is controlled and regulated by a highly sophisticated biological cybernetic system… “24
Synthesis is so natural on the left-hand slope that even proteins artificially fragmented into several levels are reassembled into a whole without losing their original properties after certain conditions are created. “It has been found that a large molecule of protein of one species of snail with a molecular weight of 574,000 breaks up when the solution is alkalized, first into halves, then into eighths, and then into sixteenths of a fraction, i.e. into its constituent subunits (‘blocks’). If such a solution is acidified, the subunits which have been broken up are reassembled and associated into a whole.”25
It is impossible to imagine such a process with a multicellular system. If we divide any organism into cells, a spontaneous return to the initial state is unbelievable. This once again demonstrates that SYNTHESIS DOMINISES ON THE LEFT SLOPE, and DEVISON ON THE RIGHT SLOPE.
“It is important to note that each of the previous structures of a protein predetermines the subsequent one: primary to secondary, secondary to tertiary, and so on. And what comes next? And further protein molecules with tertiary structure can unite by so-called self-assembly into associations of quaternary structure (italics mine - S. S.) of even higher level of organization. It should be said that simple molecules, the so-called protomers, i.e. amino acids of proteins or nucleotides of nucleic acids, acquire new physical and chemical properties and new biological functions in the process of their transition to higher levels of organization.”26
The above quotation best shows the role of assembly in the formation of macromolecules; the term “self-assembly” itself indicates the energetic benefit of such a process on the left slope. Moreover, this property of self-assembly is characteristic not only for multicellular proteins, but also for virus proteins: “Protein subunits of viruses have an amazing ability to self-assemble and create thus the most diverse protein ensembles of the fourth order with elegant architecture.”27 For the tobacco mosaic virus, such self-assembly results in a shell 180 angstroms in diameter and about 3,000 angstroms long, indicating that the size range from 10 to 3,000 angstroms, or \(10^{-7}\) cm to \(10^{-5}\) cm, is dominated by synthesis as a way of increasing the complexity of structures and building new systems. Synthesis is a key process for the formation of DNA (RNA) as well. However, there are some nuances here. The fact is that before synthesis of a new copy of DNA, the process of division of primary DNA into two strands takes place. Consequently, division and synthesis go side by side here. We remember the rule that the main thing is the final step of the process. Here division is a preparation for the final act - synthesis.
VIRUSES. Viruses have no sex, so they cannot reproduce sexually like higher organisms, nor do they reproduce by division like bacteria or protozoa.
“Nevertheless, viruses reproduce themselves in great numbers… and in such peculiar ways that at one time this phenomenon was called reproduction… During the reproduction of viruses, nucleic acid molecules are copied by biosynthesis, and according to the information contained in them, viral proteins are synthesized “28.
“…The sequence of events leading to the formation of a viral particle is as follows: 1) synthesis of viral protein; 2) ‘protein maturation’; 3) binding of protein to newly formed viral RNA; 4) formation of complete viral particles “29.
So, a virus, unlike a normal cell, does not reproduce by division. It penetrates into another cell, or rather, it injects its genetic material into the cell, then the cell replaces its own DNA with the virus’ DNA, and the cell dies, releasing new viruses that are alien to it. This gruesome scene is very vividly portrayed in some modern sci-fi movies like Aliens. Only there the scale of entities penetrating into a human being is increased a million times, and the principle is similar to the principle of virus reproduction. Hence the horror. In nature, such “synthesis” can not be. It is forbidden. There is a strictly defined scale interval for this kind of process: from \(10^{-6}\) cm to \(10^{-5}\) cm.
All stages of virus reproduction, starting with penetration into the cell, which is somewhat akin to the penetration of the sperm head into the egg cell, is synthesis. However, while in the case of fertilization a rapid process of growth of a multicellular system begins, in the case of virus infection, cell death and a rapid process of growth of single-cell viruses begin.
BACTERIA. Bacteria reproduce by division30, in addition, they have been found to have the simplest sexual reproduction of the conjugation type31. “Under favorable conditions, bacteria grow very rapidly… After reaching a certain size, bacteria switch to sexless reproduction (binary division)… “32
There are plenty of bacterial species that divide at about 1 micron in size, which is at least one order of magnitude left of the division barrier on the S-axis.
Thus, bacteria violate the beautiful regularity of our model - they divide to the left of BARRIER C-D***, in the synthesis zone***. However, this violation only shifts the division barrier to the left of the one order (out of ten) set for all other cells. And this violation is peculiar only to bacteria; the author did not find such exceptions in cells.
It would be possible to accept this deviation (10%) as a model error and write it off as statistical dispersion. But let us not simplify nature and consider the problem of bacterial division more carefully.
First, all autotrophic (independently living) bacteria have a size greater than 10 µm, so their division does not violate the BARRIER rule. Only heterotrophic bacteria violate this rule, i.e. those that do not live in nature independently, but exclusively at the expense of other organisms.
It is these bacteria, which are between \(10^{-4}\) cm and \(10^{-3}\) cm in size (i.e., in the synthesis zone), that violate the general rule.
In the Atlas of the Anatomy of Bacteria Pathogenic to Man and Animals33 one can find examples of division in a great many known bacteria. Almost all of them divide at sizes between 1 and 5 µm, and all of them are smaller than 10 µm.
It is extremely important for us that the multiplication of pathogenic bacteria can not be recognized as an evolutionary process, the process of complication of living systems, because if their multiplication is not stopped, the multicellular organism will die and decompose.
From this we can make a preliminary PREPARATION. Only division to the right of the synthesis-division barrier is an EVOLUTIONAL process for the biosphere; if division occurs to the left of the barrier, in the synthesis zone, it is a pathological, destructive and regressive process.
In addition, the division of pathogenic bacteria takes place inside the organism, on a foreign nutrient medium, so it is most likely a parasitic process. It is energized by the processes occurring in a multicellular organism. Consequently, the division of pathogenic bacteria in the forbidden zone of synthesis can proceed only artificially, due to “exploitation” of processes that do not violate the established regularity.
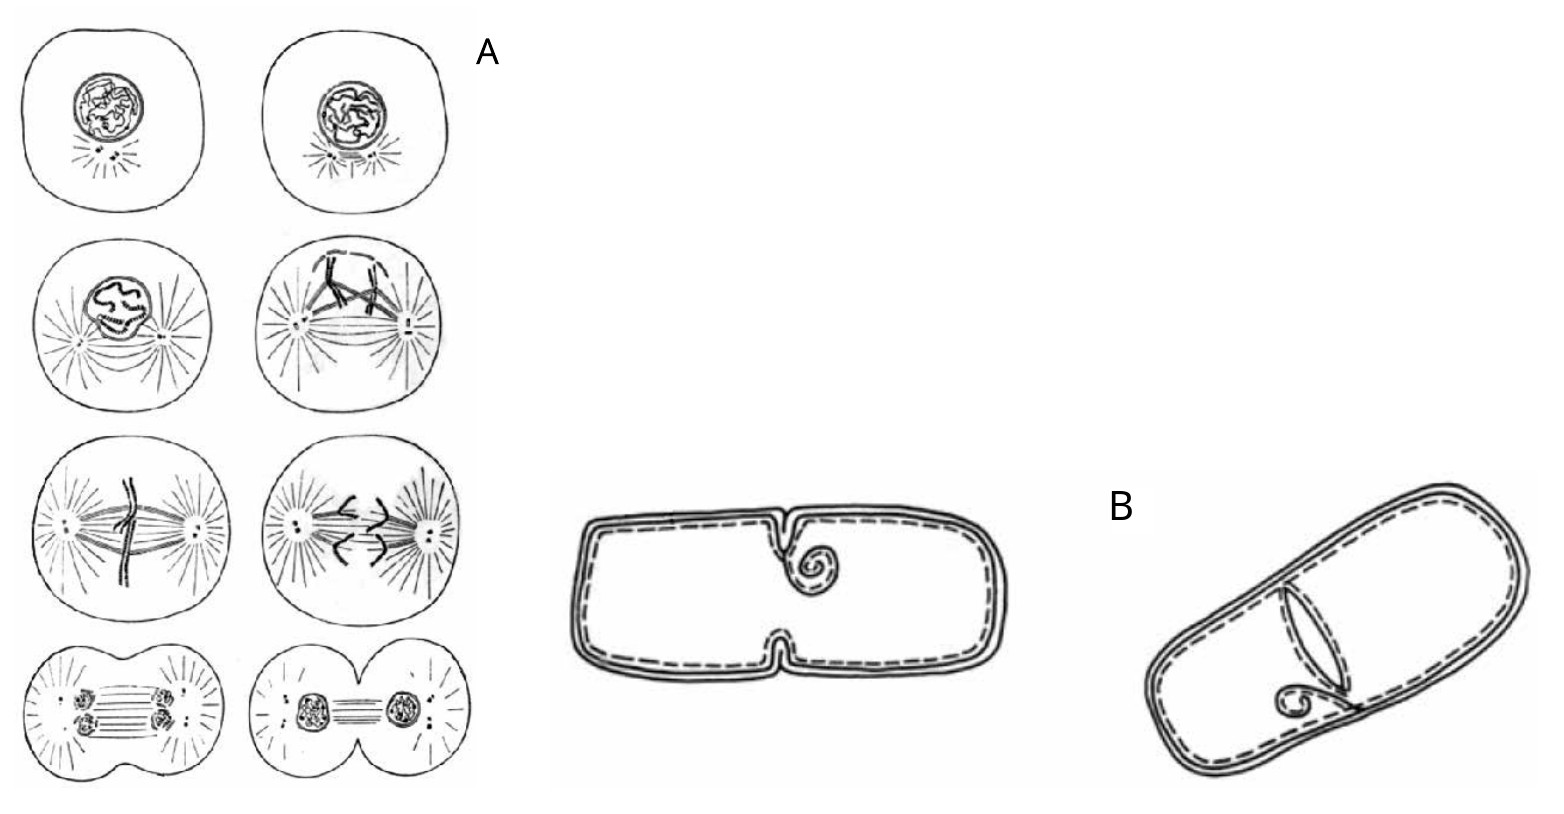 Fig. 2.14. A. Schematic of the successive stages of mitosis. Here we see the gradual formation within the cell of two symmetrical centers, each of which gradually forms into an almost independent cell. And these two cells seem to stretch and tear the mother cell into two parts. B. Scheme of bacterial division. It can be seen that in contrast to mitosis, in which there is a holistic division of the cell into two duplicate halves, in bacteria there is a kind of internal cutting of the cell, due to germination of the “slide” (from stage “a” to stage “b”)
Second, the process of bacteria dividing into two daughter parts is different from the process of cell division (Fig. 2.14 34 35).
Cell mitosis is a process of dividing into two parts of two independent cells prepared for this in advance. We see something different in bacterial division. Inside the mother bacterium, a septum appears on the membrane, which grows and gradually divides the bacterium into two parts. This is similar to the inward movement of a flap inside the bacterium that cuts it in half. It is noteworthy that after such a “cut” the daughter bacteria do not move apart, but stay together, forming long chains. Thus, the process of bacterial division takes place in the FORBIDDEN FOR DEFECTION zone of the S-Trough of Potential stability model.
The easiest thing to do is to recognize that bacteria are an exception to the general rule, especially since they violate it by only 10%. But we can try to find in this exception a logic that only reinforces the rule. This logic consists in recognizing the possibility of cell division in the synthesis zone only as a pathological process, as a parasitic and destructive process.
In addition to the factors listed above, one can PROPOSE that division of micron-sized organisms, such as non-pathogenic bacteria and blue-green algae, occurs only if they are within a metasystem of a large order of size, such as colonies that are larger than 10 microns. Could it be that the energetics of colonies is such that it is the reason why bacteria division occurs on the left slope?
Taking into account the specificity of bacterial division, let us put forward a new HYPOTHESIS.
In addition to the CENTRAL SYNTHESIS-DIVISION THRESHOLD, which lies in the size range of 10-30 µm (rather closer to 16 µm), there are at least TWO other BARRIERS - RIGHT AND LEFT FROM THE MAIN ON S-AXIS.
The left barrier is likely shifted by an order of magnitude, this is close to 1.6 µm. The right barrier is also shifted by an order of magnitude, about 160 µm.
The left barrier is characteristic only for prokaryotic cells. The division in it is clearly degenerate, resembling the snapping of a camera aperture or the entrance of a slide gate.
The right barrier (160 microns, or \(10^{-1.8}\) cm) is characteristic only for the division of sexual oocytes of multicellular cells, which has a cascade, multistage character and ends at the central barrier. The oocytes, as mentioned above, grow for an abnormally long time before division; they seem to climb to a great height of the right slope in order to rush to the lower point of stability by an avalanche of fragmentation after staying for a short time at the right barrier.
The central barrier (16 μm, or \(10^{-2.8}\) cm) is the main barrier; it is characteristic of mitotic division of all eukaryotic cells, which is usually binary. At the same time, the central barrier apparently plays an important functional role in the life of all cell types.
A very important difference in the mechanisms and fundamental patterns of division near these three different barriers should be emphasized: diaphragmatic division near the left barrier, binary division near the central barrier (mitosis), and complex cascade division of the oocyte near the right barrier*.
However, it cannot be excluded that for blue-green algae the central barrier is analogous to the right barrier for oocytes, since they, having climbed beyond it, divide cascade into several parts.
Of course, it is too early to draw final conclusions, since a more thorough study of the scale features of division of all kinds of cells is necessary. It is not excluded that the value of the size from which division exactly begins is not rigidly fixed on the S-axis, but floats along it in the range of a small tolerance. In this case, each barrier represents a statistical distribution curve with a mode on the dimensions noted above. It is possible that each of the main barriers has an “understudy” on the right side, which is defined by the HEV. In this case, the central barrier, located at 16 µm, may have a “neighbor to the right” at 50 µm. It is possible that different cell types (even within the same barrier type) have their own submodal characteristics of large-scale thresholds of synthesis-separation.
The author is convinced that the study of the problem of the synthesis-separation barrier for cells is a separate very extensive area of the laws of nature, which for all fields of science is of great importance, since all these processes take place in the very center of the S-axis of the Universe.
So, on the left slope of S-Trough #6, the complication and development of biosystems proceeds mainly by synthesis**.**
Only the reproduction of pathogenic bacteria and some unicellular species of the same size group remains a big problem for the model.
BONE SYSTEMS. Let us consider what regularities in the synthesis-separation process exist for cosmic systems of nature. Thus, for example, from the practice of grinding mineral materials in order to obtain fine powders it is well known that crushing mineral particles to a threshold of about 10 microns is one energy process, and finer than 10 microns, and especially finer than 1 micron, is already another process. “If it is necessary to have an average size of grinding products larger than 10-15 microns, it is necessary to use dry grinding… In the case of ultrafine grinding, the average size of grinding products 1-0.1 microns can be obtained by using only liquid disperse media… because in dry grinding can occur a significant aggregation (emphasis mine - S. S.) of small particles “36.
Discussion of this problem with G. P. Zaitsev, one of the authors of the mentioned book, convinced me that specialists in the field of mineral materials grinding are well aware of the peculiarity of the transition zone around 10 microns, but never suspected its universal cause. I asked G. P. Zaitsev to write about this phenomenon. I give here his text without changes.
“As shown by the experience of using plasma-chemical titanium nitride powders up to 0.1 microns in size, in the synthesis of oxide-nitride cutting ceramics high degree of tendency to aggregation of such powders in the final product leads to large (up to 20-30 microns) grains of titanium nitride, which in turn reduces the mechanical and operational properties of ceramics. The same effect, although to a lesser extent, is observed with prolonged dry grinding of corundum powders, when the specific surface, despite the increase in grinding time, from a certain time begins to decrease, indicating an increase in the proportion of aggregates in the total mass of the powder”.
So, if up to 10 microns the step-by-step crushing of fractions occurs according to the standard scheme: each unit of newly formed surface requires approximately the same amount of energy and time, then at the transition to the size zone of less than 10 microns the time and energy costs for the formation of a new surface (further crushing) grow nonlinearly. Moreover, in this size zone particles in the process of grinding begin to stick together into conglomerates, which, of course, prevents their further crushing. It is also very indicative that micron and submicron powders obtained by plasma-chemical synthesis clump into rather symmetric conglomerates of 20-30 microns in size, which are located exactly at the bottom of S-Trough #6.
The process of aggregation, adhesion and assembly of material particles on the left slope of S-trough No. 6 is a phenomenon universal to nature, not specifically technical. Many examples can be given here, but we will limit ourselves to two.
Particles in outer space often form aggregates as small as 40 microns. “…Lunar dust particles are charged and have stable internal electric polarization. As a consequence, grains in lunar samples are attracted to each other…forming stable groups. This phenomenon is probably characteristic of all solids exposed to radiation in outer space “37 (see Figure 2.15).
Second example. On the surface of the Earth in natural conditions there is a continuous process of rock destruction. Due to temperature variations and the effects of moisture and water, rocks crumble and turn gradually into sand. If you look at old mountains, it becomes obvious that pieces of rock are gradually breaking down, decreasing in size and “rolling” from the right slope of S-Trough to the left until they reach the size of grains of sand. The sand grains are of various sizes, but are mostly tens of microns.
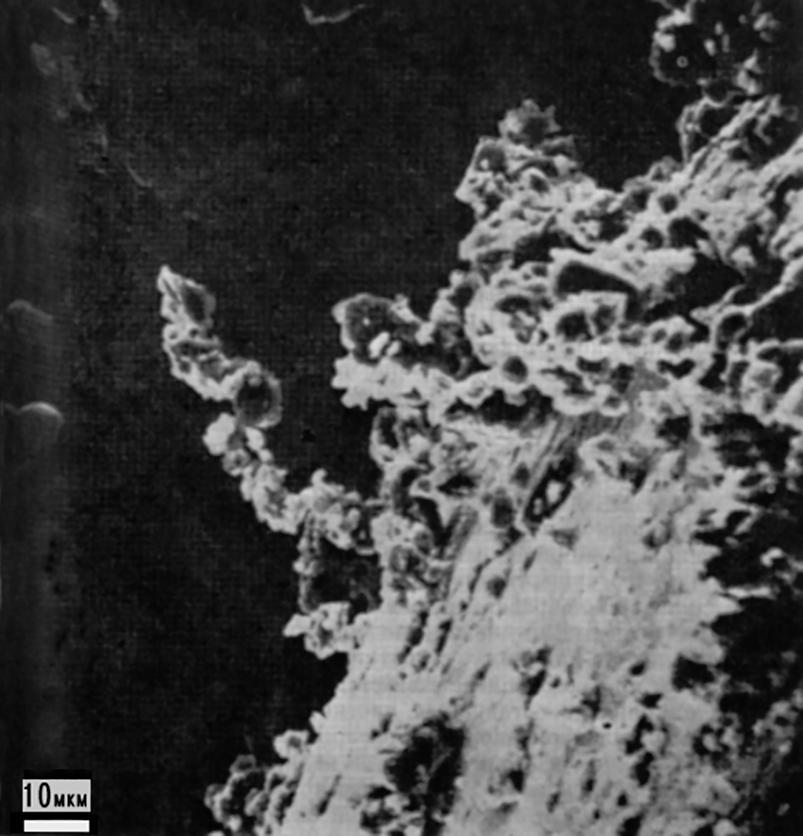 Fig. 2.15. A cluster of cosmic particles in the form of a flexible chain extending about 40 µm from the base of the aggregate. The chain-like structure illustrates the electric dipole nature of individual microparticles. This photo shows an example of natural sticking (synthesis) of particles smaller than 10 microns in outer space
If there were no kink in this scale region and the right slope of S-Trough had an extension into a region of much smaller dimensions, all grains of sand would gradually continue their way to the left and would turn first into the smallest dust, then into powder, then into molecules and, finally, would disintegrate into atoms (see Fig. 2.16). Then all the old mountains would have “vaporized” long ago. Obviously, some fundamental principle of nature prevents this from happening. We BELIEVE that the reason preventing the “mountains from evaporating” is the presence of a barrier for the division process in the 10 MCM zone, to the left of which the decay process is reversed and the directly opposite process of synthesis comes into play.
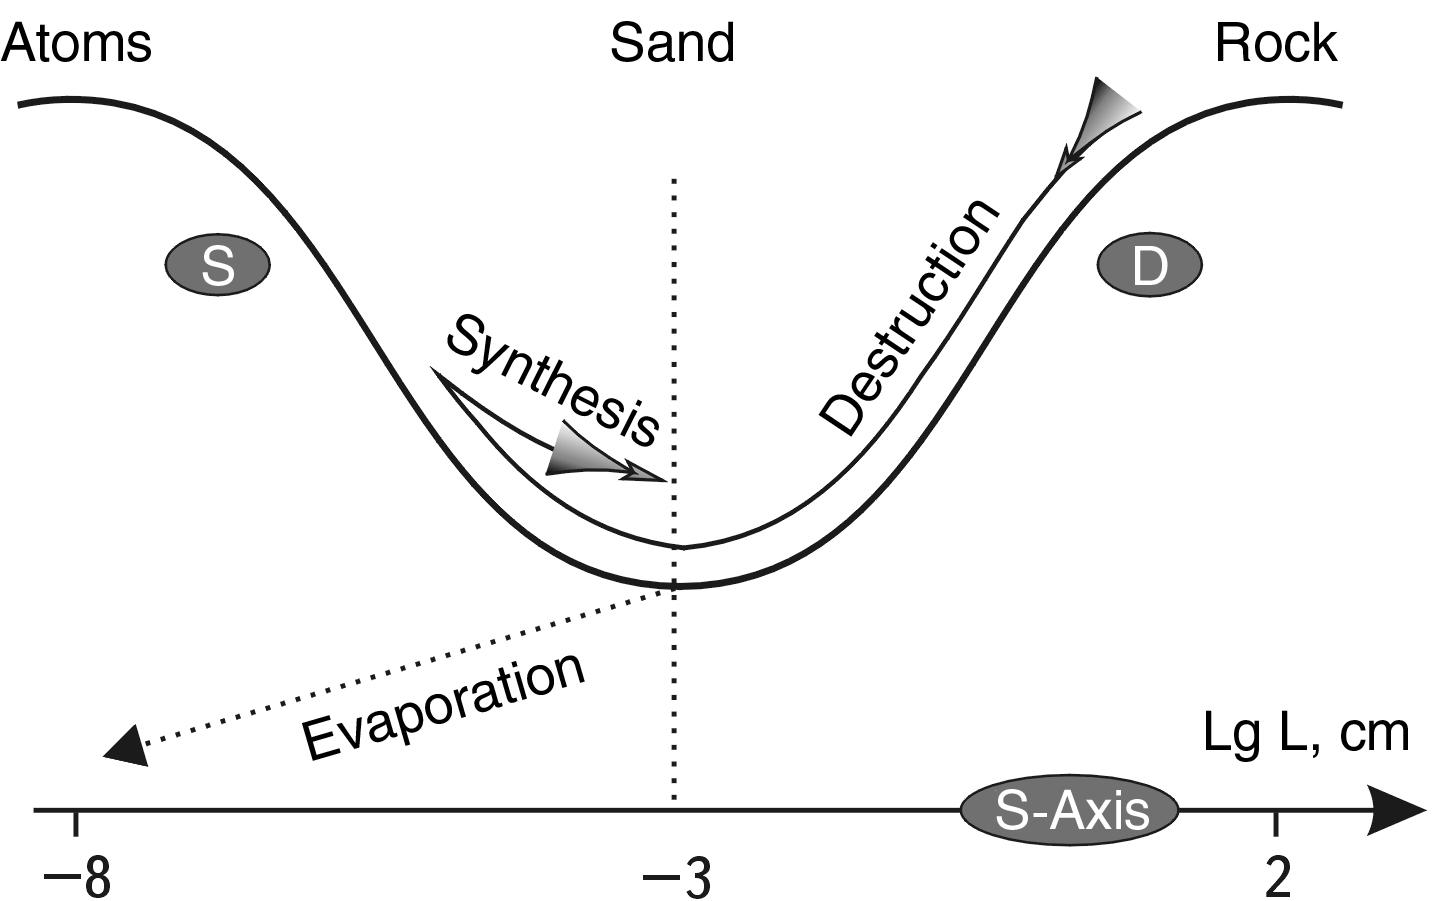 Fig. 2.16. The rock is destroyed under the influence of natural factors, gradually turning into stones, gravel, sand, dust. The dotted line shows its further hypothetical path - destruction down to atoms (evaporation), which does not occur due to the presence of a kink in the potential stability trough in the size region of about 10 µm. Dust particles that have reached the left slope of the trough begin a reverse movement in phase space, clumping together into sedimentary rocks
Thus, the entire geological history of the Earth gives us an example confirming the adequacy of the M-NAME MODEL #6 to the real processes occurring in Nature. So, it is clear that for both living and cosmic systems the potential M-NAME of stability No. 6 is a good model showing how the natural tendencies of synthesis and division processes differ on the S-axis. The left slope of natural synthesis of systems and the right slope of natural division of systems are clearly distinguished. The lower part of the S-Troughis the zone of transition from synthesis to division and the zone of greatest stability for all systems of this size range.
*S-Trough of Potential stability # 8 [2; 7; 12].
This S-Trough has the lower most stable part in the region of sizes \(10^{7}\)-\(10^{8}\) cm (100-1000 km). It is along these dimensions that BARRIER C-D should pass. The left slope starts at \(10^{2}\) cm, the right slope ends in the size region of \(10^{12}\) cm (see Fig. 1.7). Such dimensions are characteristic of space bodies of the Solar System, blocks of the Earth’s crust, biocenoses and social systems.
As we enter the region of macroscales transitioning to megascales, we find ourselves in a less informed position than in the previous STS regions. The processes going on with objects of this size tend to be much more protracted, and therefore their analysis is less reliable. Many views of synthesis or division in a world of this size are speculative or theoretical, and there are often views in direct opposition as to whether synthesis or division results in any new systems. The energetics of the processes here are even more difficult to define. All of this leads the author to caution that the analysis of this and subsequent STSs are merely preliminary sketches, not even intended as definitive generalizations, let alone any statements.
SPACE SYSTEMS. There are still discussions and new theories about the formation of the solar system planets, asteroids and meteorites. In the most general form, they can be divided into theories of assembly (compression) and theories of fragmentation (fragmentation, separation). In this connection, let us consider how different theories gravitating toward synthesis or toward division relate in this area. Recall that we are primarily interested in the evolution of the formation of bodies from meteorites to the major planets of the solar system.
“…The hypothesis of the origin of planets and satellites as a result of gravitational collapse of a gas cloud is unacceptable. This forces us to turn to an alternative assumption, namely the gradual accretion of solid bodies (embryos or planetesimals) from dispersed matter (dust and gas). This process is often called planetesimal accretion; this qualitative concept dates back to the 18th century… According to this hypothesis, the growth of planets and satellites occurred as a result of the impact with their surface of a stream of embryos and grains until the bodies reached the presently observed size. A number of direct observations confirm this assumption. The crater-rich surfaces of the Moon, Mars, its satellites, and Mercury testify in favor of accretion by impact … Direct observational evidence of aggregations of grains in outer space … shows that many of the grains now constituting meteorites arose by condensation as individual particles ….
With the help of irradiation dose measurements, it can be shown that following the existence of isolated particles, groups of loosely (probably electrostatically) held grains existed for a long time. These groups, in turn, testify to alternating processes of fragmentation and accretion, which took place before the transition to the state of closer precursors of meteorites - bodies of several meters in size… “38
This quotation gives much information about the importance of distinguishing between the processes of synthesis (accretion) and division (fragmentation) in the evolutionary origin of planets and satellites.
The hypothesis of planetary accretion has a weak point. “As Safronov has shown… the time it takes for most grains to be captured in the vicinity of Neptune and Pluto is several times the age of the solar system. From this he concludes that Neptune, for example, captured only a small fraction of the matter concentrated in its surroundings. The remainder of the matter is assumed to continue to exist in a dispersed state. This is not very likely. “39 Unlikely because if it were, an asteroidal ring could be found around Neptune with a mass several times greater than the planet itself. Since this is not the case, the accretion hypothesis cannot explain everything in the processes of planet formation. Saving it, the famous scientists H. Alven and G. Arrhenius put forward the idea of jet streams, which accelerate the accretion process.
It is also possible to assume another, that the strongest catalyst of accretion was periodic ejections of planetary embryos from the Sun, about the possibility of which writes A. E. Khodkov40. Such “births” of planets from the interior of the Sun are quite allowed by the S-Trough of Potential stability model. The resetting of the shell or the ejection of the embryo in the form of a clot of matter could initiate the process of accretion, i.e., the growth of the embryo due to the accumulated around the Sun “nutritious” dust, asteroidal and planetesimal environment.
Although, as far as the author knows, this hypothesis has not been recognized among astrophysicists, it does not contradict the logic of the scheme of processes on the right slope of S-Trough # 8, where the Sun is located (\(10^{11}\) cm). By the way, exactly 10 orders of magnitude to the left (scale \(10^{1}\) see Fig. 2.7.), on the right slope of S-Trough # 6, the development of biosystems is realized due to the separation of the fetus from the mother’s body, i.e. due to childbirth.
THE SCALE ANALOGY with animal births here is certainly very remote and conditional, but it proves to be fruitful for a principled choice between the processes of synthesis or division.
EARTH. Our planet, according to various estimates41 , absorbs up to \(10^{9}\) tons of cosmic matter per year, so over 5 billion years it could have increased its mass by a decent amount - up to \(10^{18}\) tons. Typically, falling particles are angstrom to micron in size, although larger bodies are also found. Consequently, the Earth absorbs particles and objects of different sizes and chemical composition on its surface. Although their mass does not exceed, according to some estimates, a few percent of the mass of the Earth’s crust, from our point of view, their role in the formation of the biosphere is enormous42.
“Currently, most scientists believe that the Sun and planets formed simultaneously from the same cold gas-dust cloud… At first, there was a cold gas-dust nebula similar to the ones astronomers observe today. This nebula was 99% gas, mostly hydrogen, and 1% consolidated matter (by mass). The size of individual consolidated bodies should be small (up to 100 km in diameter, otherwise the nebula would not be stable) “43. Obviously, the gas went to create mainly the Sun, and consolidated bodies gave rise to the planets.
It should be noted that in this theory the size limit for the primary cosmic bodies that could participate in the synthesis of planets is 100 km, which is fully consistent with our hypothesis about the presence of the synthesis-division BARRIER in this size region. Therefore, it is very important to note that not only at the first stage of the Earth’s formation the size limit for the bodies participating in the synthesis was the threshold of 100 (and, perhaps, a little more) kilometers, but it is well known44 that even during the entire subsequent history of the Earth a cosmic body with dimensions exceeding 100 km never fell on its surface. Thus, the vast majority of bodies involved in the synthesis of planets did not exceed about 100 km in size. This threshold is preserved later, - in the matter absorbed by the planets do not participate bodies whose size exceeds 100 km. Any collisions with bodies larger than a hundred kilometers in diameter do not lead to evolutionary synthesis, but lead either to the destruction of the planet as a whole (hypothetical Phaethon), or to the impact ejection of a body of similar size from it (hypothesis of the terrestrial origin of the Moon).
Consequently, the conjunction of a planet with a body larger than 100 km leads not to synthesis but to division. This puts an essential dimensional threshold for the accretion process, which is located along the S-axis exactly 10 orders of magnitude to the right of the analogous threshold from the world of biosystems and 20 orders of magnitude to the right of the analogous threshold from the world of nuclear physics.
Let us apply in this case the same S-D THRESHOLD MODEL, but already for S-Trough of Potential stability # 8. In this case we can predict at least two barriers: one with a coordinate of 1.6 \(\cdot 10^{7}\) cm (160 km), the other with a coordinate of ~5 \(\cdot 10^{7}\) cm (500 km). In this case, by analogy with S- Troughs #4 and #6, the entire right slope of S-Trough CLASS #8 is filled with systems for which a division or separation process is quite likely. But all planets exist on this slope! Hence, their stability is very relative. True, it’s not all bad.
Analogies with previous S-Troughs show that objects whose sizes exceed the division threshold by no more than an order of magnitude are mostly actively divisioning, hence, small planets (smaller than the Moon) are most likely to be subject to destruction. For Jupiter-sized objects, the process of satellite separation (birth) is more likely45. The Earth, which is two orders of magnitude to the right of the synthesis-division barrier, is most likely not capable of fragmentation like Phaethon (judging by the total mass of the asteroid belt, this hypothetical planet was very small). Although, in principle, the Earth could separate (bud off) some bodies from itself. In this regard, it is possible that hypotheses about the origin of the Moon as a separated body from the Earth are not so fantastic.
So, we see that most of the astronomical information and theories available today do not contradict the S-Trough of Potential stability #8 model.
First, almost everywhere we find confirmation that the formation and growth of planets are realized by the synthesis of bodies whose sizes do not exceed THRESHOLD S-D ~160 km.
Secondly, the S-Trough of Potential stability model does not impose a ban on the process of “birth” of planets due to separation of fragments of matter from the Sun (or satellites of planets due to separation of their parts from the planets themselves). It is true that hypotheses about the Sun’s “birth” of planets and satellites are much more weakly developed and are practically not recognized by official cosmology. The reason is simple. Gravity, the force that gathers matter, gives way to theories related to the SYNTHESIS of matter, its consolidation. Fragmentation, separation, budding, ejections, “births” and similar processes of FACTION go against the gravitational tendency, that is why they are accepted by the scientific community much more difficult than the processes connected with synthesis. The proposed S-Trough model with two slopes provides a new support for hypotheses based on the division process. It is true that the model itself has no physical explanation yet, but we will try to solve this problem in the future. For the time being we only rely on the laws of scale similarity, which surprisingly do not contradict the enormous amount of factual material accumulated by science in various fields of knowledge.
SOCIAL SYSTEMS. Let us continue analyzing the trends of C-D on the information base of living systems. Let us start with social systems, but before that we will mention one very original work, which was published quite recently. Its author V. A. Vasiliev46 managed to reveal a very interesting regularity in the history of human cultures. Large societies periodically (after 400 years) change the direction of their development: from integration to disintegration.
This phenomenon can be called a kind of MASS PULSATION OF SOCIETIES, which V.A. Vasiliev connects with cosmic rhythms, which are also manifested in solar activity. The discovery of this regularity shows how important is the systemic study of the processes going on in the social space, first of all, the processes of growth, fragmentation, synthesis and other similar processes that lead to the movement of the social system along the S-axis. In this case, a social system can cross some very complex dimensional zones in which the general tendency of systems development in the MASSIVE FIELD changes dramatically, as has been shown in other examples.
Starting from the simplest unit of society (family) and further on, we will move down the left slope of S-Trough # 8 to the right (Fig. 2.17), to a more stable position. According to the general HYPOTHESIS, EVOLUTION THROUGH SYNTHESIS dominates here.
FAMILY - “the primary unit of society” formed as a result of voluntary joining of two independent subjects of society into a new integrity.
In its most natural form, in rural conditions, a family occupies a territory with dimensions ranging from a few tens of meters to a few hundred meters. Approximately such an area can be cultivated by one independent family (outside the specialization of post-industrial society) and is capable of feeding it.
Families with all their ramifications from a common ancestor form genera or families. These are already kilometer scales. At first glance, here, in genera, in families, we meet the opposite principle of creating systems: branching off (i.e. division) from the common root of more and more new branches.
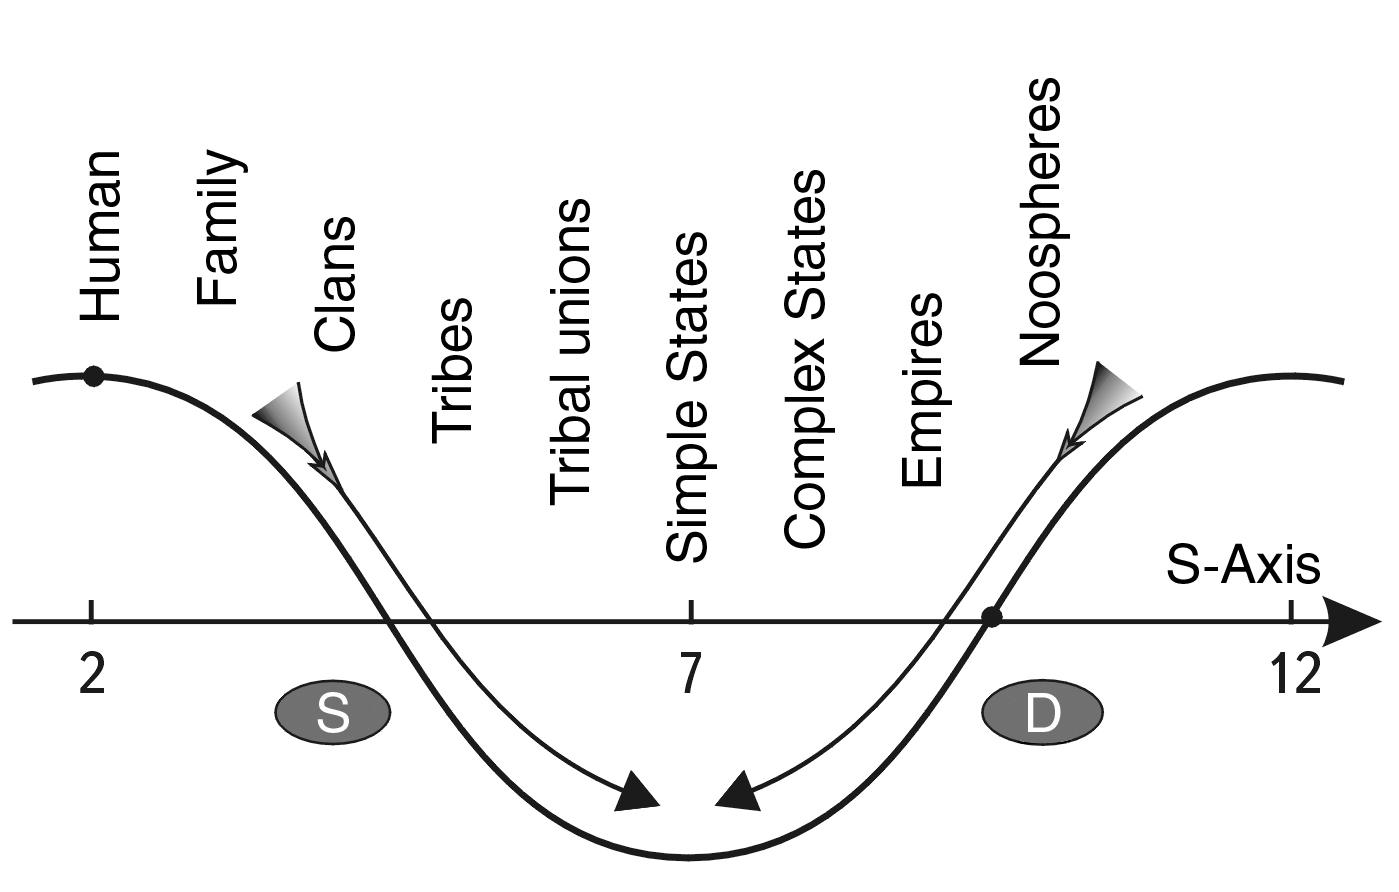 Fig. 2.17. Location of social systems on the S-Trough of Potential stability. It can be seen that the most stable position is occupied by simple states, the size of which is in the range of 100-200 km. All smaller societies naturally gravitate towards unification into such structures. Complex states, empires and Noosphere are on the right slope, which is characterized by a constant tendency to fragmentation, disintegration. Therefore, their maintenance requires a more powerful state management apparatus, which most often acquires all the signs of a totalitarian gendarme type
However, it should not be forgotten that in its pure form this process leads to degeneration of a clan or family, which needs fresh blood to prevent the appearance of genetic defects. Since the path of simple “budding” leads to the degradation of the population, young couples in clan and tribal societies were always created under the control of senior representatives of different clans or families. In the case of their union in marriage, they speak of twinning (joining) of families or clans. Such twinning is a kind of synthesis of different clans into some unified community of a higher level, which leads to the creation of tribes and peoples. How tragic such synthesis (or obstacles to it) can be, is well known from Shakespeare’s famous tragedy “Romeo and Juliet.” Thus, families and clans can behave as SELF-CONTINUED SECTORS, solving at their own scale level the problem of joining or not joining together.
SETTLEMENTS. As a rule, settlements are kilometers or even tens of kilometers of controlled territory. They are formed again by synthesis. One family or clan moves to a new place. Then other families and individuals flock to this place from the surrounding area. The settlement grows by “absorbing” smaller social units and grows to the size of a city through this synthesizing process.
The author does not know of any cities whose size would exceed a hundred, let alone a thousand kilometers. In Russia, the longest city is Volgograd, it is about 70 kilometers long.
PRIMARY (SIMPLE) STATES. As historical analysis shows, they were created due to the arrival of tribes from the surrounding lands to a new territory. There was a concentration of settlements on a limited territory.
Most likely, those historians who connect such “pressing” of tribes with ecological conditions that have changed for the worse are right. This forced them to strive for more fertile lands and to shift from the usual cattle breeding and hunting to agriculture, which was unusual at first. This is probably how all river states were formed, starting from Ancient Egypt.
The process of such synthesis went on long enough and naturally, without efforts on the part of the primary states themselves. In the future, the formed new states continued to play the role of absorber of the surrounding tribes, which, rolling up from the “wild” space, were absorbed by the states, assimilated by them and processed into a NEW SOCIETY - the People.
This was the case in ancient Egypt: “Starving tribes from various places, including the Jews, poured into the fertile Nile Delta in search of food. History records that the Egyptians welcomed them with kindness “47.
The expansion through synthesis of tribes and many other primary states proceeded similarly. As a rule, their average size did not exceed several hundred kilometers.
However, the process of absorption of wild tribes was not always painless. For example, the history of ancient Egypt preserves evidence of the “terrible invasion” of the Hyksos, who were partly expelled and partly assimilated.
Then the primary states, growing to a certain size, began to face a new and unusual problem - the tendency to fragmentation into separate structures. For the first time in the history of mankind this problem had to be solved, apparently, by the pharaohs of ancient Egypt, for whom the growing independence of the nomes led to the need for constant strengthening of administrative power. Subsequently, all primary states, including Russia, faced the centrifugal tendency.
It is very important for us to note that the centrifugal forces of regional separatism are a sign of the transition of the SYNTHESIS-DIVISION BARRIER by the growing social systems in the course of evolution, the first boundary of which is 160 km in size (the exact values of these barriers were determined in Section 1.5.6). This is not to say that the separation of social structures from each other does not occur on smaller scales, it is just that we are primarily investigating positive trends that lead to the evolution of social systems.
The growth in the size of social systems throughout human history is an objective fact. From the point of view of the large-scale approach, this process can be described as a gradual “settlement” of higher and higher scale levels of organization. Therefore, if in the history of mankind there have been any disintegration of families and tribes into many independent and autonomous entities, we believe that these processes were exclusively destructive.
According to our HYPOTHESIS, having crossed the BARRIER C-D (160 or 500 km), mankind for the first time faced the phenomenon when further growth of societies at the expense of JUST SYNTHESIS turns out to be “energetically unprofitable”, and FRAGMENTATION of a large society into smaller structures can be a positive process from the evolutionary point of view. Let us analyze this problem in more detail.
The primary states, which were relatively small social systems with sizes close to 160-500 km, are, according to the model, in the zone of increased stability, in the lower point of S-Trough # 8. Once emerged, they should exist within their dimensional boundaries for quite a long time. If they appear to be to the right of the 500 km barrier in their dimensions, the tendencies to fragmentation are not so great as to destroy them completely. History has preserved for us several examples of such “oscillations” of social systems near the center of equilibrium, when primary states break up into separate regions and then reunite again (Fig. 2.18). For example, at the beginning of the 3rd millennium B.C., Upper and Lower Egypt were united, after which the whole country was divided into 42 nomes. After 2325 BC. “under conditions of subsistence economy and increasing decentralization Egypt lost the established system of government and turned into a fragmented state ….
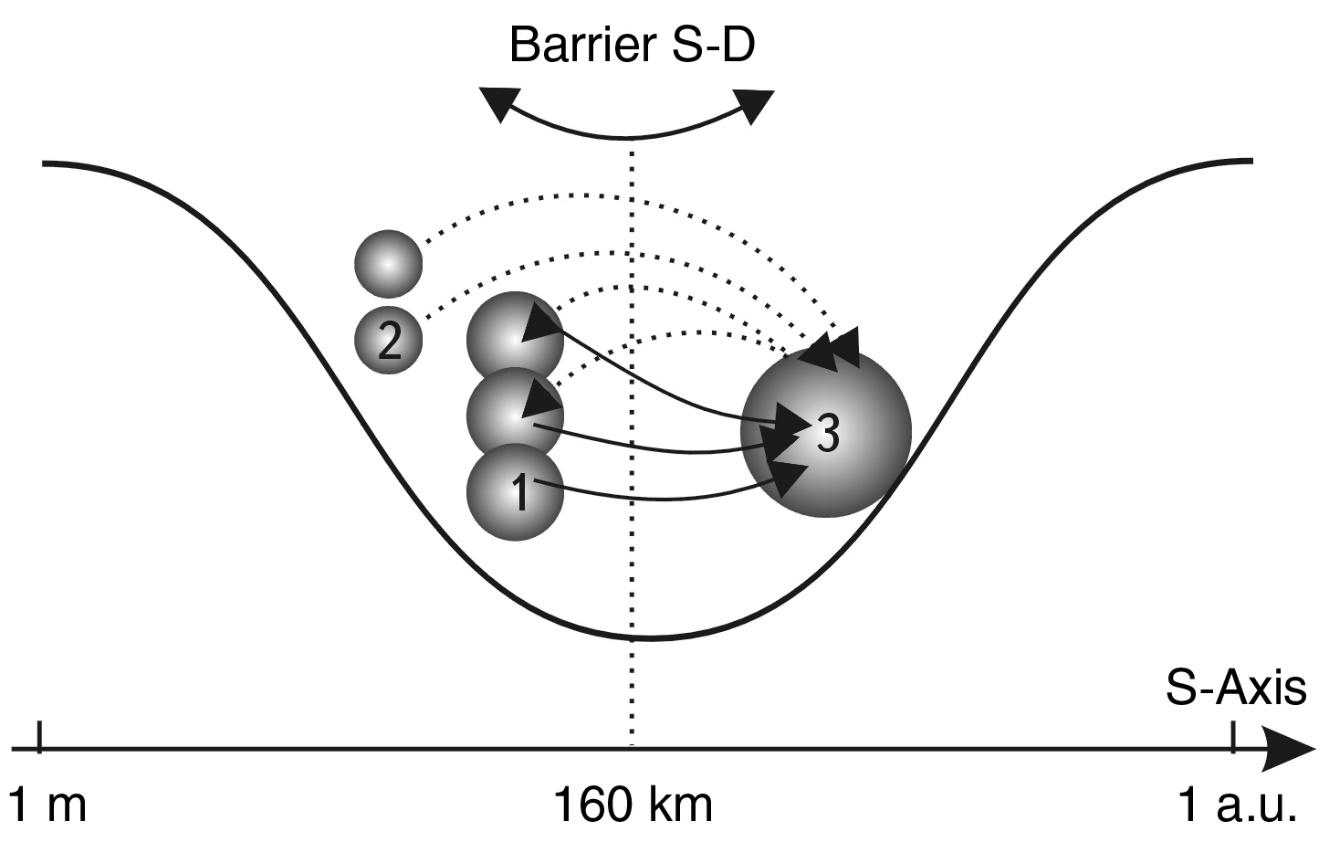 Fig. 2.18. The phase space of scale stability is such that simple states (1) and tribal alliances (2) tend to form complex states (3), which after some time disintegrate into simple states
Finally the nomarch from Heracleopolis took possession of Memphis and declared the independence of Lower Egypt. The kingdom broke up… About 2040 BC Pharaoh Mentuhotep I… managed to conquer the Northern Kingdom (Heracleopolis) and unite Upper and Lower Egypt. This is how the Middle Kingdom came into being “48.
For Russians, another example is most illustrative. First, the emergence of the Kievan state. Then - infighting and its disintegration into three independent regions: Kiev, Novgorod and Moscow. Subsequently, Russia united again, but this process is still remembered by the rivers of blood spilled by Ivan the Terrible in Novgorod and a mass of other examples of violence during the creation of the giant Russian Empire.
We PROPOSE that as soon as a state outgrows a critical size (about 500 km), it loses the ability for natural synthesis and can grow similarly to large atomic nuclei only explosively.
EMPIRES AND NATION-STATES. After the primary states have exhausted the resource of growth by absorbing the tribal environment around them, they begin plundering and destructive campaigns against each other.
This abrupt transition from natural growth to the violent seizure of neighboring territories, from our point of view, is connected with the TRANSITION FROM THE ZONE OF EVOLUTION OF SOCIETIES FOR SYNTHESIS TO THE ZONE OF EVOLUTION FOR GROWTH WITH FOLLOWING DEFINITION.
The principle of scale similarity allows us to compare the process of empire formation with the process of growth of large atomic nuclei or with the formation of cell colonies. The point is that the growth of empires, the formation of large atomic nuclei and cell colonies take place in similar zones corresponding to the S-TROUGHS (#8, #6 and #4), namely, in the first part of the right slope (up to the intersection of the STS with the S-axis). Take, for example, the process of formation of colonies of cells or protozoan multicellulars. This process proceeds due to the growth of cells and… their subsequent division, but without divergence to the sides.
So, natural synthesis is no longer possible for states, the creation of larger systems is accompanied by “rolling” of the system up the right slope, the steepness of which requires much more energy than at the previous stages of growth. Using the principle of scale similarity, we can compare this process to the synthesis of the largest atomic nuclei, which occurs not in the calm process of nucleosynthesis of stars, but in the explosive process of supernovae. Apparently, the synthesis of empires is also possible only as a result of an explosive invasion process. The most vivid example is the empire of Alexander the Great, who in less than 10 years captured a huge territory. However, as superheavy atoms become unstable and undergo disintegration, so do empires. Alexander the Great’s empire disintegrated immediately after his death. It was perhaps the shortest-lived empire. In much the same way, explosively, Genghis Khan’s empire and many other colonial and world empires were formed. And all of them eventually collapsed into fragments. An approximate systematic scheme of the process of empire formation is shown in Fig. 2.19.
As shown in the work49, one should fundamentally distinguish between empires of several types, so the scheme of their formation and disintegration is also somewhat different. Thus, for example, in the past, the Russian Empire is an empire of the national type, the British Empire is a colonial empire, and the Roman Empire is a world type. Thus each large civilization passes successively through THREE PHASES OF DEVELOPMENT OF EMPIRES: national - colonial - world, which last approximately 500 years. The common thing is that empires are created forever, and exist for no more than a few centuries (the age limit is 500 years). And the fact that they are created not in the process of voluntary accession of peoples (as, for example, primary states), but usually as a result of bloody and brutal seizures with the use of a rigid centralized apparatus of suppression.
Even the Russian Empire (despite the fact that many nations joined it voluntarily), starting with the capture of Kazan and Novgorod, very often expanded its borders through military expansion.
Empires, as a rule, have a rigid centralized power and are kept mainly on it. If the centralized power weakens for any reason, the empire quickly collapses, causing shock to all its inhabitants. The latest example is the collapse of the USSR empire, which we are still painfully experiencing as a social catastrophe.
Is the role of empires in human history positive or negative? Since these questions, as a rule, are studied by intellectuals, they mostly give negative assessments to empires. Hence, for example, such common clichés as “evil empire”. Why, as a rule, intellectuals do not like empires? The main reason is that empires, because of their unwieldy nature, are conservative, often suppress personal initiative and relegate the individual to the role of a cog in the system. Empires cannot exist without a rigid centralized power, from which one step to totalitarianism, they are formed through the capture of peoples and hold on by suppressing attempts to leave them.
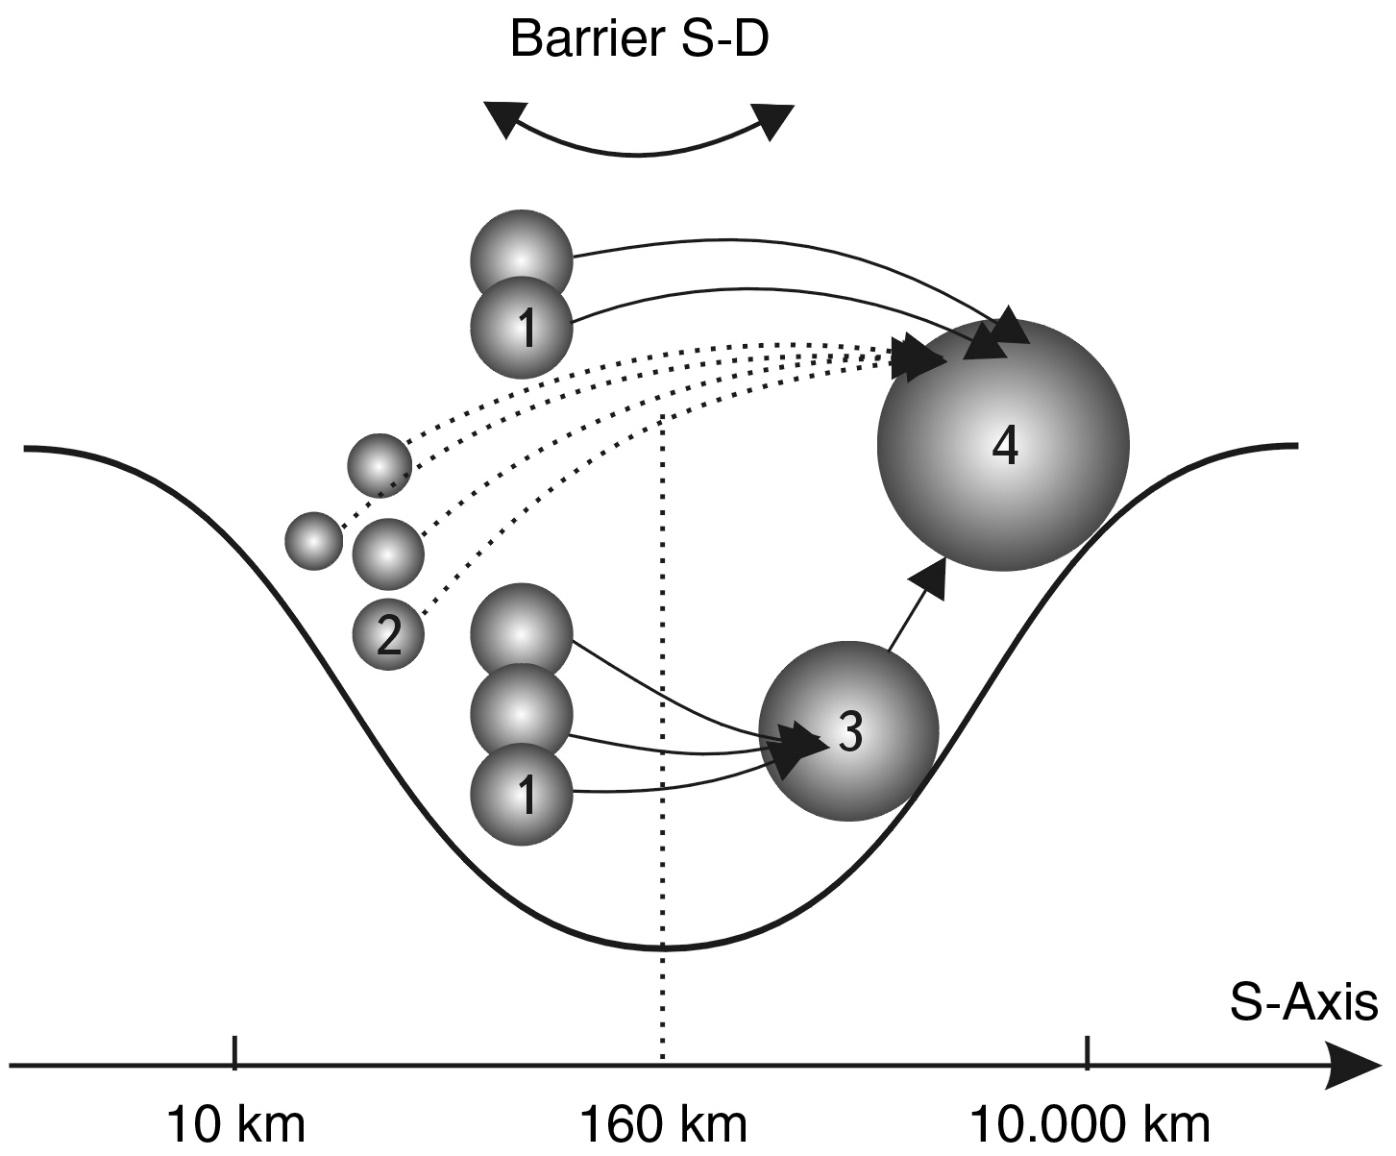
Fig. 2.19. S-dynamic scheme of empire formation (4) from complex states (3), simple states (1) and tribes (2)
All this is very contrary to the freedom-loving and individualistic nature of the intellectual. The author is no exception. However, objectivity is higher than personal biases. A systemic view of the role of empires shows that at a certain stage they become an extremely necessary socio-political phenomenon. They carry a lot of positive aspects. At least three factors justify the existence of empires.
First, they spread the most advanced way of life to the peripheral territories, transferring the best achievements of the “core” of the empire to the rest of the nations.
Secondly, they create one more level in the large-scale hierarchy of social systems. As will be shown below, the expansion of society in a large-scale direction is almost the main task of human civilization. This is the way to reach the Noosphere.
Thirdly, after the collapse of empires, societies more developed than those that entered it before its inception remain. They become new stable states with moderate size (average size 500-600 km). Therefore, we can say that empires are “BIRTHROOMS” for nations.
Peoples enter empires as tribes and nationalities, and leave them after the collapse of empires as independent nation-states. For example, after the collapse of the USSR, Kazakhstan, Kyrgyzstan and Azerbaijan were formed as new national states, which had not existed before these peoples joined the Russian Empire. Similarly, in its time, in the depths of the Mongol Empire, the Russian nation matured. L. Gumilev, I think, said that Muscovites, Tverites, Ryazans, etc. came to the Kulikovo field, and Russians left it.
Thus, empires never collapse into primary tribal structures, which testifies to their positive-evolutionary “recycling” function. If any part of the empire has not matured to the possibility of creating a full-fledged nation-state and is in the phase of tribal development (with tribal and clan enmity inside), it is not able to break away from the core of the empire and separate into a new state, and is forced to remain inside this core. Examples of successful separation of peoples from empires into independent states excite attempts of clan societies to make a jump through natural phases of development. Apparently, this leads to the emergence of such “eternally separated” from former empires territories as Ireland, Abkhazia, Chechnya and others. The separation of such small territories with not yet formed foundations of a nation-state is unnatural in the logic of the S-Troughmodel #8, that is why it does not happen until the end.
So, by applying the principle of scale similarity, it is possible to take a new look at the actual PROBLEMS OF BUILDING SOCIAL SYSTEMS with the help of well-known regularities in the field of nuclear physics and cytology.
These regularities cannot be neglected in the construction of the NOOSPHERE. It turns out that the creation of a world state, the scale of which exceeds by several orders of magnitude the stable zone of S-Trough of Potential stability, is a very difficult and extraordinary task. The experience that mankind has gained in building previous levels of social hierarchy may not work here.
According to the logic of the S-Trough of Potential stability model, the noosphere will constantly strive for fragmentation into smaller parts. The principles of democratic governance, which have proved themselves perfectly well on smaller scales (on the left slope of S-Trough #8), will not work here. Consequently, the transition to this new scale zone for mankind requires a fundamentally new approach to social problems and structures.
BIOCENOSIS. In living nature there are examples of synthesis of animals, birds and fish - into herds, flocks and families. But the formation of the first biocenosis (systems with larger sizes than hundreds of meters) occurred mainly in such old times that it is difficult to determine the dynamics of these processes, i.e. to decide whether they are similar to social ones or not. After all, biocenosis can be formed both as a result of individuals coming from different places and as a result of primary pairs (“adams and eves” of each species) breeding in one territory. In the latter case, it is more like a process of division than synthesis. In this connection, we should carefully analyze modern cases of mass migration of living beings over the surface of the planet and try to understand whether they are the division of flocks and herds into two independent biocenoses or assembly and compaction with subsequent relocation to a new territory.
An example of obvious “reproduction” of communities by division gives us a bee swarm, which is separated from the hive as an independent family. As a rule, the hive size does not go beyond the meter limits, i.e., as already mentioned, it belongs to the right edge of S-Trough #6, and this is already a division zone.
It would be another matter if it were possible to establish that in the life of birds, or fish, or animals, flocks and herds split into two parts and form new stable flocks and herds. As far as the author knows, such “swarming” is practically not observed in the area of sizes larger than 10 meters.
By the way, the author is not aware of similar cases of formation of new settlements or towns by separation of human “swarms” from old settlements or towns.
Migration, as a rule, is a problem of individuals, not of large societies. Of course, this problem should not be confused with the PROBLEM OF RELOCATION OF PEOPLE, when the whole SOCIETY rises from one place and moves to another.
However, it can be assumed that there are exceptions to this rule, so the author would be extremely grateful to specialists in the relevant fields who would point out to him cases of “multiplication” of societies through fragmentation and separation.
S-TROUGHS #10 [12; 17; 22]
According to the SW model, it is located in the size range from \(10^{12}\) to \(10^{22}\) cm, i.e., from the average size of stars to the average size of galaxies. In the center - the sizes \(10^{17}\)- \(10^{18}\) cm, this is the scale of the average distance between stars in the Galaxy, the scale of the nuclei of galaxies and quasars. This is where BARRIER S-D should take place. Due to the lack of reliable factual information about the dynamical and evolutionary processes occurring at such scales, we will limit ourselves to a cursory excursion into this area.
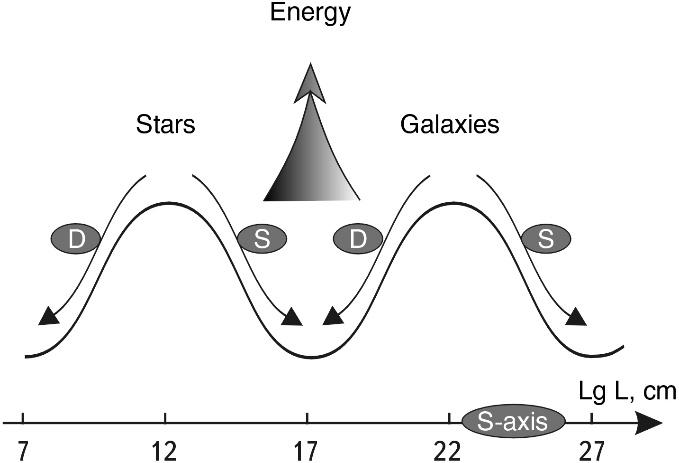
Fig. 2.20. Potential surface of scale stability for stars and galaxies. The scheme shows that stars can join into pairs, groups. Associations and clusters of stars, whose sizes are about \(10^{19}\) cm, belong to the right slope, and their history should be different from that of pairs and groups. It also follows from the scheme that the nuclei of galaxies are in a position similar to cells. Therefore, they can divide with the release of energy. Other galaxies can bud off from galaxies, they can “give birth” to new galaxies. However, two small galaxies can never merge into one large galaxy, creating a new complete galaxy. Although galaxies can gather in pairs, groups, etc., but already on the left slope of the next S-Trough of Potential stability (STPS) #12.
According to the proposed principle of scale similarity, all systems from \(10^{12}\) to \(10^{17}\) cm can evolve, creating new systems by assembly (synthesis). This applies first of all to stars, their pairs and multiple systems, since on the left slope of STPS #10 (see Fig. 2.20) we cannot point to any other systems as common as stars.
On the contrary, on the right slope of this , according to the model, all systems should evolve by division, detachment, fragmentation, separation, etc. The whole right slope of STPS is populated by galaxy nuclei, star clusters, galaxies themselves.
Let’s see what data modern astrophysics has about the processes going on in this range of scales.
LEFT SLOPE (\(10^{12}\)- \(10^{17}\) cm). Stars are known to form not only pairs and small multiple systems, but also to be combined into clusters. Theoretically, these stellar megasystems can be formed by two quite opposite processes.
In the first variant they are formed from free stars of the galactic field, as a result of gravitational capture and crowding - this is the SYNTHESIS variant. We BELIEVE that mainly pairs and groups of stars arise in this way. Their ages may be different.
According to the second scenario, star systems can be formed as a result of fragmentation of gas-dust complexes - this is the division variant. We see that in the second scenario, the problem of star formation is solved “in parallel”. Obviously, the age of stars in this case should be the same. Apparently, all large star clusters, starting from associations and ending with scattered clusters, arise in this way.
“Empirical evidence of the process of star formation from clouds of the interstellar medium is that… massive hot stars of high luminosity… are not uniformly distributed in the Galaxy, but are grouped into separate extensive clusters; such groupings of stars were called “associations “50. It turned out that stars from these associations diverge. I.S. Shklovsky called such associations “maternity homes” for stars.
RIGHT SLOPE (\(10^{17}\)- \(10^{22}\) cm). As noted above, it is on this slope that, according to most astrophysicists, the process of fragmentation of gas-dust complexes, leading to the formation of new stars, takes place. On the same slope, in its upper part, galaxies “live.”
The distances between galaxies are very large, besides, according to the redshift data within the Big Bang theory, all galaxies are scattering away from each other. For this reason, it is difficult to assume that galaxies of any size can join together in any close systems. In other words, on the right slope, it is impossible to imagine the merger of two galaxies into one more complex system, it is impossible to suppose that two small galaxies synthesize one larger galaxy. Even more improbable is the process of merging the nuclei of galaxies, which, given their relatively minuscule sizes, even if the galaxies passed through each other, would hardly be able to come close to each other.
So, the average distance between galaxies is 100 times their size, the nuclei of galaxies are 10-100 thousand times smaller than the galaxies themselves. Galaxies are scattering away from each other. All these factors practically exclude any variant of EVOLUTION of galaxies or their nuclei THROUGH SYNTHESIS ON THE RIGHT SIDE OF STSP #10.
Once again, it is worth repeating that the SW model does not forbid galaxies to collide at all. Just as two people can collide in the street, two galaxies can (probably) collide in the cosmos. The S-Trough of Potential stability model states only that the collision of two galaxies does not lead to the emergence of a more complex system in the evolutionary sense.
The probability of the process of FISSING as a factor of EVOLUTION on the RIGHT slope is much higher.
First, it is the activity of galactic nuclei, which sometimes leads to explosions of gigantic force51. An explosion of this kind is evidence of the separation and subsequent dispersal of galaxy nuclei (e.g., Seyfert galaxies). There is a certain fraction of galaxies with very elevated emission in the central region.
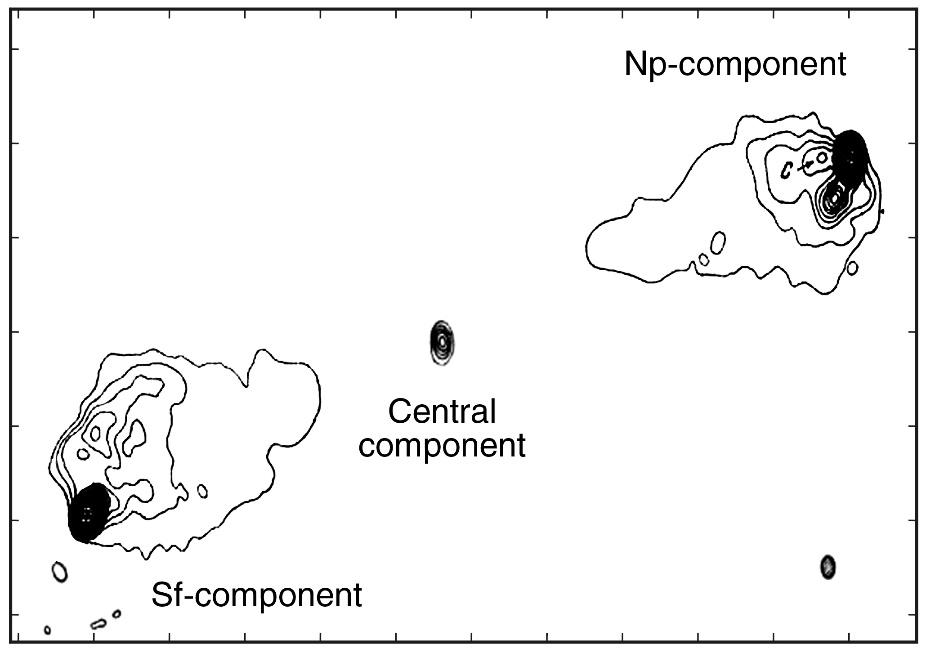 Fig. 2.21. The Swan-A galaxy, which split into two fragments after the explosion. The energy of the explosion in its core was so colossal that it cannot be explained by processes known to science
“Radio emission is most often detected in galaxies with split nuclei… interpreted by G. M. Tovmasyan as nuclei in the process of active division “52.
To such fissile nuclei astronomers after a long debate53 have attributed the Swan-A galaxies (Fig. 2.21), NGC 5128 and 1275.
The fact of galaxy nuclei division is a striking confirmation of the presence of the MS-invariant, because it occurs on the S-axis exactly 20 orders of magnitude to the right of cell nuclei division. This phenomenon is most clearly manifested in quasars, whose nuclei, according to most astronomers, serve as sources of continuous ejection and fragmentation of matter54.
Observations of galactic nuclei and their increased energy release led the famous Soviet astronomer V. A. Ambartsumian to propose a hypothesis55 about the existence of some mysterious D-bodies, a supermassive state of matter, the fragmentation of which leads to unusually high energy activity of galactic nuclei and ejections of matter from them.
In addition, many photographs of active galactic nuclei and emissions from them testify in favor of the assumption that galactic nuclei can divide56 and fragment, ejecting some matter outside the inner region and even outside the galaxy itself.
This leads to the idea that in the lower region of the right slope of the S-trough an active process of formation of new systems by division and fragmentation is quite possible.
Using the analogy with the right slope for S-TroughNo. 6, where new objects are born in biosystems, we can put forward a preliminary HYPOTHESIS that new galaxies can appear only as a result of their “birth” by other galaxies. Perhaps, the close groups of galaxies discovered by B. A. Vorontsov-Velyaminov 57 (and figuratively called “nests” by him) are just the actual nests for newly born galaxies.
S-Trough of POTENTIAL STABILITY #12 [22; 27; 28]
It is essentially a “half- TROUGH” because it consists of a single left slope that starts at size \(10^{22}\) cm and ends in the size region \(10^{27}\)- \(10^{28}\) cm. This entire slope is populated by pairs, groups, clusters and superclusters of galaxies. There are many theories about galaxy interactions that allow for their synthesis58. However, this synthesis does not lead to the formation of new galaxies, it leads to the formation of pairs and other groups of galaxies whose sizes (\(10^{22}\) cm) always exceed the size of the upper crest of the STPS (see Fig. 2.20).
It is not obvious, but it is quite admissible that all galaxy clusters and superclusters were formed as a result of merging independent galaxies into new megasystems. But the question about the dominance of synthesis over division on this slope of the S-Trough is still open.
TOTALS. Thus, we have considered four and a half S-Troughs on the WAVE of stability. The problem of large-scale binding of the dominant processes of synthesis or division is considered, most likely, for the first time in science.
Since the author cannot rely on his predecessors in this matter, this problem cannot be investigated with such precision and completeness to make final conclusions. However, many facts and indirect data, including those left behind the text, allow the author to make a PROPOSITION that there is a universal natural principle of change of synthesis-separation tendencies with a periodicity of \(10^{5}\). Accordingly, every 10 orders of magnitude, nature returns to one of the modes of evolution again.
This periodicity correlates in a remarkable way with the global scale classification of all objects of the Universe, discussed in the previous part.
And if the revealed regularity will be confirmed by subsequent more detailed researches, new fantastic horizons in methodology of research of the most important processes in the Universe will open before us.
Nuclear physics, biology, and astrophysics can be mutually enriched by using the MASSAGE SUBMISSION METHOD.
It seems incredible, but astrophysicists, in order to better understand the processes going on in the nuclei of galaxies, may be studying the biological features of cell division.
We see that the refined principle of scale similarity of HERMES TRISMEGIST is eS-Trough of POTENTIAL STABILITY #12 [22; 27; 28]nriched with new unexpected facets.
Completing the identification of the peculiarities of the scale zones of synthesis and division on the S-axis, we can take a new look at the scale interval of the Universe as a whole.
-
Mukhin K. N. Physics of the Atomic Nucleus // Experimental Nuclear Physics, Vol. 1. Moscow: Atomizdat, 1974. p. 50. ↩
-
Chechev V. R., Kramarovsky Ya. M. Radioactivity and the Evolution of the Universe. Moscow: Nauka, 1978. ↩
-
Ibid. p. 40. ↩
-
Ibid. p. 44. ↩
-
Islam J. N. Sky and Telescope, 1979, 57, I, pp. 13–18. ↩
-
Animal Life, Vol. 1. Moscow: Prosveshchenie, 1968. p. 71. ↩
-
Ibid. p. 139. ↩
-
Green N., Stout U., Taylor D. Biology, Vol. 1. Moscow: Mir, 1996. p. 22. ↩
-
Animal Life, Vol. 1. Moscow: Prosveshchenie, 1968. p. 159. ↩
-
Ibid. pp. 120–125. ↩
-
Ibid. p. 98. ↩
-
Afanasyev Yu. I., Korolev V. V., Kotovsky E. F. Cell Nucleus and Some Issues of Cytogenetics. Moscow: Nauka, 1971. p. 19. ↩
-
Khesin Ya. E. Nuclear Size and Functional State of Cells. Moscow: Meditsina, 1967. p. 150. ↩
-
Mazia D. Mitosis and Physiology of Cell Division. Moscow: IL, 1963. ↩
-
Ibid. pp. 43, 45. ↩
-
Biological Encyclopedic Dictionary. Moscow: Great Russian Encyclopedia, 1995. p. 185. ↩
-
Tokin B. P. General Embryology. Moscow: Vysshaya Shkola, 1977. p. 90. ↩
-
Alberts B., Bray D., Lewis J., et al. Molecular Biology of the Cell, Vol. 3. Moscow: Mir, 1994. p. 27. ↩
-
Stanek I. Human Embryology. Bratislava: Veda, 1977. p. 105. ↩
-
Alberts B., Bray D., Lewis J., et al. Molecular Biology of the Cell, Vol. 3. Moscow: Mir, 1994. p. 30. ↩
-
Ibid. p. 8. ↩
-
BME, Vol. 30. ↩
-
Tovarnitsky V. I. Molecules and Viruses. Moscow: Sovetskaya Rossiya, 1978. ↩
-
Ibid. p. 86. ↩
-
Ibid. p. 34. ↩
-
Ibid. pp. 34–35. ↩
-
Ibid. p. 35. ↩
-
Ibid. pp. 97–98. ↩
-
Luria S., Darnell J. General Virology. Moscow: Mir, 1970. pp. 280, 282. ↩
-
Avakyan A. A., Bykovsky A. F. Atlas of Anatomy and Ontogenesis of Human and Animal Viruses. Moscow: Meditsina, 1970. p. 175. ↩
-
Bulanov P. A., Kolesko O. I. General Microbiology. Minsk: Vyshaya Shkola, 1969. p. 106. ↩
-
Green N., Stout U., Taylor D. Biology, Vol. 1. Moscow: Mir, 1996. p. 19. ↩
-
Avakyan A. A., Katz L. N., Pavlova I. V. Atlas of Anatomy of Bacteria Pathogenic to Humans and Animals. Moscow: Meditsina, 1972. ↩
-
Alov I. A., Braude A. I., Askiz M. E. Fundamentals of Functional Cell Morphology. Moscow: Meditsina, 1969. p. 247. ↩
-
Avakyan A. A., Katz L. N., Pavlova I. V. Atlas of Anatomy of Bacteria Pathogenic to Humans and Animals. Moscow: Meditsina, 1972. p. 21. ↩
-
Garshin A. P., Gropyanyov V. M., Zaitsev G. P., Semenov S. S. Machine-Building Ceramics. St. Petersburg: GGU, 1997. p. 152. ↩
-
Alfvén H., Arrhenius G. Evolution of the Solar System. Moscow: Mir, 1979. p. 154. ↩
-
Ibid. pp. 150–151. ↩
-
Ibid. p. 162. ↩
-
Khodkov A. E., Vinogradova M. G. On the Core Problems of Natural Science. St. Petersburg: Nedra, 1977. ↩
-
Sobotovich E. V. Cosmic Matter in the Earth’s Crust. Moscow: Atomizdat, 1976. ↩
-
Sukhonos S. I. Does Cosmic Dust Stimulate Evolution? // Chemistry and Life, 1988, No. 1, pp. 91–93. ↩
-
Alfvén H., Arrhenius G. Cited source. p. 162. ↩
-
Sobotovich E. V. Cosmic Matter in the Earth’s Crust. Moscow: Atomizdat, 1976. p. 35. ↩
-
Khodkov A. E., Vinogradova M. G. On the Core Problems of Natural Science. St. Petersburg: Nedra, 1997. ↩
-
Vasiliev V. A. Long-term Forecasting of the Development of Complex Social Systems (States, Civilizations). Monograph. Moscow: 1998. ↩
-
Dimont M. Jews, God, and History. Moscow: ImageSet, 1994. p. 41. ↩
-
Compiled by Bodo Harenberg. Chronicle of Humanity. Moscow: Great Encyclopedia, 1996. p. 58. ↩
-
Sukhonos S. I. Russia in the 21st Century. Moscow: Agar, 1997. ↩
-
Shklovsky I. S. Stars: Their Birth, Life, and Death. Moscow: Nauka, 1977. p. 65. ↩
-
Vorontsov-Velyaminov B. A. Extragalactic Astronomy. Moscow: Nauka, 1978. pp. 331–337. ↩
-
Ibid. p. 173. ↩
-
Bronshtein V. A. Hypotheses About Stars and the Universe. Moscow: Nauka, 1974. p. 307. ↩
-
Martynov D. Ya. Course of General Astrophysics. Moscow: Nauka, 1979. p. 458. ↩
-
Problems of Modern Cosmology. Moscow: Nauka, 1972. ↩
-
Vorontsov-Velyaminov B. A. Extragalactic Astronomy. Moscow: Nauka, 1978. p. 364. ↩
-
Ibid. p. 365. ↩
-
Ibid. p. 368. ↩
A global S-trough potential stability
Let us now consider in the most general form the entire S-interval of the Universe from \(10^{-33}\) cm to \(10^{28}\) cm from the standpoint of large-scale dynamics. For this purpose, let us return to the previously proposed scheme (see Fig. 1.7). Recall that, according to the author’s HYPOTHESIS, the three main types of interaction divide the S-interval of the Universe into three identical sections (see Fig. 1.9).
Let’s pay attention to the fact that on the right plot (B-C) dominating GRAVITATION forces create mutual attraction of all objects. There are no gravitational forces of repulsion. Hence, it is easy to conclude that the right site (hereinafter referred to as the slope) is dominated by gathering tendencies, in which the objects converge and are concentrated in space. As a result, the initial material system shrinks and becomes smaller. Within the logic of scale dynamics, it follows that the LEFT VECTOR of M-Force dominates on the right third of the S-interval of the Universe, which tends to move all systems along the S-axis to the left (recall once again that a decrease in size corresponds to the movement of the system along the S-axis to the left, and an increase - to the right). In passing, recall that such a process can proceed both with a change in the density of the initial components and without a change in their density. For example, a diffuse nebula is compressed under the influence of gravitational forces. At the same time, its density increases. The density of atoms, molecules and dust particles, of which it consists, remains unchanged. At a certain stage of compression, its central region turns into a star, and peripheral - into planets. The atoms, molecules, and dust particles in the planets have essentially the same initial density. In principle, there is little change in the density of these components inside the star as well. Therefore, this whole stage can be called the assembly stage, although for the whole diffuse nebula this process can be called compression. The process after the death of a star is somewhat different. Gravitational forces compress its core to a white dwarf (WD), or to a neutron star (NS), or to a black hole (BH).
In the first case, the density of atoms increases by orders of magnitude because the volume of atoms sharply decreases when they are compressed. In BH, the atomic structure of the substance is practically destroyed. In the second case, the density increases by many orders of magnitude more, because the matter of NS is a solid “mush” of nucleons. In NS the nuclear structure of matter is already destroyed.
In the third case, the density of matter increases by many orders of magnitude and the nucleons themselves are destroyed. Practically, in BH the matter structure is destroyed, because at such monstrous pressures and densities no elementary particle can “survive”. One can BELIEVE that BHs consist of only maximon. The above examples allow us to emphasize once again the fact that gravitation, if it is not counteracted by other forces, leads to only one process - compression, and consequently - to the motion of the system along the S-axis from right to left.
Let us now turn to consideration of the trends dominating in the middle section of the S-interval (A-B). Here ELECTROMAGNETIC INTERACTIONS predominantly “work”. Since in the case of identical charges the systems repel each other, and in the case of different charges - attract, it can be stated that in the middle section of the Macro-interval two S-vectors - left and right - “work”. The left one reflects the situation with attraction of two different charges, and the right one - with pushing of two identical charges. Any macro body can have either a predominantly positive charge or a predominantly negative charge. Therefore, these two vectors are characteristic for the whole section of the Macro-interval. Let us now turn to the left, Micro Interval (0-A). Here, as we have already shown earlier, exclusively weak interactions dominate. Recall that “…the main “profession” of weak interactions is not the creation of forces, but the realization of decays (italics mine - S. S.) of particles“ (Shirokov Yu. M., Yudin N. P. Nuclear Physics. Moscow: Nauka, 1972. С. 356.). I.e. on the left edge of the S-interval of the Universe the tendencies connected with deconcentration, with expansion of objects dominate. It is obvious that this process can be compared to the RIGHT S-VECTOR.
In general, the whole picture of dominant trends can be naturally represented as the GLOBAL POTENTIAL S-Trough OF stability OF THE UNIVERSE, or S-Trough (see Fig. 2.22).
What is the convenience of such a MODEL? Because in it the tendencies to contraction or expansion are modeled by tendencies to roll down of systems, to a more stable state, to the center of the S-interval. A ball on the left slope of the S-Trough will tend to roll to the right, while its size increases (e.g., a particle is decaying). The ball on the right slope of the S-trough will tend to roll to the left, at that its sizes will decrease (for example, there is a collapse of the star’s core).
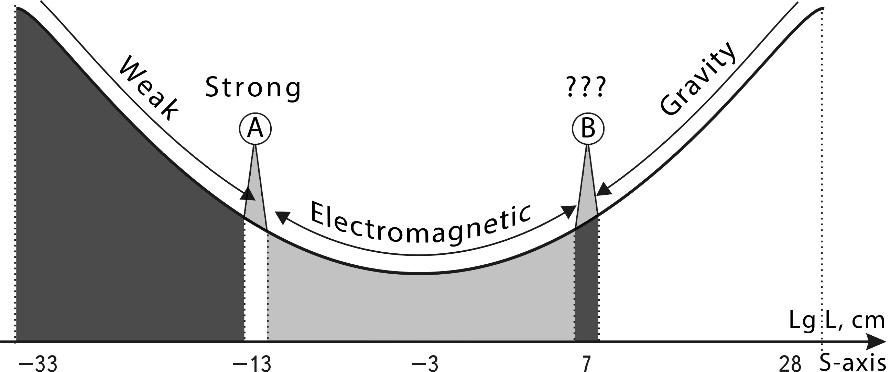
Fig. 2.22. Global S-Trough of Potential stability (STPS) on the S-Axis of the Universe, showing transitions between different types of interaction (simplified model)
In the central part of the S-interval, the ball can be in an oscillatory state (pulsating, disintegrating- reassembling, etc.).
It is very important to note that practically only one principle was used in constructing the model of the global S-Trough of the Universe - the PRINCIPLE OF SCALE SYMMETRY. In this case, the mirror axis of symmetry is the axis passing through the S - Center of the Universe - SCU. In addition, we note that on a narrow half-order band - at the junction of the Microinterval and Macrointerval - the strong interactions dominate, which are mainly responsible for the compression of nucleons in atomic nuclei. Their vector is opposite to the vector of weak forces.At the junction of the Macro-interval and Mega-interval, as we suggested earlier, the pushing forces of the FIFTH force unknown to science may act, also on a narrow strip of half-order.
So, we can PROVE that any process occurring with increasing size on the left slope can find a mirror antipode on the right slope occurring with decreasing size.
The question arises: are there only processes of compression and connection of systems on the right slope? Certainly, if only gravitation acts, it would be so. But the thing is that in the Universe the process of compression, as a rule, is balanced by the process of expansion. Any star would instantly shrink under the influence of gravitational forces, if it were not for the internal pressure caused by the processes going on at the level of the microcosm (the left third of the S-interval). Any planet would be compressed by gravity to a minuscule size, but the force of electromagnetic repulsion between atoms prevents this from happening. Conversely, the overabundance of internal forces of the microcosm sometimes leads to such grandiose explosions that not only star systems but also galaxies fly apart (see Fig. 2.21). This collapse of such large systems, their “disintegration”, goes on the right slope, goes against gravity, against the general tendency, and therefore it occurs explosively, catastrophically, instantly. Using the principle of mirror symmetry, we can PROPOSE that on the left slope there can also occur a catastrophic (almost instantaneous) process with the opposite sign - the collapse of particles.
FREE RETREAT
Thus, if gravitational forces are responsible exclusively for the compression of matter, and weak forces are responsible for its decay, then the electromagnetic forces quite logically share the processes of compression-expansion (attraction-repulsion). Let us consider once again the model S-Trough of Potential stability for the Metagalaxy (see Fig. 2.22).
On the large-scale “territory” of weak (pushing) forces we see a small strip of very actively compressing forces - strong interactions. If we accept the principle of mirror scale symmetry, we can find a place for the hypothetical fifth force, which should be responsible for the pushing of hypothetical gravitational clones in the nuclei of stars and planets. Conditionally speaking, these are “strong antigravity” interactions. At closer examination it turns out that the obtained scale scheme surprisingly resembles the well-known oriental scheme of forces: Yin-Yang.
After all, the symbols YIN and YANG bear a semantic load very close to the problem under consideration. Thus, YIN among other things, is expansion. YANG is compression1. In addition, YIN is inside, space, bottom, woman… and YANG is outside, time, top, man (see Fig. 2.23).
If we consider the S-axis traditionally vertically, then the heavens and the cosmos will be at the top, and the microcosm will be at the bottom. If a human being is placed on a point of his size - \(10^2\) cm, then everything that will be below this point can be referred to his inner world, as it contains cellular, molecular, atomic and other levels. Everything that will be above this point - will have to do with the external world of a person. Isn’t it true that many things coincide? Inside the substance there are weak (female) forces responsible for expansion, they dominate at the bottom of the S-axis. Outside of man there are gravitational (masculine) forces responsible for contraction, they dominate at the top of the S-axis. At the same time, the female forces appear lower than the male forces on the S-axis in exact correspondence with the location of the “female point” on it - the average height of women is lower than that of men, so the female point on the S-axis is slightly lower than the male point. The most interesting thing consists that on space of Yin forces there is a small Yang spot responsible for compression - strong interactions. Then, according to the principle of mirror symmetry, there should be a symmetrical narrow spot of some pushing antigravity forces on the space of Yang forces (see Fig. 2.23).
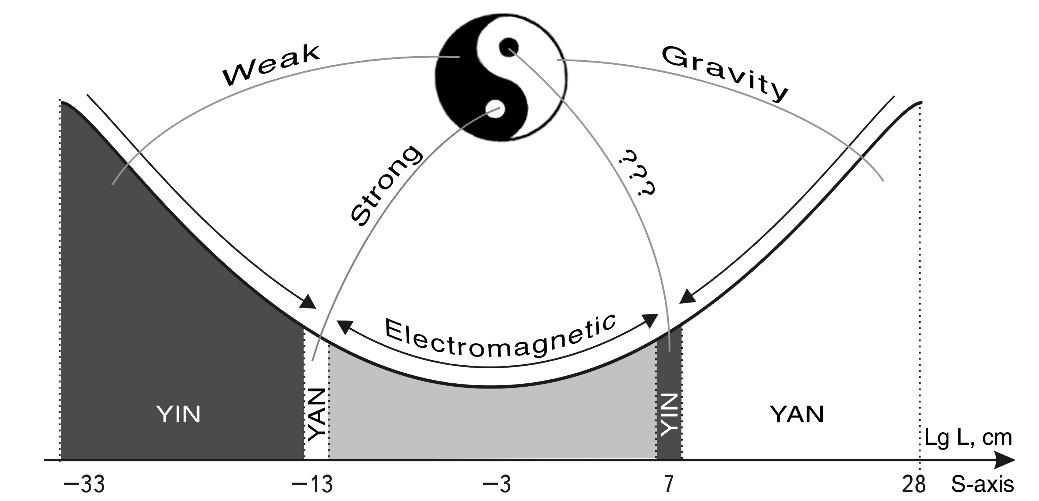
Fig. 2.23. Global S- Trough of potential stability on the S- Axis of the Universe showing transitions between different interaction forces.
So, we see that a detailed study of the role of interactions on various scales unwittingly leads science to an ancient esoteric scheme, with the ability to make predictions about a fifth force as yet unknown to it.
But that’s not all. There is a well-known philosophical principle: extremes converge. It has a confirmation for the S-Trough as well. In the region of sizes smaller than \(10^{-33}\) cm, according to M. A. Markov’s model, we get into another Universe, and consequently, we enter the world of gravitational forces, but inside another Universe. On the other hand, our Universe is, according to M. A. Markov, just a maximon for the metauniverse, which again will stimulate expansion and sprawl in its microcosm. Hence, from gravitation we pass to quasi-weak forces of this metauniverse.
If we do not use the exotic model of M. A. Markov, but rely only on the calculated force ratio2, we will also see that at the size of the maximon gravity again becomes significant! Gravitation, which becomes negligibly small already on the scales of \(10^{-13}\) cm as we dive into the microcosm, suddenly revives like a phoenix from the ashes after diving 20 orders of magnitude further!
So, it is possible that, having closed the S-Loop, gravitation from its limiting size of \(10^{28}\) cm reappears, but already in the microcosm, inverting into its opposite - the “pushing” forces.
For the size of the Metagalaxy, according to M. A. Markov’s model, an inversion can occur - the Metagalaxy becomes a maximon for the Universe of the next scale level (if its scale “scope” is similar to the “scope” of our Universe, its size will be amazingly large in our metric - \(10^{89}\) cm).
So, in general, a general trend is realized in the Universe:
- in the left third of the S-axis, weak forces tend to scatter matter through space (repulsion and division forces prevail);
- these weak forces find their mirror counteraction in the right third of the S-axis, where gravitational forces have only one sign - attraction;
- in the central third of the S-axis, the two tendencies are intermixed: the electromagnetic forces have both the sign of attraction and repulsion.
The obtained model of the global S-Trough leads to the idea of a simple principle uniting three forces in the Universe. These three forces are just components of ONE UNIVERSAL LARGE-SCALE FORCE or S - UNIVERSAL FORCE (SUF).
To go further, let’s put forward the following HYPOTHESIS.
There is a constant BIRTH of NEW PARTICLES OF Matter in the Universe due to the action of Weak Forces..
Through what and how this process can take place, we will look at the following sections.
It follows from the new HYPOTHESIS that from the left slope of the S-Trough all new systems possessing the kinetic energy of scattering from the center of “injection” are constantly “rolling down”. They may well skip by “inertia” the center of the S-Trough and get to the right slope, from where they may roll back, being compressed by gravitation. In such a model, it is as if the S-Pendulum is working. The potential limiting amplitude of oscillations for all the matter of the Universe is no less than 61 orders of magnitude. All this can be represented in the form of a purely mechanical model of a ball arrangement on a smooth surface of the S-Troughs, having lowered it from one edge, we will get a constant oscillation of the ball near the center of stability. The complete cycle of such oscillation forms as if a scale loop (S-Loop) (Fig. 2.24).
How to combine this model with the previously discussed S-THROUGHs of each scale class?
There is only one option: to consider the general SYNTHESIS-DIVISION MODEL AS FRACTAL. Then the S - GLOBAL TROUGH (SGT) is the first upper level, the NUMBERED S-TROUGHs are the second level, on the surface of the numbered S-TROUGHs there can exist their local S-TROUGHs of the third level (see Fig. 2.25). Due to this structure, a potentially possible global universal S-CYCLE is split into many local S-CYCLEs, which can be represented as local S-TROUGHs.
Fractality creates a much more complex multistage, cascade process of substance transformation during its movement in S-TROUGHS. Simple schemes of numbered S-TROUGHs are just one slice of a complex multilevel phenomenon.
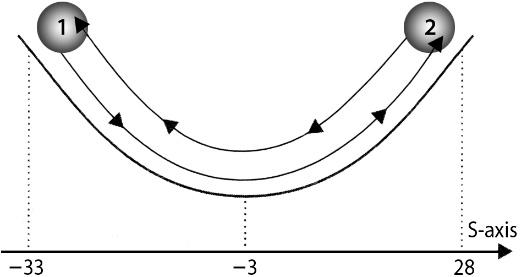
Fig. 2.24. The general dynamics of the Universe can be represented by a closed S-Loop. Vacuum-born particles, flying in different directions, gather back due to gravitation, which can eventually lead to the formation of a black hole consisting of primary maxima. In the same way the Universe, expanding from a primary particle, can return back to the initial state (model of the Pulsating Universe with a Bounce)
If we leave the model representations and go to the three-dimensional images familiar to us, we can build the following picture. From the depths of matter (from the microcosm) all new substance is constantly bursting out (created from maximon) and all new energy is flowing out (potential energy of the maximon connection is released) - the points of space seem to exude substance and energy from themselves, scattering them around.
As a result of addition of all local processes as a whole, the “universal balloon” is inflating. This “balloon” would be blown into small splashes in the void, if gravitational forces “hoop” would not pull matter together, would not gather it into planets, stars and galaxies. Thus, GRAVITATION in this model can be considered as a kind of STRUCTURAL TENSION OF SPACE.
Now let us describe this process using the model of the global S-Trough. The physical vacuum gives birth to all new, ever larger particles. There is a continuous birth of matter (at conservation of matter and energy), which we perceive as birth only because the lower floors of matter are hidden from us in the darkness of ignorance and unseeing (see Fig. 2.26).
In general, in the microcosm there is a constant growth of the size of systems due to expansion, due to the connection of small particles into larger ones. “Born” particles do not appear out of nothing, they are formed in the course of a complex “construction” of maximons on invisible for us floors of matter (in Dirac’s basement). The moment of their birth is only a transition by them through the boundary of our knowledge, through the horizon of the microcosm, through that horizon, the passage through which from the bottom to the top makes matter a substance in our usual sense.
METHODOLOGICAL DEPARTURE
Here it is necessary to define the terminology. Hereinafter we will call as matter everything that consists of maximons. Matter will be divided (rather conditionally) into two types: matter and ether. By ether we will understand a medium of maximon. By matter we will understand stable constructions from maximon, the density of which is lower than the surrounding ether.
At the other large-scale edge of the Universe, the opposite process is going on. Everything that is scattered by the microcosm is collected by the megamir, it strives to return everything to the center of the S-Trough of Potential stability. Both processes are accompanied by the release of energy, because ANY decrease of CAPACITY (height) in the S-Trough is accompanied by the release of free energy.
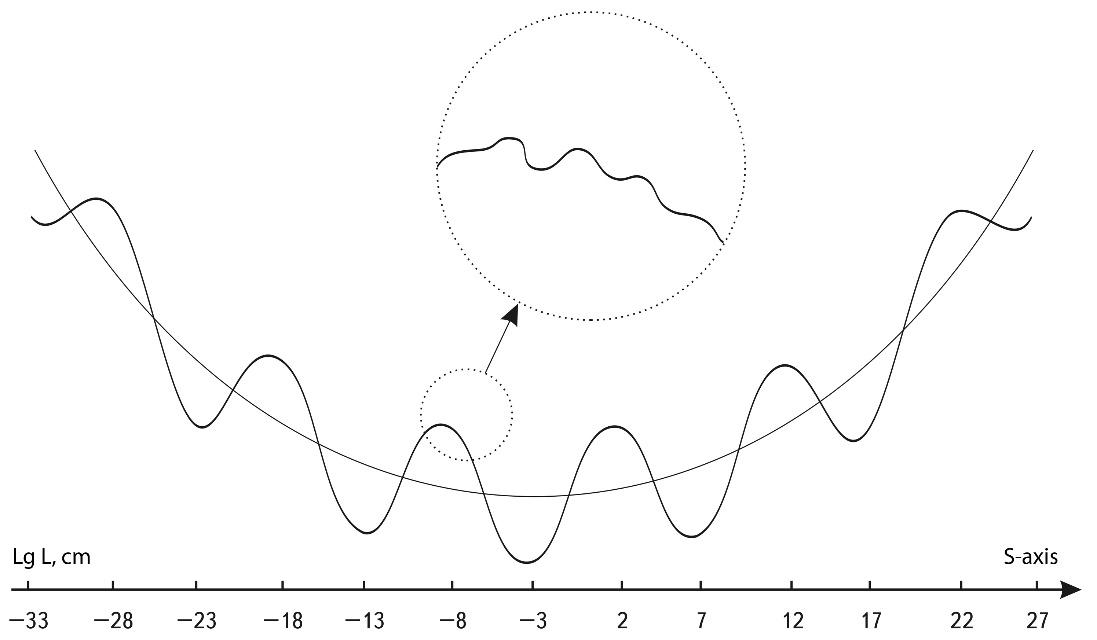
Fig. 2.25. The surface of the global S- trough at closer examination can appear fractal, i.e. covered with secondary, tertiary, etc. troughs of stability. Therefore, any dynamics in the Universe can have a cascade-stage, quantum character
Both processes can not stop in the SCU, but by inertia skip the lower stability point, i.e. both processes can go through, through all levels of the Universe structure, towards each other, and these processes are peculiar for all levels of scales (without exception), for all kinds of systems. But due to the fact that in a number of systems these two global processes are hidden in the depths of structural levels, they may not be directly observed.
There are, however, such levels of organization of the Universe at which these processes manifest themselves visually. Then S-Loop has a vivid natural embodiment.
For example, large-scale loops can be observed on the surface of the Sun. These are prominences, or giant emissions of the Sun’s excess energy, which is released due to processes occurring at the deep levels of its matter structure (see Fig. 2.27A).
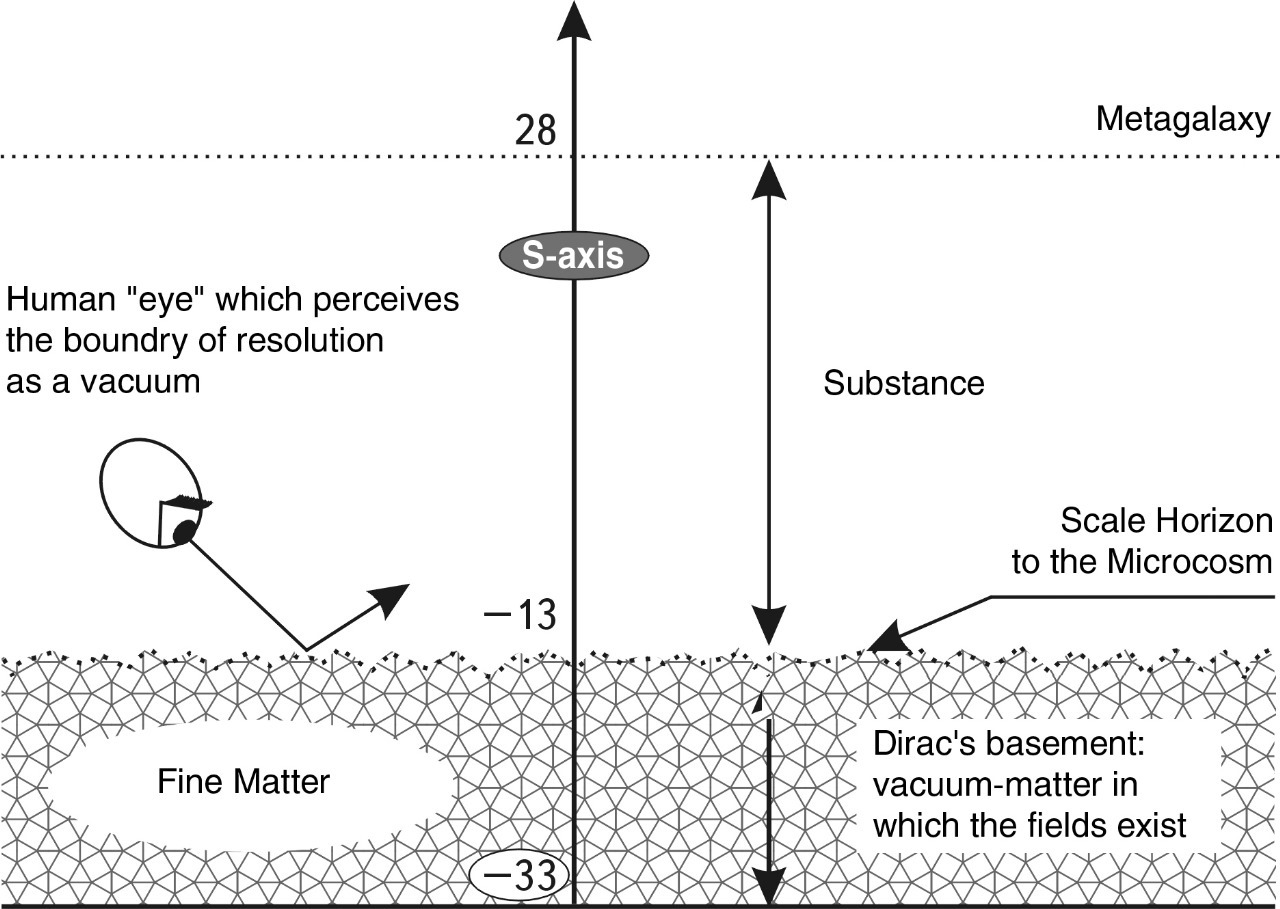
Fig. 2.26. Matter in the range from \(10^{-15}\) cm to \(10^{28}\) cm is perceived by science as a material Universe, while in the Dirac basement, in the range from \(10^{-33}\) to \(10^{-15}\) cm, it is perceived as an unstructured non-material substance - vacuum, which is a conductor of all kinds of fields. But, most likely, this basement has its own complex hierarchical dispersed structure, which is not perceived as such because it is “behind” the large-scale horizon of penetration of human cognition
If one examines the life of the Sun over a long enough period of time, it will be seen that it is all surrounded by a layer of prominences - fountains of matter and energy that fly out from inside the star and back again.
Together, the prominences form a kind of energy-matter “coat” around the Sun (see Fig. 2.27B). Each individual prominence is a magnificent symbol of the M-loop. Such “fountaining” should be a common phenomenon for all stars.
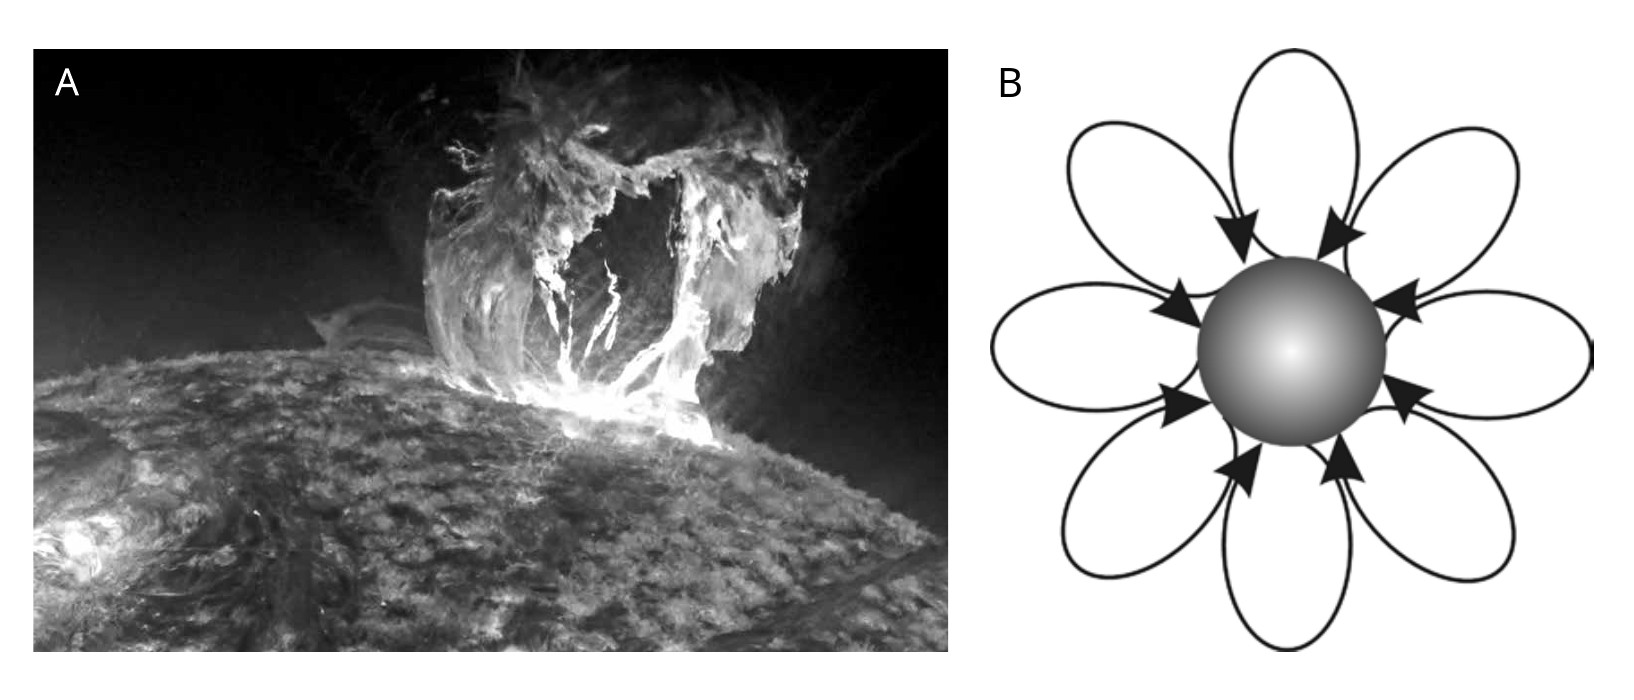 Fig. 2.27.
А. A giant prominence on the Sun. Such an ejection of matter from the Sun ends mostly with its fall back, although some of the matter and radiation escapes into open space.
B. If we “view” the Sun “through the camera” for a sufficiently large period of time, it will appear that the Sun is all covered with giant emissions forming loops around it. They can be called a material “coat” of the Sun (by analogy with a “coat” of virtual particles around, for example, a proton). A system, from the surface of which the material jets spout, will look as if clothed in a virtual “coat” during a long exposition
“Fontaning” is also observed in elementary particles. All particles are “dressed” in “coats” of other virtual particles. This means that each particle emits from itself other particles, which immediately return back and disappear. These fountains of virtual particles form “coats” around them. Thus, an electron is dressed in a “coat” of virtual electrons, positrons and photons; a nucleon is dressed in a “coat” of virtual pions, nucleon-antinucleon pairs and other strongly interacting particles3.
“Fountains” and every point of “empty” space - vacuum. Vacuum is continuously “boiling” with virtual particles, which are born and immediately disappear in the “void”.
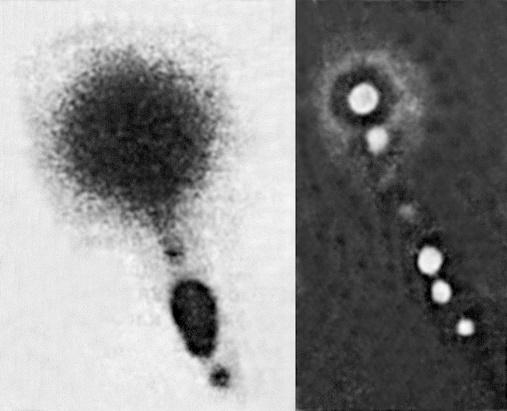
Fig. 2.28. Photograph of the nebula M87 = NGC 4486, which is the nucleus of the radio galaxy Virgo-A. The discrete ejection of matter from the galaxy nucleus can be clearly seen when photographing it in a different way
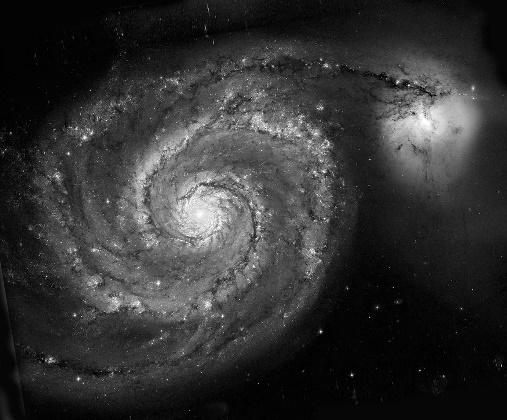
Fig. 2.29. Photograph of the galaxy M51. At the end of one of the spirals, a small galaxy companion is visible, which may well be an outburst from the active nucleus of this galaxy
There is an assumption4 that exactly this process is responsible for the vacuum temperature - 2.7 K (so-called relic radiation). So if for particles the process of birth from “emptiness” is virtual, then for energy, manifested in the vacuum temperature, is quite real!
S-Loops can also be found on the galactic scale floor. The nuclei of galaxies occasionally erupt with excess energy and eject jets and clots of matter (see Fig. 2.28). Due to gravity, these clots return back to the nucleus. If the ejection force exceeds a certain threshold, then so much matter and energy is ejected from the nucleus that a new galaxy is born (see Fig. 2.29).
On other floors of matter S-Loops are realized, apparently, according to a more complicated scheme. But, in general, it is obvious that energy and matter are bursting out of the depths of matter in its various material forms, which creates in the Universe a constant “pressure” from the lower levels of its structural structure. From the upper levels, gravity presses, which prevents matter from dispersing throughout the “empty” space and which forms planets, stars and galaxies from matter.
According to some models5, the mass of the Universe is such that gravitational forces will not let it fly apart finally, and sooner or later the great return of matter to the starting point will begin. The Universal M-loop will bend, and the motion of matter will reverse - the Universe will pass from the expansion stage to the contraction stage (see Fig. 2.23). Therefore, the most global scale loop can be considered to be the supposed cycle of the Universe: FROM THE BIG EXPLOSION FROM THE POINT TO THE EXPANSION AND BACK TO THE POINT. Of course, the whole Big Bang model is highly hypothetical, despite its many proponents in cosmology. We only show here that the S-loop has a theoretical possibility to be realized for the whole Universe.
But if the global S-loop originating in vacuum is only a theoretically admissible version, which cannot be checked, the existence of local fragments of M-loops in the form of white and black holes is confirmed by some astronomical observation6. While the former eject matter outwards, the latter, on the contrary, absorb it - so that it becomes invisible for an external observer.
How do black holes appear? When the gravitational forces are no longer counteracted by the internal pressure of the “burned out” star, if the mass of the star is greater than 2.5 solar masses, the core of the star shrinks to the size of the gravitational radius (about \(10^6\) cm) and goes beyond the event horizon7. What happens inside with the matter can only be guessed, here even theoretical calculations are sometimes powerless. In a neutron star, the density of matter is so great (of the order of \(10^{15}\) g/cm\(^3\)) that the electron shells of the atoms are stripped off, leaving solid nucleons compressed into a tight ball. In a black star hole, the density of matter will be higher by at least three orders of magnitude, and it is obvious that even elementary particles known to science today cannot exist there. In what form the matter will be presented, if the black hole will shrink to a point, as it is supposed by some models8, it is impossible to say at all. In addition to black holes with masses typical of stars, according to astronomers, there are almost certainly supermassive black holes located in the centers of galaxies.
But if the origin of black holes (BHs) is somehow explainable through gravitational collapse, then what forces of nature can generate white holes (WH) - remains a mystery. One thing is clear - a huge amount of matter is born from the “empty” space in the WH. Then we can correlate to WH the ascending branch of S-Loop, and to BH - the descending one.
The question arises: can there be a closed WH-BH process in the Cosmos, i.e. such a process in which all the matter born earlier in the WH would be pulled down in the BH with time? In this case, we would have a completely closed S-Loop, which would be a local model of the Big Bang. After all, here almost from a point of space can be born matter, which, filling the void around itself, can turn into a galaxy. In time, the whole galaxy can gather back to its center, and shrink to the state of the BH.
Such pulsation of matter is not as fantastic as it may seem at first sight. Many observational data can be interpreted as fragments of this process.
From the point of view of modeling processes in the form of S-Loops, the difference between vacuum boiling, proton surface, prominences on the Sun, galactic S-Loop, or global S-Loop consists only in the scale length of S-Loop and its starting point.
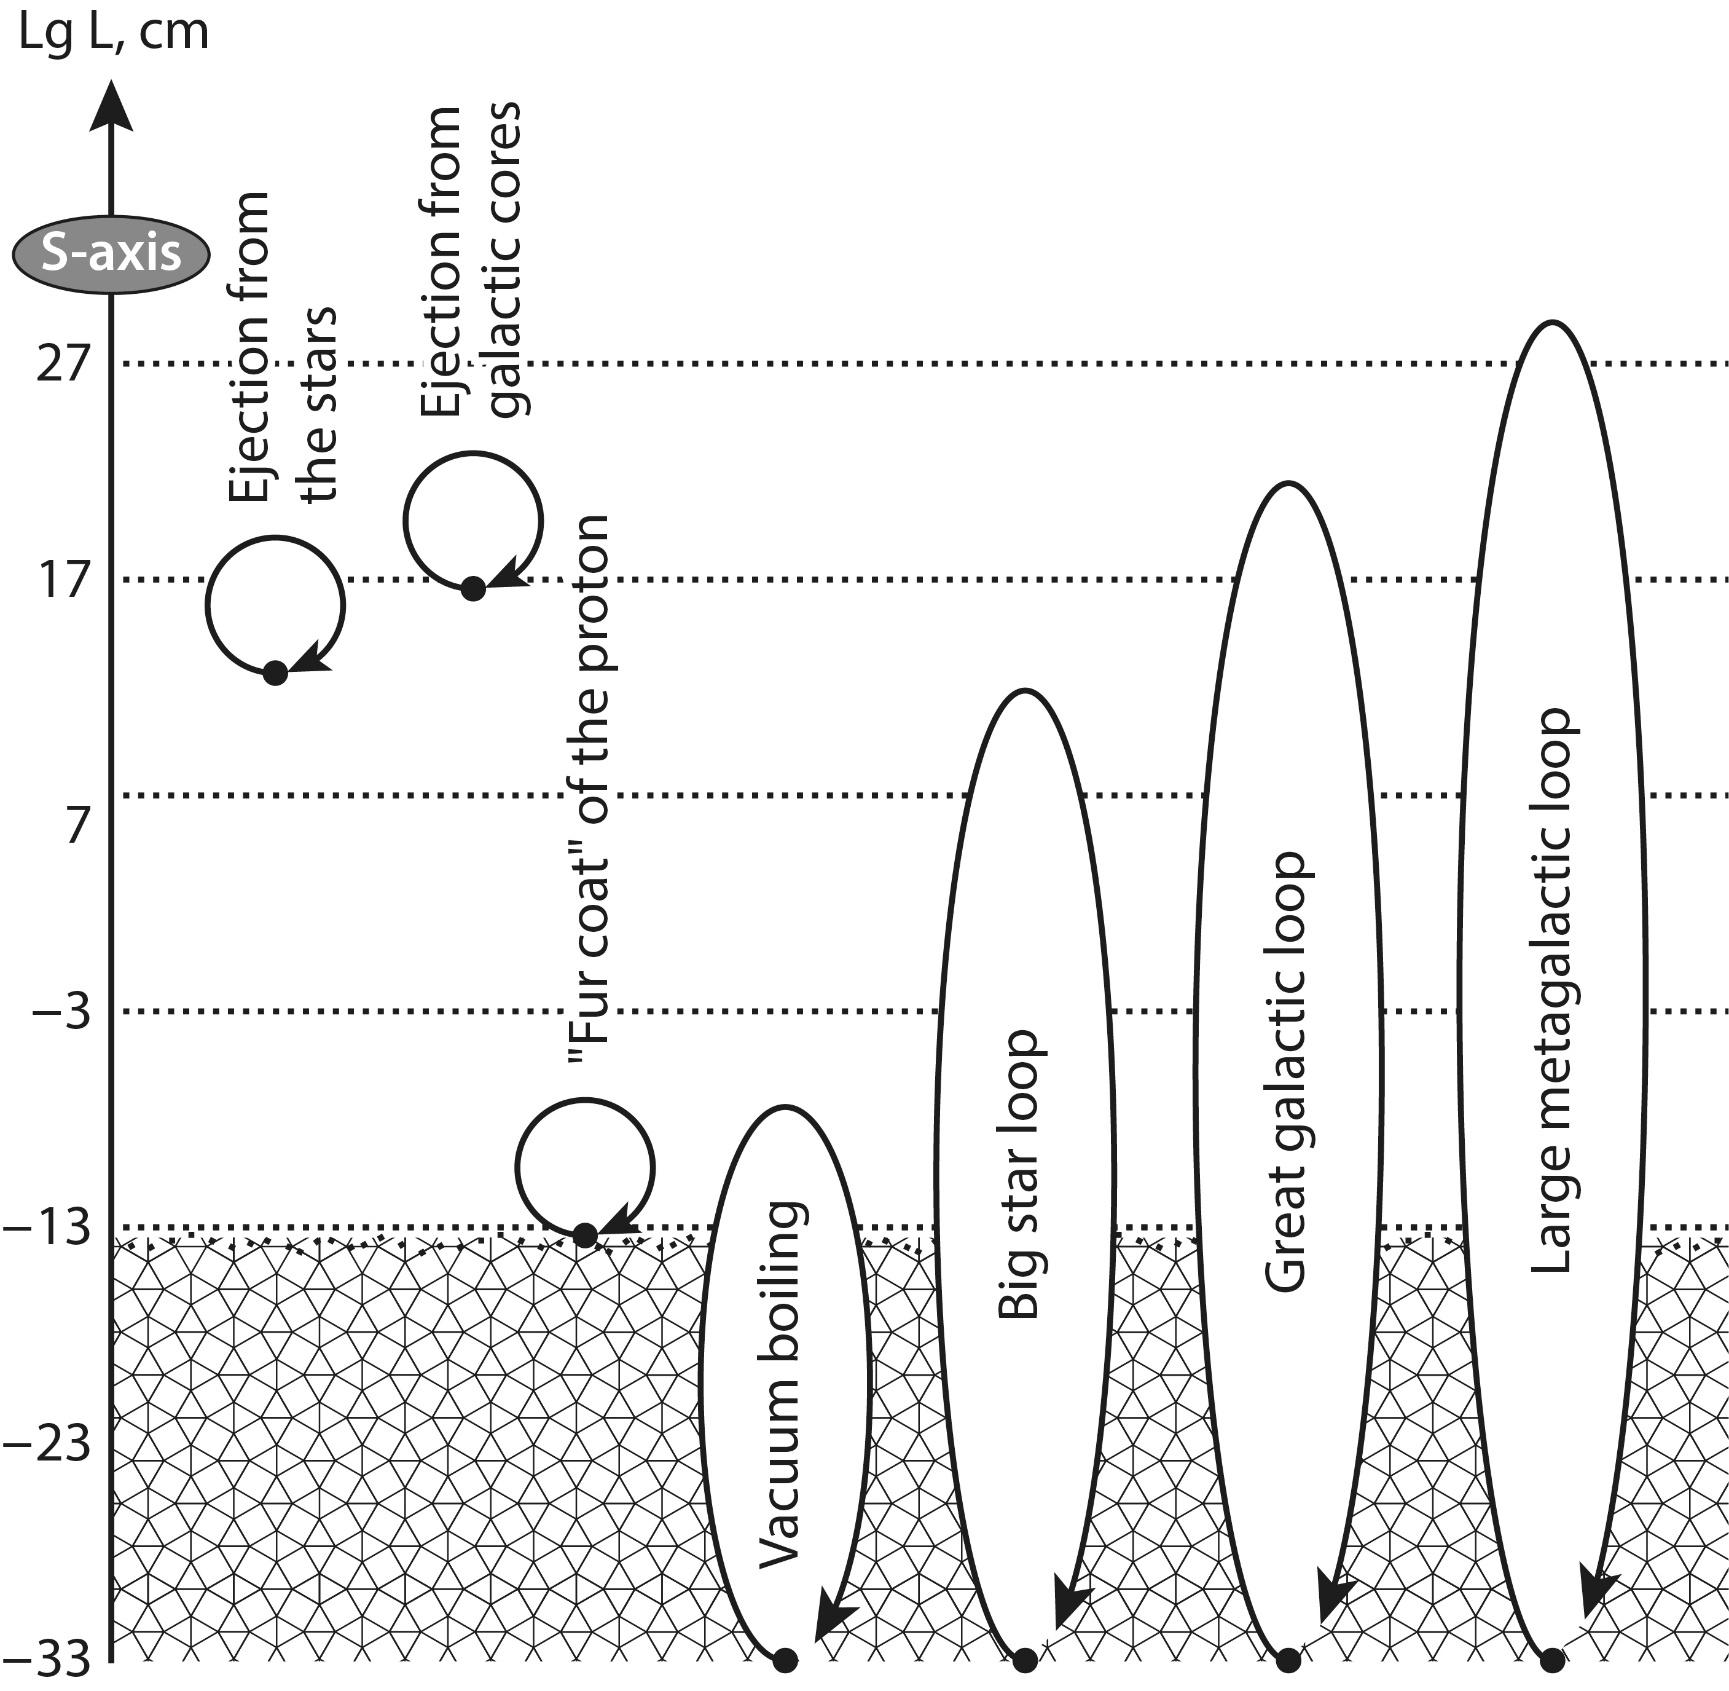
Fig. 2.30. Scheme of possible formation of different S-Loops. The loops may differ both in length and in the “depth” of nucleation. Shown on the right are four hypothetical large M-loops that could start at the maximon level
The latter, however, is likely to be rooted at the lowest structural level of matter, \(10^{-33}\) cm, in all cases (see Fig. 2.30).
Suppose that the substance has collapsed to the ground. If it is to the very bottom, then the excess energy will simply fly away into space and in this place will remain in time a “clean spot” of unperturbed ether, which will not be able to attract anything at all. Exactly to such final should come all black holes according to S. Hawking’s version. But are there black holes that absorb everything around them? It should be a “pore in the ether”, devoid of structure. We can say - pure matter is matter without structuring by its particles. And why not? Anything can happen in the Universe. If there can be resonant bubbles with the size of \(10^{-13}\) cm, there can be resonant bubbles with the size of \(10^7\) cm, and so on. “quantized” sizes. Of course, the division of the Universe into our world and the mirror world is a convention. The Universe is unified in these two of its manifestations, but science has so far studied only one of these sides. IT’S TIME TO SEE THE OTHER SIDE OF THE COIN.
So, we see that S-Loops are found on all floors of the Universe. They are a vivid example of S-Dynamics. The motion along the S-axis has a whole spectrum of sweeps, which determines the length of the S-Loop. The shortest S-Loops are “breaths”, where the size changes by percentages and fractions of a percent. Next to that are “pulsations,” a prime example being a heartbeat. In pulsations, the object is preserved, its integrity is not altered. The relative magnitude of pulsations can be either very small (e.g., heartbeat) or very large (e.g., - Cepheids, whose size changes up to two times). The author is not aware of pulsations with such a magnitude on the S-axis when the object would preserve its structure when its size changes by a factor of ten or more.
Next come all kinds of S-Loops with discontinuities. A rupture means that the object in the expansion phase loses its integrity and is dispersed in the environment. In general, the environment returns the matter to go back into the loop. For example, after the explosion of a supernova star, a huge part of the matter is dispersed in space, forming the diffuse matter of the galaxy. Subsequently, this matter participates in the process of compression and the birth of new stars, already richer in heavy elements. Thus, the cycle is completed. In other words, first the star, exploding, expands, while it moves along the S-axis to the right, but its integrity, “individuality”, perishes in this process. The matter in this process is dispersed in space. After some time, the same matter (together with other matter) is compressed into a new star, and the cloud fragments into stellar embryos. The matter moves back along the S-axis, to the left. The length of the M-loop for collapsing stars exceeds 5-7 orders of magnitude along the S-axis.
We observe a similar picture of discontinuous S-loops in the Biosphere. Any organism dies, and the substance of its body is dispersed in the space of the planet. Subsequently, a new organism is born from this matter.
However, there is a significant difference from stars: in the Biosphere, each new organism is formed “around” a germ cell. This does not seem to be the case with stars.
The expansion to the right along the S-axis from the point of “person” we will call the right loop. The embryo, gathering around itself the substance from the environment, grows rapidly, moving upward along the S-axis. In the S-diagram, this process can be represented as a left S-loop. If we combine these two processes, we get a kind of S-eight (see Fig. 2.32), which may not always be symmetrical, most likely, its upper loop is always longer than the lower one, and besides, its upper branch has a break. Does not the example with biosystems suggest to us that the birth of new stars must also have an embryo?
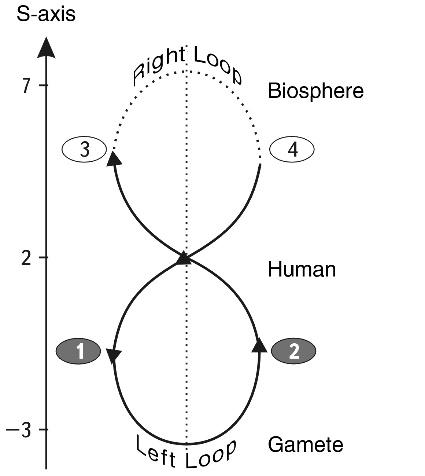
Fig. 2.32. Schematic S-loop for a human (similar to the Mobius ribbon). 1 - formation of a germ cell and conception; 2. - fetal growth and birth; 3. - Dispersion of human matter in the Biosphere after death; 4. - collection of matter from the Biosphere in the process of human growth and life
What if, for example, such an embryo could be a neutron star? If the M-similarity is realized here, astrophysics will have to reconsider the theory of star birth.
But one can also find examples of indisputable similarity. It is known from biology that when members of a population die en masse, its birth rate increases.
Thus, death acts as a stimulant for the reproduction of biosystems.
We see something similar in the cosmos. The explosions of supernovae violate the gravitational stability of the gas-dust complexes of the interstellar medium, which leads to the beginning of its fragmentation, compression, and, finally. - to the formation of new stars, i.e. (similarly to the situation with biosystems) death acts as a stimulant of birth.
Let us return once again to the hereditary S-loop. For a human, the M-loop can be well investigated at the level of its lower half, at the moment when a sex cell appears. It is likely that the properties of the sex cell are determined not only by the genetic material transferred to it, but also by the whole state of the organism (taking into account the science of astrology - also by the properties of the whole solar system, and possibly the whole Universe). A sex cell, moving from the place of its formation to the place of meeting with another sex cell, remains at the same scale level. The synthesis of two sex cells leads to the beginning of the process of development of a new organism, i.e. upward movement along the S-axis. Thus, we can clearly trace in this process the unbroken lower part of the “S-Eight”, while its upper part is broken in the medium (see Fig. 2.32).
It can be noted that such S-LETTERS OF TRANSFORMATION go beyond the limits of a particular S-CLASS. In other words, a star cannot beget a galaxy, a human being cannot beget a star, etc. The process of rebirth takes place within its own class. But if we examine the upper half of the eight more closely, we find that it does open up into a neighboring class. Thus, the substance that goes to create a new organism comes not only from the Earth, but also from the cosmos9 from the space of the Solar System, hence, not only the stellar level, but also the galactic level is involved in the creation of each organism on the Earth, since the interstellar substance coming to the Earth is collected in the galactic expanse. On the other hand, we are talking about the matter which is born in the depths of stars, hence, if in the spatial understanding, it comes from the galactic level, in the large-scale understanding it comes from the level of stars. Similarly, for stars, it is unlikely that the matter for them comes from neighboring galaxies, most likely, galaxies are closed by matter flow.
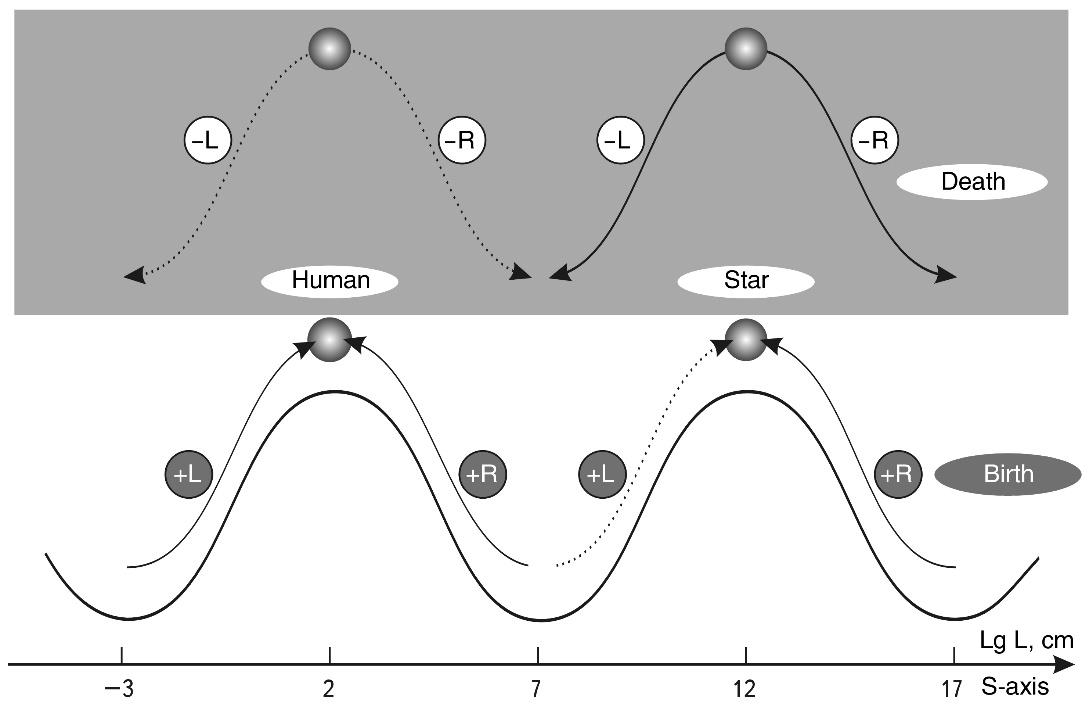
Fig. 2.33. S-diagrams of birth and death for a human and a star. The dotted line shows the assumed, not yet scientifically revealed trajectories
By the way, the presence of an embryo necessary for the birth of cosmic objects is hypothetical only for stars. For galaxies, the presence of the embryo, perhaps, is not in doubt. Most likely such are quasars.
The size of quasars is about 5 orders of magnitude smaller than the galactic size, but their active energy and the fact that they are surrounded by nebulae, whose sizes already relate to the typical sizes of galaxies, give reason to PREPARE that we see the beginning of the birth process of a new galaxy, which grows out of a quasar in a time comparable in proportions to the time of growth of the embryo of the Biosystem10. Here we see the manifested right positive S-vector (see Fig. 2.33).
-
Polyan V. I. Channels of Life. Novosibirsk: NKI, 1990. P. 7. ↩
-
Yavorsky B. M., Detlaf A. A. Handbook of Physics. Moscow: Nauka. Fizmatlit, 1996. P. 545. ↩
-
Shirokov Yu. M., Yudin N. P. Nuclear Physics. Moscow: Nauka, 1972. P. 316. ↩
-
Khodkov A. E., Vinogradova M. G. On Core Problems of Natural Science. St. Petersburg: Nedra, 1977. P. 29. ↩
-
Markov M. A. On the Nature of Matter. Moscow: Nauka, 1976. ↩
-
Penrose R. Singularities in Cosmology // Cosmology. Theories and Observations. Moscow: Mir, 1978. P. 336–348. ↩
-
Mitton S., Mitton J. Astronomy. Moscow: Rosman, 1995. P. 120. ↩
-
Shklovsky I. S. Stars. Their Birth, Life, and Death. Moscow: Nauka, 1977. ↩
-
Sukhonos S. I. Does Cosmic Dust Stimulate Evolution? // Chemistry and Life. № 1. P. 91–93. ↩
-
Sukhonos S. I. A View from Afar // Knowledge and Power.— 1981.— № 7. P. 31–33. ↩
Phase portrait of a mirror-symmetric universe
In the previous chapter, we put forward the hypothesis that our material world has its mirror antipode - the world of physical vacuum - aether. It differs from the classical empty vacuum - space by the fact that it contains matter (maximons) and the potential energy of its connection in the bound state. It also differs by the fact that it can generate new photons, electrons, and other elementary particles, which consist of maximons in the same way as planets and stones consist of atoms. Although the world of ether was introduced based on purely formal principles, relying only on the laws of scale symmetry, further analysis showed that this unknown world allows us to find real ways out of many contradictions of modern physics.
In this chapter, we shall consider only one but very important consequence of the hypothesis put forward - the THERMODYNAMICS OF THE UNIVERSE.
FREE REASONING
It is well known that all processes in the Universe go with the release of heat, which is fixed in the second beginning of thermodynamics. A simple generalization of this phenomenon led physicists to the conclusion about the heat death of the Universe. In recent years, in works on synergetics, this conclusion has been carefully circumvented by separating closed and unclosed systems. However, within the framework of traditional cosmology, the question of the Universe’s non-closedness has no physical interpretation. It is unclear where the Universe should be “unclosed” if it is the whole world. Synergetics introduces a certain flow of negentropy, which comes from outside into an open system and thus removes the possibility of its rapid degradation. But where does the flow of non-entropy from outside the Universe come from, if there is nothing outside it (according to the generally accepted model)? Where is the “faucet” from which this grace pours into the Universe and prevents it from “drying up”?
The vagueness of all these questions makes astrophysicists and cosmologists consider the Universe still a closed system and conclude that its heat death is inevitable. Here arises a very paradoxical situation. According to the thermodynamic theory, in the Universe, all processes should lead to degradation, but the analysis of observational data shows that in the Universe in the foreseeable past, the complexity of structures only increases.
A similar conclusion can be drawn for the Solar System. The Biosphere is no exception. There is no doubt that the information complexity of human civilization is also increasing. The question arises: where does all this diversity of the world come from and why is it, contrary to the second principle of thermodynamics, only growing?
Failing to find the source of the constant increase of the information complexity of the Universe, cosmology makes a paradoxical, but logically, the only conclusion available to it: the modern Universe is the consequence of a single and random non-entropic burst, which gave impetus to all development processes in the past, and what we have today is just an inertial phase of this phenomenon. Sooner or later, the consequences of this surge under the pressure of chaos and thermal disorder will be destroyed, and the world will roll again along the “correct” path - to degradation and simplification.
Consequently, according to this version, in the infinite past and infinite future, the world is chaotic and disorderly, but in some fragment of its history there was an incredible surge of negentropy, due to which we - observers and children of this surge - appeared, but we have no future, as the world will still return to the “normal” chaotic state. Terrible philosophy.
Let’s note once again that this paradox is not imposed artificially by some demonic forces, it arises from a simple discrepancy between two obvious and obvious, repeatedly checked and not causing doubts in competent experts facts, namely - between the fact of heat generation at any processes and the fact of increasing complexity of the Universe.
Thus, the “salvation” solution, which scientists proposed, laying a gigantic, but still random burst of non-entropy in the basis of evolution, is the only solution for traditional science. On the whole, this solution is a surrogate solution, for any randomness is an unrecognized regularity, and by taking such a solution, science has simply “swept the problem under the rug”. This approach is an elegant way to give a quasi-scientific and quasi-logical explanation to one’s ignorance, a way to keep a good game with a bad one. But even this palliative does not stand up to criticism as soon as we move from the phenomena of rather distant and vaguely calculated cosmology to a more clearly realized field - biology. Let us take just one very simple fact.
The fact is that all protein molecules are left-handed. At the same time, no physical factors that could lead to such a total left-turning situation have been found. In classical science, only the factor of chance remains.
However, “…calculations show that the probability of spontaneous origin of even the most primitive organisms in nature is absolutely excluded. Thus, it is calculated that to be able to live, the simplest living organism must consist of at least 239 protein molecules. The probability that all amino acids will be left-handed is \(10^{-71}\). The impossibility of this event is demonstrated, in particular, by the fact that the number of all protein molecules that have ever existed on the Earth does not exceed \(10^{52}\), and the probability that a simple combination of 239 left-rotating protein molecules alone would occur by chance, in the previously inanimate nature of the Earth, with the quantitative equality of left- and right-rotating protein molecules, is extremely small and practically impracticable, since it is only \(10^{-29345}\). “1
Therefore, there can be no talk of the accidental origin of life.
Let us repeat once again the main contradiction of thermodynamics. Local observations of physical phenomena undeniably testify to the dissipation of energy in the form of heat in any process. Generalization of this indisputable observation to the entire Universe leads to the conclusion about the inevitability of heat death and the dominance of the processes of destruction over the processes of creation. But global observations of the development of the Universe and analysis of the development of life on Earth undeniably testify to the dominance of processes of complication, processes of creation. Between these two facts, it is possible to find a logically consistent connection, as we will show further, only through a large-scale dimension. Here we will give only a preliminary approach to the problem.
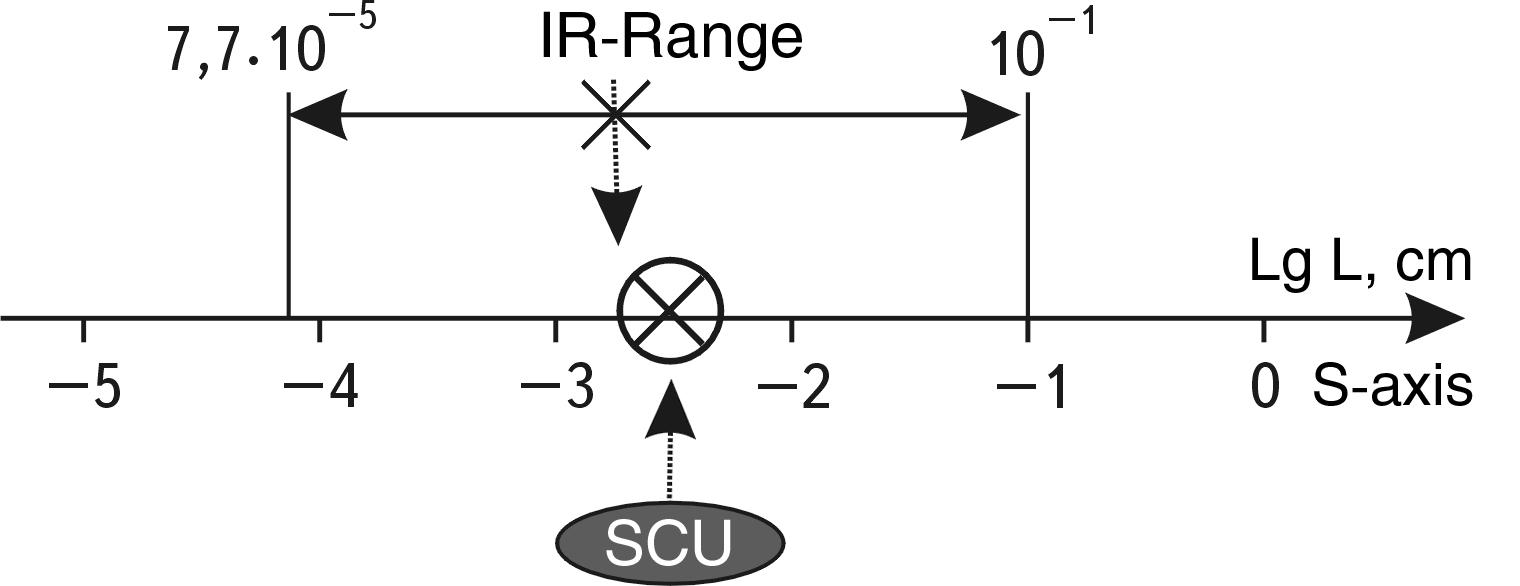 Fig. 2.34. The range of infrared wavelengths. It can be seen that its scale center coincides almost perfectly with the S - Center of the Universe (SCU).
Let us start with the analysis of all entropic processes in the phase space “scale-stability” (S-S DIAGRAM). If all processes in the microcosm and megamir lead to heat generation, then everything in this world will sooner or later end in thermal (infrared) radiation. Let’s ask ourselves a question, where on the S-axis is the range of infrared rays (IR)? The answer is in any physics reference book: the IR range occupies a segment of three orders of magnitude from \(7.7 \times 10^{-5}\) to \(10^{-1}\) cm. And if we plot this segment on the S-axis and divide it in half (Fig. 2.34), we get a point that coincides almost perfectly with the S - Center of the Universe (SCU). This fact is of great interest. In addition, observations show that the maximum thermal emission of most bodies is indeed in the SCU range, i.e., the middle order within the entire infrared range. But this is either a fantastic coincidence or a unique pattern! Let’s forget about infrared radiation for a moment. Let’s consider the S - Global Trough (SGT) from the position of abstract energetics. Any movement downward, to the lower point of stability, must be accompanied by the release of potential energy and its transformation into kinetic energy. Moreover, since all movements lead to the lower point, formally, it is here that the cascade process of energy transformation into some scale-centered form should end (see Fig. 2.35).
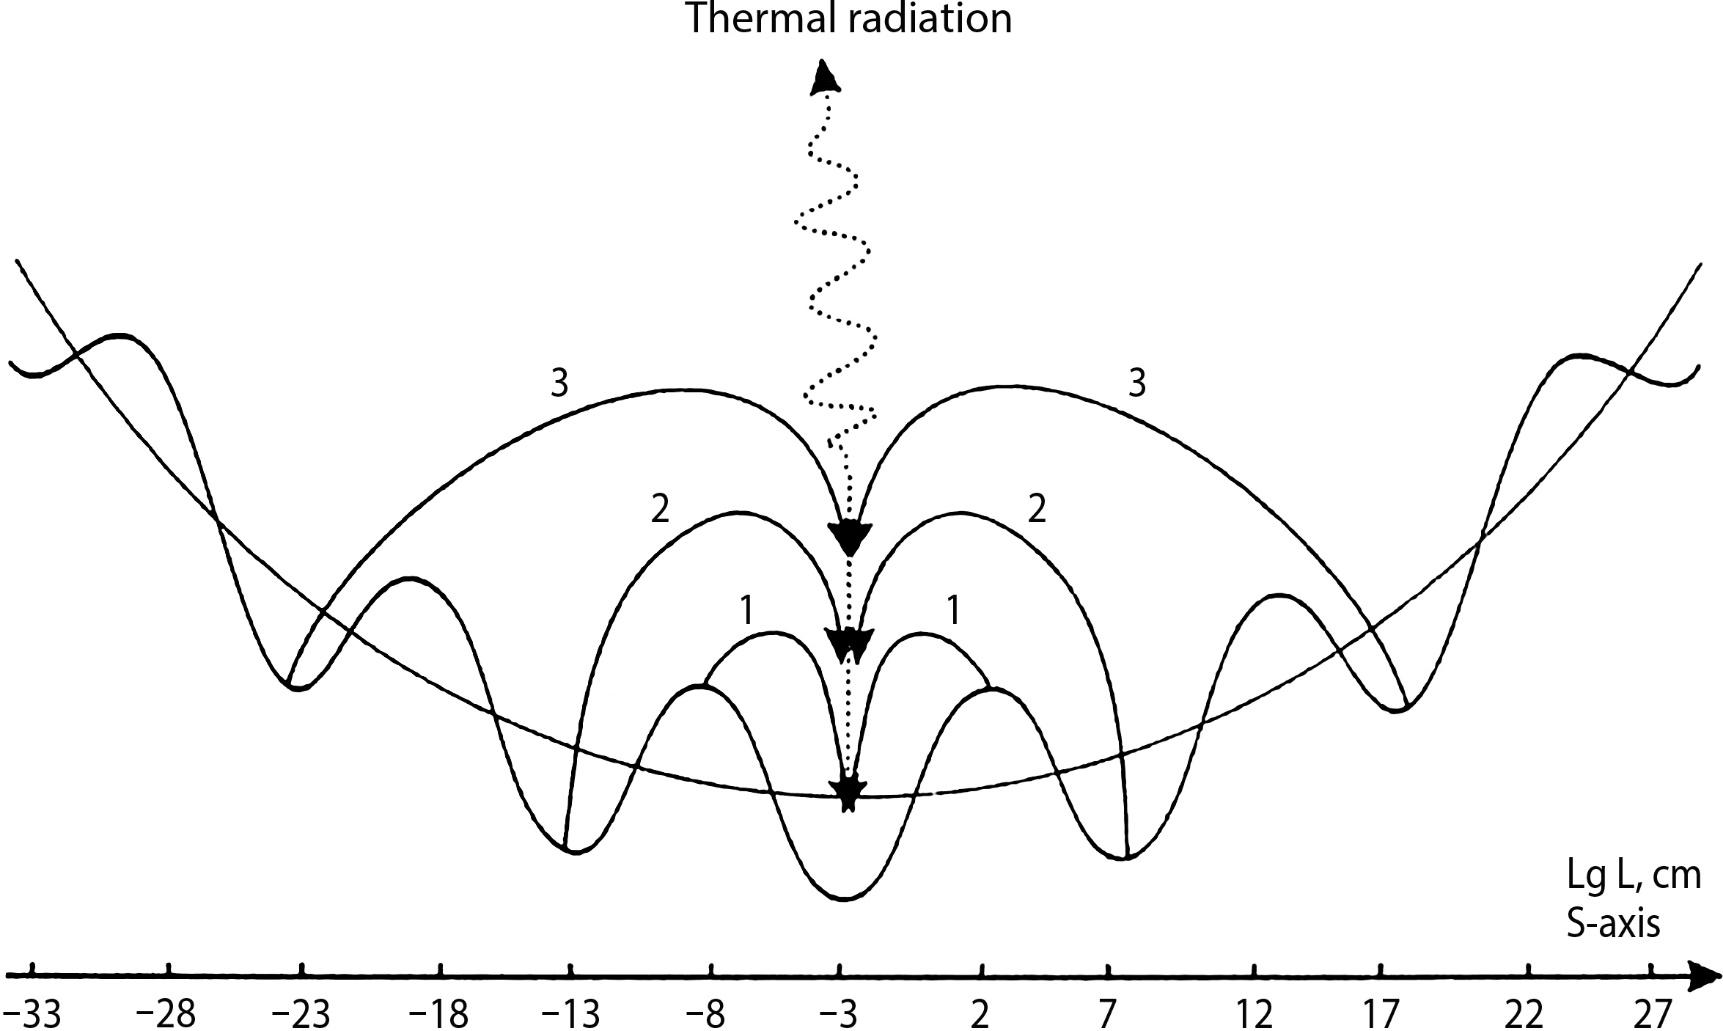
Fig. 2.35. Scheme of energy flows of the Universe on the fractal surface of the S - Global Trough. 1 - chemical oxidation (combustion); 2 - nuclear energy; 3 - hypothetical energy of electron nuclei released in galaxy nuclei.
It will be logical to depict this process as the energy flowing down from the two slopes of the SGT to the middle point. It is here where all the energy of the Universe in the form of heat is really collected. Thus, our rather abstract model turned out to be a large-scale interpretation of the second beginning of thermodynamics. But in the second beginning, there is no word about scale symmetry, while the S - Global Trough model is surprisingly symmetric.
So, figuratively speaking, there is a thermal energy flow into the S - Center of the Universe (SCU). Let us construct a generalized diagram of energy processes in the Universe (see Fig. 2.36). All dynamic processes in the left part (in the microcosm) lead to the lower stability point of the global S - Global Trough to the right (vector “1”), and all processes in the megaworld lead to the same point to the left (vector “2”). At the same time, all processes at all scale levels of the Universe lead to heat generation (vector “3”). On the model of the global MF-TROUGH it can be depicted as three vectors. Dynamics of the microcosm “1” and megamir “2” lead to the appearance of excess heat “3” - so far this conclusion does not bring anything new, being only a parametric portrait of the second beginning of thermodynamics on the M-U DIAGRAM. The only thing new here, perhaps, is that the heat vector is located on the S-axis exactly at its center!
So, any process in the Universe eventually sends into the etheric space a dynamic excitation with a wavelength corresponding to the S - Center of the Universe (SCU). Thus, figuratively speaking, every process in the Universe is “taxed with heat tax”: “If you want to do something, heat up the space” - the more you do, the more you heat up. And there is no way to escape from this “tax service” of the Universe. This is the second beginning of thermodynamics. What is the collected “tax” spent on? Classical physics sees only one thing - the chaos of heat death. But it is not so, everything in the Universe is reasonable. Let’s show it on the phase diagram.
Earlier we put forward a formal systemic HYPOTHESIS that the physical vacuum is a mirror material connected material world of the Universe. If we take into account the history of science, then further we can speak about the Ether, which fills all spaces in a certain way and reacts to changes in it in a holistic way - as a continuous medium. I.e., in the author’s opinion, the ether is a homogeneous medium of maximons.
Earlier we PROPOSED that this medium expands at mega-levels and contracts at micro-levels (see Fig. 2.36). At the same time, we did not ask ourselves where the energy for this process comes from. Now we can assume that it is supplied by thermal fluctuations of maximon - “3”, and it is these thermal fluctuations that provide expansion of space “-2” and collapse of its parts “-1”.
Let’s consider the path of energy on the phase diagram to the end (see Fig. 2.36). The right branch of etheric expansion “-2” closes to the right branch of gravitational contraction (vector “2”). The left branch of micro-compression of the maximon structure “-1” closes to the left branch of the real expansion “1”.
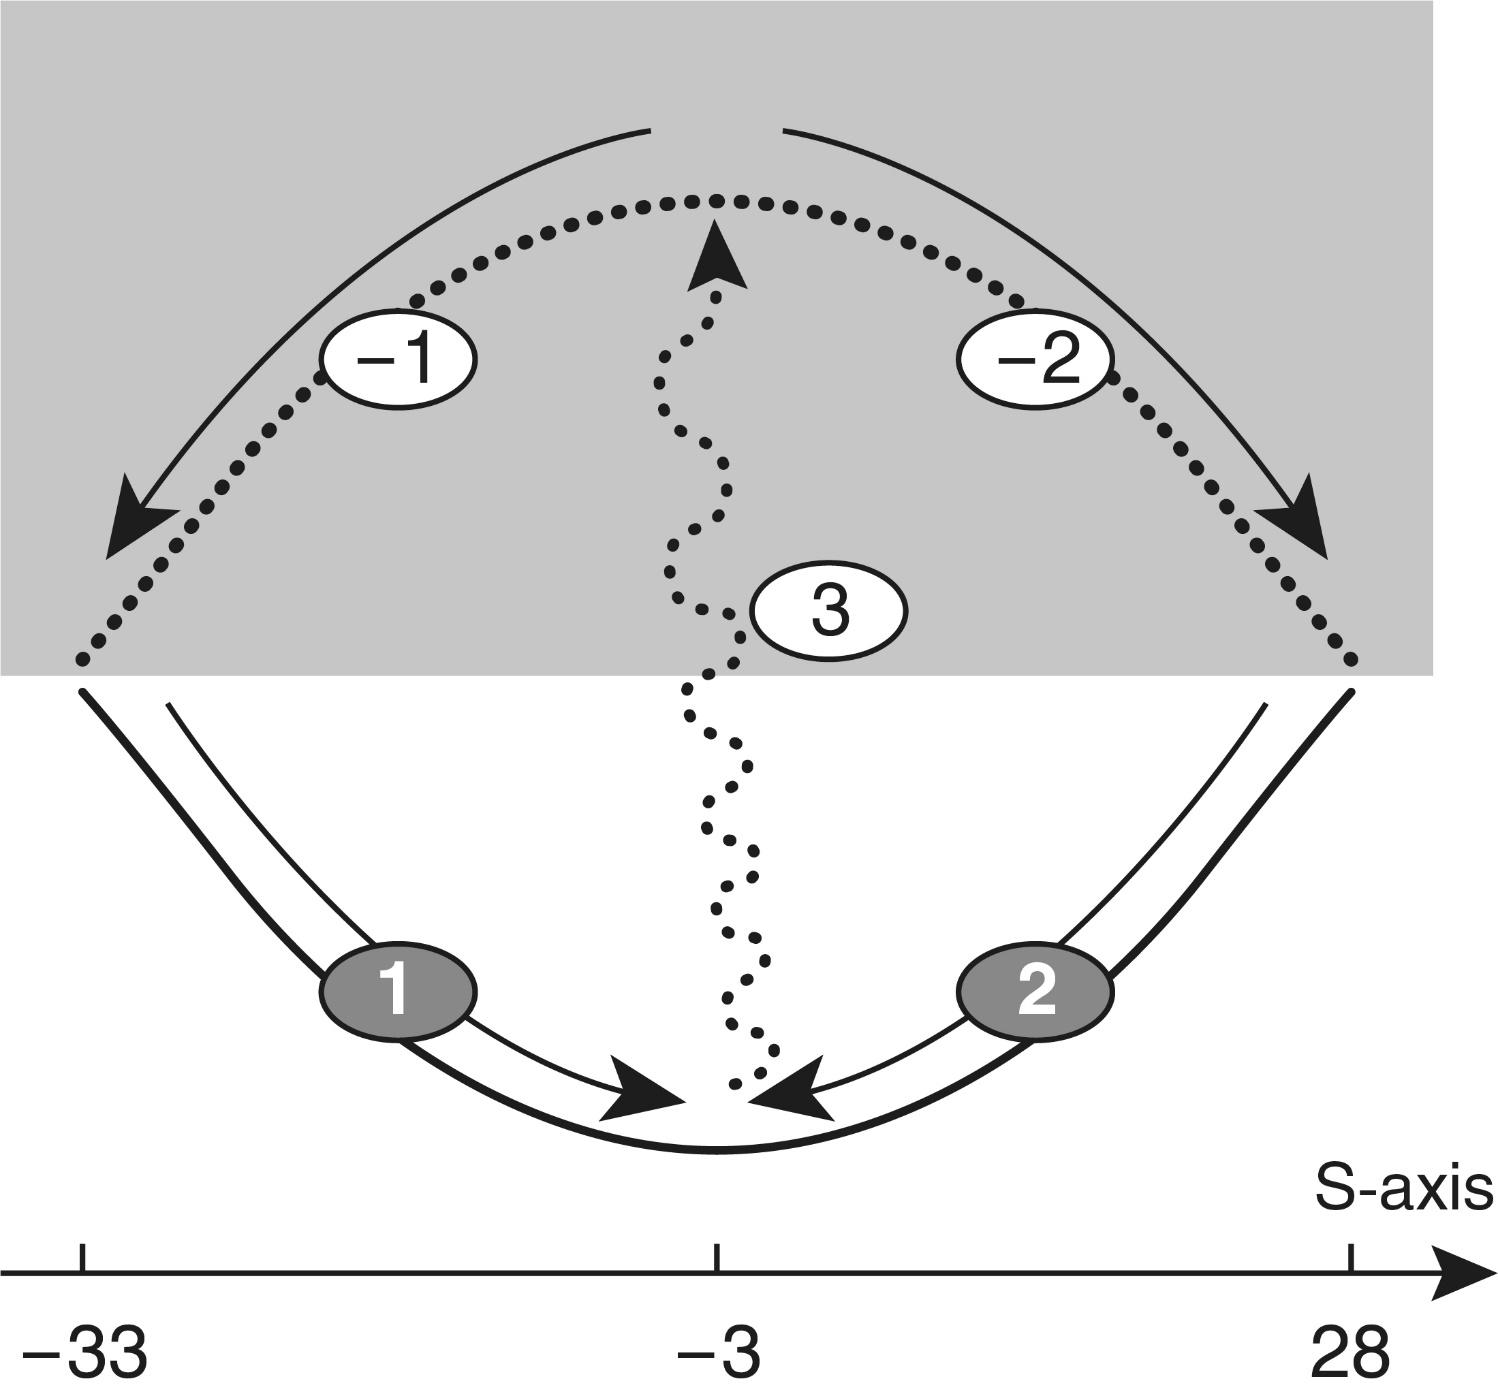
Fig. 2.36. Full thermodynamic cycle of the Universe on the S-diagram: 1 - expansion energy; 2 - compression energy; 3 - heat energy; (-1) - energy of matter collapse; (-2) - energy of space expansion
In essence, we obtain some LINEAR VARIATION of the vortex on the SCALE stability DIAGRAM (see Fig. 2.37). Up to now, classical science has considered all phenomena that are related only to the lower part of this vortex, so the above-mentioned global worldview contradictions arose.
So, according to the logic of the scale-phase diagram:
- EXPANSION OF ETHER SPACE TURNS TO COMPRESSION OF MATTER (GENERATION OF GRAVITATION),
- THE COLLAPSE OF SPACE TURNS TO THE EXPANSION OF THE MATERIAL STRUCTURE, THE FORMATION OF MATERIAL PARTICLES (WEAK FORCES).
Thus, we obtain a preliminary model of the Universal “perpetual motion machine”, in which energy continuously flows from one form to another (see Fig. 2.37). This logical scheme can be compared to a peculiar Möbius ribbon, where the world and the anti-world imperceptibly pass into each other, changing places in dynamic scale orientation, and where there is neither beginning nor end.
Thermal radiation acts as an energy “bridge” between the two worlds. This formulation of the question removes the problem of the heat death of the Universe, the problem of continuous entropy growth. Yes, entropy grows on one side of the Universal “Möbius ribbon”, but it is immediately transformed into the creative activity of four (or five) types of basic interactions of the material Universe on the other side of this Universal “ribbon”. We will consider in more detail how new information arises due to the expansion of the Universe and pulsations of maximon in the next chapter.
Let us now try to move cautiously from phase models to traditional physical models. For this purpose, at the first step, we only need to obtain a simple logically non-contradictory scheme.
All processes in the Universe release heat (process “3” is going on), which heats up the ether. Aether expands - the process “-2” is going on. Local heating of the Aether leads to thermal inhomogeneity in separate points of space, which begin to “boil”, which leads to the decompression of the Aether and the appearance of gravitational forces as a result - process “2”.
The connection between gravitation and aether densification is discussed in the author’s book “The Boiling Vacuum of the Universe,” Moscow: New Center, 2005.
In the decompressed regions of the Aether “openwork” constructions of maximon - from particles to galaxy clusters - are formed. Due to the absorption of heat by the Aether during collapse processes, these “bubbles” sooner or later collapse (process “-1”), for example, stars turn into black holes. The pressure in the ether and its temperature fall.
So, if in one place the ether expands and loosens, in another place it contracts and compacts. These processes are going on throughout the Universe in parallel in time, but opposite in scale direction. In the process of compression and densification, the matter is destroyed first to atoms (WHITE DWARF), then to nucleons (NEUTRON STAR), then to photons, and finally to maximon (BLACK HOLE).
Maximon, these first bricks of everything in the Universe, are freed from structural dependence (the same as with a building dismantled to bricks) and become independent, which turns their potential energy of connection in the structure of matter into kinetic energy of independent motion.
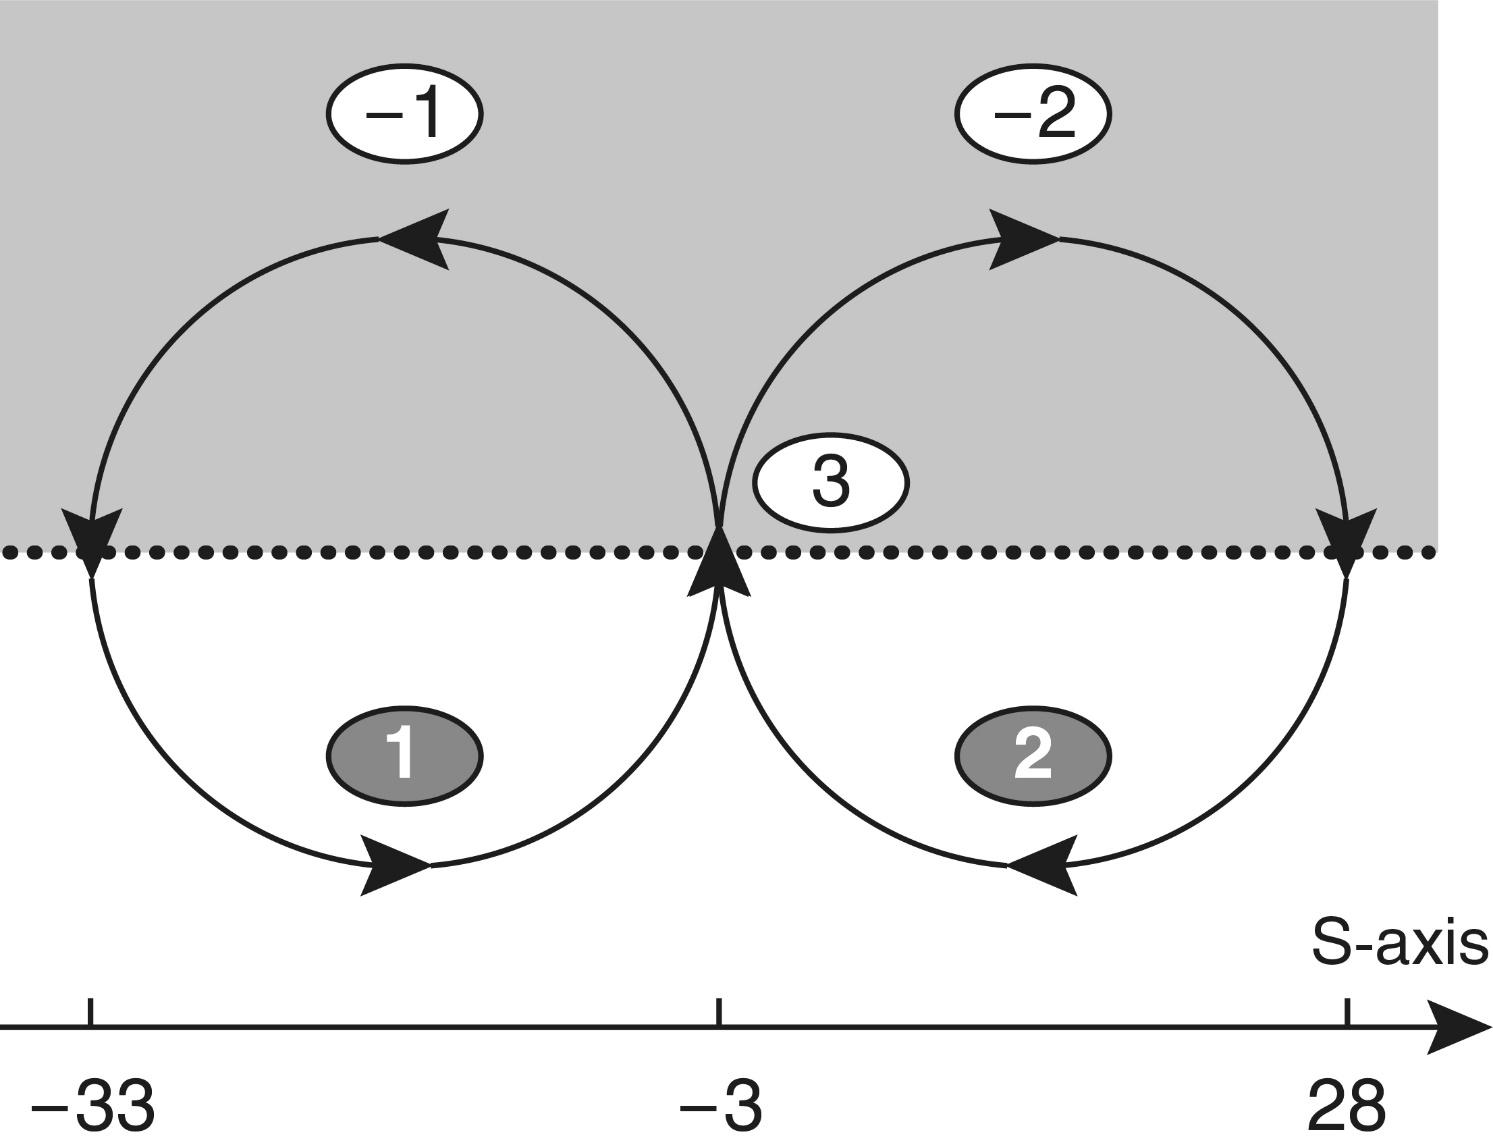
Fig. 2.37. Conditional torus diagram of the thermodynamic cycle of the Universe on the S-diagram. It can be seen that the closed thermodynamic cycle of the Universe can be represented as a scaled torus, whose different branches are perceived by us as different types of forces in the Universe
Free maximon can reassemble in the places of ether decompression into new systems: elementary particles, atoms, molecules, etc. The process “1” is going on. - there is a process “1”. Gravitation gathers cosmic bodies from the process “2” is going on. At the same time, excessive heat is released - process “3” is going on. And so on without end.
Above we started the consideration from the stage of heat generation. In an infinite Möbius ribbon it is absolutely indifferent from which point we start moving and where - to the left or to the right, the whole cycle will still be described. Let us show it by an example.
To begin with, the space of the Universe is expanding. As a result of this process, local tensile stresses appear in some points of etheric space. Etheric space begins to tear in these places, forming voids (disintegrated regions of the etheric medium). These voids, dislocations and inhomogeneities are of different scales: from the smallest bubbles (photons) to the global foam of the Metagalactic structure. In places of discontinuities, the kinetic energy is higher, and its excess part is absorbed by the ether in the form of thermal radiation, which, in turn, heats the etheric space and leads to discontinuities in its individual places. The Paris Academy of Sciences should give its prize for the invention of the perpetual motion machine to the Lord God.
Of course, the proposed scheme is still only a logical HYPOTHESIS, which needs detailed elaboration and therefore does not pretend to formally calculate specific physical phenomena. But even in such a simplified and rudimentary form, it allows us to find new aspects of thermodynamic processes in the Universe, which allows us to look at well-known facts in a completely different way.
Example one. Consider the stars. The lion’s share of thermal energy comes from stars. It is in the nuclei of stars that the process of thermonuclear synthesis of atomic nuclei takes place. The nuclei of atoms are scales on the order of \(10^{-13}\) cm, and the nuclei of stars are scales on the order of \(10^7\) cm. Both points are located symmetrically (!) with respect to the ICV: to the left and to the right by 10 orders of magnitude (see Fig. 2.35). Thus, the lion’s share of heat enters the etheric medium due to the scale-symmetric process, which takes place simultaneously at the junctions of electromagnetic forces with weak and gravitational forces. It is unlikely that this symmetry is an accident. Probably, this symmetry is obligatory for any process of heat generation.
To check this, a more thorough investigation of the scale symmetry of thermodynamic processes is necessary. Here we will not delve into this interesting but complicated area. Let us consider only two more examples of thermodynamic scale symmetry.
Example two. Man (\(10^2\) cm) is the only creature in the Biosphere that receives heat (in addition to solar heat) due to the artificially supported combustion process - chemical oxidation of atoms (\(10^{-8}\) cm). Isn’t it remarkable that here too we see a scale-symmetric process (see Fig. 2.35), but with a coefficient of \(10^5\)?
Example three. Relatively recently it was discovered that quasars and nuclei of Seyfert galaxies (\(10^{17}\) cm) emit most of their energy in the infrared region of the spectrum. Based on the principle of scale symmetry (see Fig. 2.35), we can put forward the PROPOSITION that in galaxy nuclei (and in quasars) the source of energy is not thermonuclear processes (\(10^{-13}\) cm), but symmetrically located on the S-axis relative to the SCU processes occurring at a deeper level of matter (\(10^{-23}\) cm, presumably - electron nuclei). Naturally, energy at these levels is many orders of magnitude more efficient than at the level of the thermonuclear process. Maybe this explains the huge amount of released energy in quasars and exploding galaxies like M82 (or the Swan-A radio galaxy, see Fig. 2.21), where, according to the most cautious estimates, up to \(10^{64}\) erg of heat is released. Astrophysicists’ calculations show that even an improbable simultaneous transition to helium of the substance of the entire galaxy, consisting entirely of hydrogen, would yield only \(10^{63}\) erg 2. Since even such a completely improbable process cannot provide the energy of the observed explosion, it is legitimate to move from the nuclear shelf scale to a deeper one where much more energy can be released for the same mass.
Thus, if the discovered scale symmetry of thermodynamic processes knows no exceptions, then there arises a fascinating task of rethinking all known and supposed processes in the Universe, going with heat generation. The question arises: whether the scale symmetry is preserved for other processes?
At the same time, the uniqueness of the location of the SCU on the S-axis is once again confirmed, because, for systems with SCU dimensions, heat can be released only under the influence of the holistic motion of the object itself. The extreme arms of thermodynamic scale branches here are pulled down almost to a point (see Fig. 2.35).
All cells, as we remember, are located in the MCV. This leads to a fantastic PROPOSAL: the source of the cell’s motion (pulsations) is on the scale of the range of the MCV. Maybe the cell gets its energy directly from the ether? Maybe part of its energy is the so-called relic radiation?
Comparing the energy of a cell with the energy of a star, based on schemes 2.35 and 2.38, we can note a significant difference. The core of a star as an integral object of mega-size (\(10^7\) cm) is supported by processes going on at the level of microscale (\(10^{-13}\) cm). The cell as a macroscale object (~ \(10^{-3}\) cm), according to the logic of the proposed schemes, should be supported by the processes going on the same scales (~ \(10^{-3}\) cm).
Hence, the CELL is the only dynamic object that is ENERGETICALLY MASSIVELY SELF-SAFE. What thermodynamic mysteries of the living cell are behind this conclusion? If we develop further the model of scale-torus vortices (see Fig. 2.37), a simple extrapolation allows us, taking into account the above, to construct a generalized model of S-parameter torus vortices (see Fig. 2.38). Among them, the most obvious are those associated with the lower points of the **S - Wave of stability, ** for it is there that matter is in the most stable state, so it is there that the potential energy density is greatest, so it is there that nature extracts the greatest amount of kinetic energy, which is eventually transformed into thermal energy.
CONCLUSIONS.
Thus, we are convinced by many examples that the dynamics of the motion of the Universe objects along the S-axis has its special specificity, which is revealed and partially investigated in this paper. The large-scale dynamics of processes have a number of important regularities.
First, very many fundamentally important displacements of systems along the S-axis occur scale-symmetrically.
Second, it was found that all slopes of the S - Wave of stability have their own “preference sign” in the dominance of synthesis or division processes. The boundaries between these zones on the S-axis are the upper and lower points of the SWS. Thus, it was possible to introduce the notion of a CONDITIONAL SPACE “SCALE-stability”, in which the movements of all systems are subordinated to some general regularities, which significantly expands the possibilities of applying the principles of scale similarity.
Thirdly, it turned out that the whole S-band of the Universe is a complete and very logically understandable phase diagram, in which each of the forces of interactions known to physics is just a facet of one of the transitions of the general process of matter movement along the S-axis.
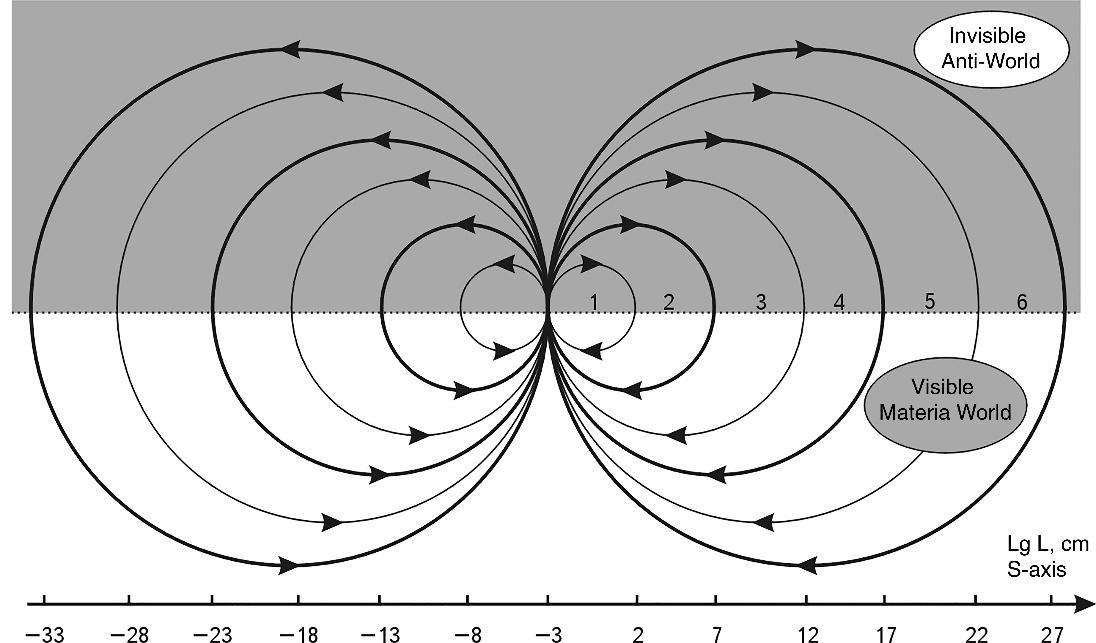
Fig. 2.38. Phase S-diagram of the formation of scale-symmetric heat flows in the Universe:
1. man (\(10^2\) cm) burning fuel releases energy from the atomic level (\(10^{-8}\) cm);
2. in the depths of stars, in their nuclei (\(10^7\) cm) the process of nuclear synthesis (\(10^{-13}\) cm) takes place, as a result of which thermal energy is released;
3. it can be assumed that in active nuclei of galaxies (\(10^{17}\) cm), such as the galaxy M82, there is energy release at the scale level of the assumed electron nuclei (\(10^{-23}\) cm);
4. all closes the Large Thermodynamic Cycle of the Universe (\(10^{28}\) cm), in which the binding energy of maximon (\(10^{-33}\) cm) is extracted.
P. S. Cycles 3 and 5 are not considered
Fourthly, the analysis of the regularities of the behavior of matter on the phase DIAGRAM SCALE-stability allowed us to make a very original PROPOSITION about the existence of a mirror world, the processes which are carried out mainly through the maximon medium (ether). Based on this assumption, it was possible to construct a logically consistent qualitative thermodynamic diagram for the Universe.
All of the above indicates that not only the static arrangement of the main classes and structurally symmetric properties of systems on the S-axis is subject to a strict order, but also the dynamics of the movement of systems along the S-axis have a quite logical regularity, which has signs of symmetry, cyclicity, closedness, and many other properties. This suggests that the S-axis is not just a formal parameter reflecting quantitative characteristics of systems (number of elements in the system, occupied space, etc.).
The S-DIMENSION OF THE UNIVERSE has so many symmetry properties of its own and so many laws of its own that it remains to PROPOSE that it is the FOURTH SPATIAL DIMENSION OF OUR WORLD, which has its own laws of symmetry, its own order, and its own laws of dynamics. In other words, movement along the S-axis has a qualitative physical basis.
From this, it is possible to draw a fundamentally new CONCLUSION, that THERE IS A PREVIOUSLY UNKNOWN LARGE-SCALE FORCE (S-Force) ACTING ALONG THE S-AXIS, WHICH HAS YET TO BE EXPLORED BY SCIENCE, and that there is a S- INTERACTION, which, in fact, is unifying for all previously known interactions.
Moreover, it is not even a fifth force, which is currently being searched for by many researchers all over the world. We are talking about a certain UNIFIED FIELD OF THE UNIVERSE, the facets of which we study as those or other types of interactions, which are nothing more than LOCAL SCALED SLICES OF THE GENERAL SCALED FIELD. Thus, gravity is a mega-slice of the scale field, electromagnetic forces are a macro-slice, etc.
The PROPOSAL of the existence of scale interaction, scale force, and scale field is obtained on the basis of the generalization of a large amount of factual material. Therefore, it becomes necessary to consider the prerequisites for the construction of THE UNITED THEORY OF SCALE INTERACTION.
-
Astafiev B. A. Theory of the Unified Living Universe (Laws, Hypotheses). Moscow: Informatsiologiya, 1997. P. 20. ↩
-
Bronshtein V. A. Hypotheses about Stars and the Universe. Moscow: Nauka, 1974. ↩
The S-harmony of the universe
All the years that were devoted to the study of the regularity of the scale symmetry of the Universe, the author did not give rest to the question: what force is responsible for such a unique phenomenon? After all, it is clear that none of the types of interaction known to science, can not be responsible for this order in the Universe. By giving this force the name S-Force, and the interaction the name S-Interaction, I only indicated to myself the necessity of searching for a new fundamental process.
At the same time, the question of the mechanism of formation of two S - Wave of stability along the S-axis remained unclear. Gradually, almost at the intuitive level of realization, I came to the conclusion that these two waves have completely different mechanisms of formation.
It was shown above that there are two forces constantly acting in the Universe, which leads to the appearance of scale symmetry. One of them is conservative, basic, generating the dimensionless coefficient \(10^5\). The other is the evolutionary force, which is related to the scale boundaries of the Metagalaxy and generates the dimensionless coefficient, the value of which changes continuously during the expansion of the Metagalaxy.
Figuratively speaking, the first tendency operates from the depths of matter, it tunes all hierarchical floors of the Universe to the scale factor \(10^5\) like a tuning for a tuning chamber, and it can in no way be related to the dimensional parameters of objects, because its invariability is manifested as a systemic regularity for all objects, all hierarchical levels, at all times of life of the Universe. Another thing is the second tendency. It is manifested through the integer division of the Universe floors depending on its changing scale length. The closeness of the S - Evolutionary Coefficient of Symmetry (SECS) to the S - Basic Coefficient of Symmetry (SBCS) should not mislead us. We are talking about two different universal phenomena.
Strange as it may seem, the author first of all succeeded in finding a theoretical approach1 to the changing, evolutionary force. At the same time, the author is well aware that all subsequent theoretical considerations given in this chapter are nothing more than an attempt to find ways to the future theoretical substantiation of the phenomenon of the scale symmetry of the Universe.
-
Sukhonos S. I. On the Causes of the Emergence of Preferred Sizes of Natural Bodies in Nature. Dep. VINITI from 27.01.1988. № 733–V88. ↩
Standing S-waves of the Universe
Returning to the obtained results, we must recognize that the location on the S-axis of the most representative objects of nature often has such a high accuracy that one suspects that this accuracy is absolute. From our point of view, one of the mechanisms that could give rise to this accuracy of the S-interval partitioning of the Universe is harmonic oscillations in four-dimensional space that give rise to knots - three-dimensional stable systems. Let us consider this preliminary HYPOTHESIS in more detail. As it is known, STANDING WAVES are formed in such a way that their length is always an integer number of times within the total length of the excited medium. In this case, we are talking about the scale length, and we take the scale axis as the fourth spatial dimension, as we have already mentioned. However, the multidimensional mechanism of the model is very difficult to understand without first involving analogies from the one-, two-, and three-dimensional worlds familiar to us. Therefore, let us begin with the simplest, one-dimensional example.
Take a string clamped on both sides and create excitation on it (Fig. 2.39). The string is a linear system, the excitation occurs in a plane, and the standing wave node is a point object. Let us abstract from the real thickness of physical systems and consider their dimensionality further in accordance with the dominant extension.
In this case, it can be written that:
\[N_y = N_c - 1 = 1 - 1 = 0\]
\[N_d = N_c + 1 = 1 + 1 = 2\]
where \(N_c\) is the dimensionality of the system, \(N_y\) is the dimensionality of the standing wave node and \(N_d\) is the dimensionality of the motion space.
So:
\[N_y = N_c - 1, N_d = N_c + 1 \tag{2.1}\]
Suppose now that this condition is satisfied for any values of \(N_c\).
From the one-dimensional medium of the string, let us pass to a two-dimensional (\(N_c = 2\)) medium, for example, a round flat membrane - a drum membrane (Fig. 2.40). Pouring sand on it and hitting it in the center, we will find that after some time all the sand has gathered into linear ring structures (\(N_y = 1\)), which as if mark those places on the membrane where no motion occurs, i.e. represent to us linear “nodes” of standing waves on the plane.
Thus, it is easy to see that the relation (2.1) holds for \(N_c = 2\), since the standing wave nodes on the plane are circular linear formations, and the excitation propagates perpendicular to the plane - in a three-dimensional medium.
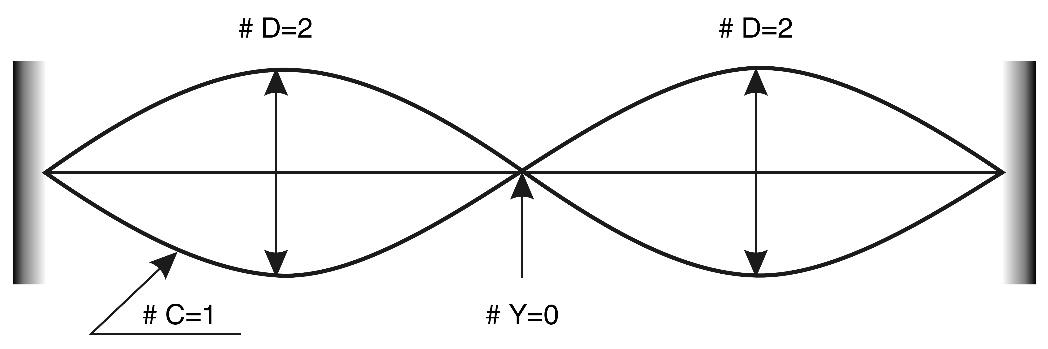
Fig. 2.39. Oscillations of a stretched string (1st overtone). \(N_d = 2\), \(N_c = 1\), \(N_u = 0\)
Let us pass from a two-dimensional medium to a three-dimensional medium (\(N_c = 3\)). Following only formal logic, we will have the dimensionality of nodes equal to two (flat partitions of volume cells), but the excitation will take place in a four-dimensional medium (\(N_d = 3 + 1 = 4\)). What is four-dimensional excitation?
The author’s earlier work1 analyzed the well-known idea that the fourth spatial dimension is orthogonal to three-dimensional space.
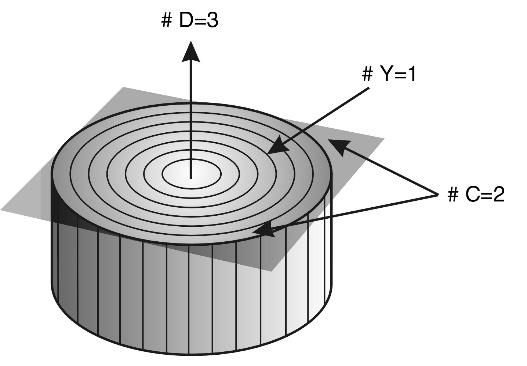
Fig. 2.40. Poured sand forms rings when the drum membrane oscillates
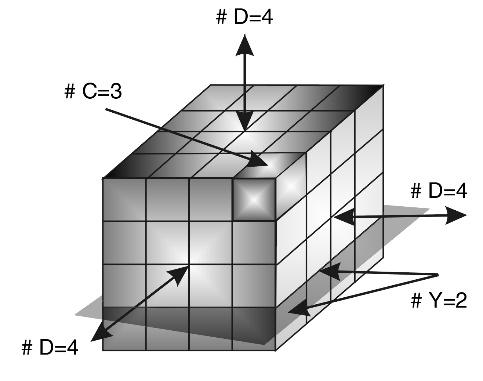
Fig. 2.41. Cells with fixed partitions appear inside the cube during oscillations
In a special case, we can consider that the forced pulsations of the three-dimensional volume (Fig. 2.41), its periodic contraction-expansion should lead to three-dimensional standing waves, whose nodes are cell partitions. With these reservations, we can assume that condition (2.1) remains valid for a medium dimension equal to three.
FREE REASONING
We will omit a rather long system of proofs that the scale dimension may well claim to be the fourth geometric space. This will be done in the next book by the author2.
The topic of additional dimensions of our space has been discussed in the literature since the last century, although it has an even older history. In particular, in the review paper by Y. S. Vladimirov3 it is shown that modern physics does not leave attempts to identify which parameter can claim to be the fourth dimension (in Y. S. Vladimirov’s book it is called the fifth dimension).
From our point of view, the world is multidimensional, but human civilization comprehends this multidimensionality step by step4 reflecting the surrounding world in models, the dimensionality of which space is always equal to N + 1, where N is the current dimensionality of the world models of this or that civilization, and 1 is an additional dimension - time.
At present, since the Renaissance, the 3+1 model has been established in scientific thinking, but we are sure that time is not a single parameter of our world, but a set of not cognized, not yet revealed dimensions, so it would be more correct to write that at present the scientific paradigm is based on the model of the world with dimensionality 3+X, where X is the multiplicity of dimensions perceived by us as time. The author’s research has shown5 that after 2000, mankind should make the next step in comprehension of the multidimensionality of our world, and then after some time, we will get the model of the world with dimensionality 4+X. In the transition period, the model should be 3+1+X, where the additional dimension to the three already revealed ones is an S-dimension. Let’s see whether the formally constructed model (see Fig. 2.41) has any experimental confirmation? Let us set up a mental experiment in which a cubic volume of liquid saturated with light particles (suspended matter) is subjected to compression. Are volume cells with two-dimensional partitions formed inside such a liquid?
To verify this assumption, thank God, there is no need for special research. All the experiments we need have already been set up long ago and many times. For example, a cooling liquid metal alloy is the very model we described above. After all, if there are various impurities in the liquid medium of the base metal, then as it cools, the volume of the casting will be compressed on all sides, providing the compression we need orthogonal to three-dimensional space. And what is it? Yes, what is well known to all metal scientists - any alloy in the process of solidification is filled with so-called grains, two-dimensional boundaries between which are formed by suspended matter (additives, pores, etc.). These boundaries are two-dimensional nodes of four-dimensional oscillations of a three-dimensional medium (see condition (2.1) on pg. 356).
Following further formal logic, let us increase the dimensionality of the medium by one more unit (\(N_c = 4\)). If in such a four-dimensional medium a motion orthogonal to it is created (\(N_d = N_c + 1 = 4+1=5\)), then nodes will be formed in it, whose dimensionality will be equal to three (\(N_y = N_c - 1 = 4 - 1 = 3\)). What are these nodes? Formally speaking, they are three-dimensional bodies whose stability is conditioned only by the fact that they are nodes of five-dimensional oscillations in a four-dimensional medium. It is not difficult to guess that three-dimensional knots are our stable world of objects of the Universe! Protons, atoms, cells, planets, stars, and even man himself are all complex superpositions of vibrations of four-dimensional space.
The duration of existence of all systems of the Universe, and stability to external influences, therefore, is connected with the power of a node, i.e. with the energy of oscillations generating it. The description of the whole variety of life in the Universe can be realized with the help of the theory of waves and oscillations, but in a medium of higher dimensionality than the traditional physics has used so far. So, we have put forward a very important HYPOTHESIS. The whole world of stable objects of the Universe surrounding us are nodes of standing waves of complex harmonic oscillation in a four-dimensional medium.
The construction of a wave picture of the Universe with a high degree of theoretical accuracy is a matter of the future since this task is grandiose. Here we will take the very first steps along this path. For this purpose, let us simplify the conditions by reducing the whole consideration to the projection of four-dimensional space on a one-dimensional axis. This projection is precisely the S-axis, each point of which is a three-dimensional world of the chosen scale. For example, point (-8) is the universe of atoms, point (+12) is the world of stars, etc. F The projection of the five-dimensional motion in this model will be perpendicular to the S-axis, hence it will occur in the plane of the figure. Nodes of standing waves are points on the S-axis, which are coordinates of particularly stable dimensions of three-dimensional objects of the Universe.
We have already mentioned that in the Universe all matter is mainly concentrated in atoms (their nuclei) and stars (their nuclei). Consequently, it is well-known which zones of the scale hierarchy of the Universe are populated by the most abundant and long-lived systems. Let us see whether these zones of increased stability on the S-axis, which we described in Chapter 2.1, correspond to the points that can be obtained using the model of standing five-dimensional waves in a four-dimensional medium.
Let us consider the entire S-interval of the Universe, rounding all values of its left and right edges to integers and assuming the size of the Metagalaxy to be \(10^{27}\) cm, which corresponds to its age of 1 billion years. These temporal assumptions will allow us to show more convexly the fundamental aspects of a simplified version of the model. The first main tone, which is excited from five-dimensional space (Fig. 2.42), sets the edge points of the S-interval: the left node (-33) is the maximon and the right node (+27) is the Metagalaxy.
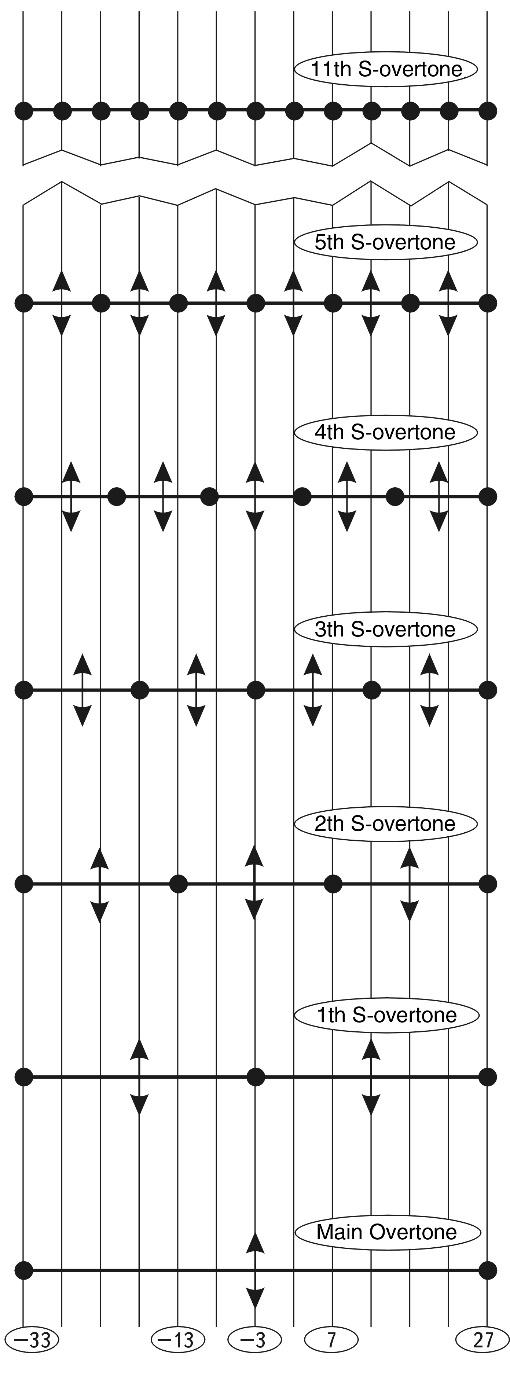
Fig. 2.42. Harmonic oscillations on the S-axis (simplified model)
The main tone beam has a coordinate (-3), which corresponds to 10 microns. In accordance with the accepted logic, the maximon and the Metagalaxy itself are the nodes of the STABLE WAVE OF THE MAIN TONE, so they are the most stable systems of the Universe, possessing the ultimate for it stability to external perturbations and the maximum duration of life. We can say that as long as the Universe exists, maximon exists in it. And vice versa, the maximon environment sets us as the initial substrate of the Universe.
The center of the scale interval is a size of about 10 μm at which the oscillations of the four-dimensional medium reach their maximum. Accordingly, it is dynamically the most pronounced scale in the Universe for a given rank of oscillations.
What physical interpretation can be given to the obtained slice of the Universe - the Universe of the basic tone?
Very simple - it is a physical vacuum (or ether), in which there is not a single material object and which is filled with vibrations, the maximum density of their energy is reached in the range of wavelengths from 10 to 100 microns (recall that in the refined model the scale center is shifted to the right and by virtue of the bimodality of SW occupies some range).
In fact (see Fig. 2.42), according to the accepted logic, only Nodules have a stable state in this environment. There are only two of them: MAXIMONS (-33) and METAGALACTICS (+27).
So that atoms, stars, etc. can appear in this medium, it requires the appearance of knots inside the S-Interval, on the sizes of atoms, stars, etc. But they do not yet exist in the main tone of the Universe.
Thus our model ether does not simply consist of maximon, they pulsate (oscillate along the S-axis) and generate in their medium the whole spectrum of wavelengths from \(10^{-33}\) cm to \(10^{27}\) cm (excluding extreme values), i.e. it is filled with its own energy, which is generated not by stars or matter, but by the medium of maximon (in traditional physics - field).
What phenomenon in the Universe could correspond to these oscillations? Obviously, the so-called RELICT radiation, but is it a relic in this case? Here we again return to the idea that the process of formation of matter from vacuum did not end in the first moments after the Big Bang, and the interaction of matter with the physical vacuum is still going on.
Does the conclusion about the constant activity of the ether due to the excited main tone of large-scale oscillations give us any prediction possibilities? Yes, the maximum activity of this radiation should fall, according to the refined model, on a wavelength close to 50 microns. What is the real picture? According to the accepted cosmological model, the spectrum of relic radiation should correspond to the spectrum of blackbody radiation, which is described by the Planck curve. The maximum in this case falls at 1.5 mm or \(10^{-0.9}\) cm. In our refined model, the maximum (the main tone beam) falls at a wavelength in the neighborhood of 50 μm, or \(10^{-2.3}\) cm. Thus, the model maximum is 1.4 orders of magnitude to the left of the conventional maximum. For a first approximation model, getting an error of one and a half orders of magnitude at 60 orders of magnitude is not a bad result. Thus, we have considered the basic M-ton with its nodes and bundles. In further consideration, we will simplify the problem and consider only the nodes of standing M-waves. Let us return to the simplified model.
The first overtone sets us a node (-3) in the SCU in the scale center of the Universe, which has a size of about 10 µm (see Fig. 2.42). We can assume that the first M-overtone of the Universe creates some massless superstable mysterious systems in a vacuum, which are completely unknown to science. If maximons are deduced at least theoretically, these unknown grains without flesh, grains of “spirit of world space” were not deduced earlier even theoretically, let alone to find them experimentally. Further, we will come back to these new “objects”.
The second overtone gives us two additional stability points on the S-axis: (-13) and (+7). Let us see what this slice of the Universe represents. The left point is the size of nucleons, the right point is the size of neutron stars (or in a more general sense, the nuclei of stars).
So, at the second overtone, we have obtained the main basic material composition of the Universe: these are the nuclei of stars consisting of nucleons.
The fact that such systems are the final stage of development of many kinds of stars is a well-known fact. The fact that the matter of the Universe is more than 99% concentrated in these systems is now also a well-known fact. But we note additionally that the lifetime of nucleons (\(10^{56}\) years) and the nuclei of stars is the longest among all known material systems of the Universe.
In addition, the second overtone also sets us with fantastic accuracy the above-discussed division of the S-interval into three sections of dominant types of interactions.
Consequently, it can be stated that the whole variety of interaction types is conditioned by the influence of the second M-overtone on the primary four-dimensional medium of the Universe.
The third overtone gives us two more new points: (-18) and (+12). The left point, according to our assumptions, is the size of the electron. The right one, as already noted, is the average size of stars.
The fourth overtone sets four new points on the S-axis: (-21), (-9), (+3), (+15). The author has no physical interpretation of these nodes, so we leave them without comments.
The fifth overtone has a dedicated position in this hierarchy because it sets points on the S-axis that correspond exactly to the points of the main tone and the first two major overtones. Thus, its sustained M-zones include the sustained M-zones of the first three harmonics. To them, the fifth overtone adds only two stable points of its own on the S-axis: (-23) and (+17).
We see now that half of the series of stable objects of the Universe, which we obtained as a result of the previous empirical generalization, is determined by the fifth S-Overtone of the Universe (see Fig. 2.42), since all nuclear objects exactly correspond to the nodes of this overtone, forming the nuclear stability series:
-33 - Maximons;
-23 - electron nuclei (?);
-13 - atomic nuclei, proton;
-3 - cell nucleus;
+7 - the cores of stars;
+17 - galactic nuclei;
+27+1 - Metagalactic.
In this series, the most stable objects of the Universe alternate in 10 orders of magnitude. If the intervals between them are divided strictly in half, a structural series is formed, shifted relative to the nuclear one by 5 orders to the right, the objects of which also alternate in 10 orders, the so-called structural series of stability:
-28 - photons (?);
-18 - electrons (?);
-8 - atoms;
+2 - human;
+12 - stars;
+22 - galaxies.
Note that the objects of the structural series appeared on those places of the S-axis, which in the fifth M-overtone correspond to its bunches. The bundles, according to the logic adopted here, are zones of increased energy but decreased stability.
For stars and atoms, such a contradiction is alarming. A way out can be found if we consider the 11th S-Overtone (see Fig. 2.42), in which half of the nodes correspond exactly to the nodes of the 5th S-Overtone, and the other half of the intermediate nodes are defined mainly by the 11th M-overtone.
Hence the CONCLUSION that exactly 12 harmonics (the main tone and 11 overtones) are sufficient to obtain a model that gives an exact correspondence to the phenomenologically constructed series of the main objects of the Universe (see Fig. 1.7). However, the question arises, what about the nodes of the 4th, 6th, 7th, 8th, 9th and 10th overtones?
To answer this question, it is enough to plot the total stability curve of the 12 first S-harmonics (see Fig. 2.43). We see that it clearly shows some periodicity through 5 orders of magnitude, which indicates that the nodes of these 12 harmonics are mainly concentrated around 13 points on the S-axis. THESE ARE THE POINTS WHERE THE SIZES OF THE MAIN CLASSES OF SYSTEMS OF THE UNIVERSE ARE LOCATED.
The other harmonics give only a secondary fractal ripple on the stability curve. Hence it follows CONCLUSION that, since for the majority of S-Harmonics the nodes appear in the same row, which is a multiple of 5 orders, a MASTER-HARMONIC RESONANCE is realized in Nature.
Thus, we see that our model gives a sufficiently complete correspondence of the nodes of scale harmonics to the position on the S-axis of the main classes of systems of the Universe. It is simply unrealistic to wish for more correspondence at the first stage of building the theory of scale-harmonic oscillations.
WHAT DOES THAT MEAN?
Firstly, the Universe has as it were many S-frequency slices (layers), each of which defines its own HIERARCHICAL RANGE OF SUSTAINABLE SYSTEMS. The first slice is the etheric Universe, the second slice is the informational Universe, and the third slice is the material Universe of basic systems. The twelfth slice (the 11th overtone) sets us the structure of the Universe in its usual material incarnation: photons, electrons, atoms… stars, galaxies, and their nuclei. Although the twelfth slice already has stability points for such systems as cells and animals, it still needs intermediate stability zones where macromolecules, pre-cellular structures, and other subsystems of complex hierarchical systems could be formed.
As the author’s earlier study6 has shown, protein living systems are distinguished by the fact that their scale-hierarchical organization is extremely densely packed. For the scale axis, this is achieved when each system of a higher hierarchical level is on average 3.16 times larger than the size of its elements. On the S-axis, points with such a step form a periodicity with an interval of 0.5 orders of magnitude.
Since the universal S-interval contains 60 orders (in the simplified model), its corresponding partitioning can be given only by the 120th harmonic. From this, it is possible to conclude that the possibility of the existence of protein life is supported by the S-overtone not lower than the 120th order. However, in this case, the S-structure of life should penetrate all scale levels, including the microcosm and cosmos.
An alternative variant of the empirically revealed S-periodicity with a step of 0.5 orders is the mechanism of localization of S-harmonics. For example, if we “cut out” from the S-interval of the Universe 15 orders, which are occupied by protein life (from viruses to biosphere), then within this scale range of protein life the S-axis partitioning with a step of 0.5 orders is obtained already at the 30th harmonic (15 : 0.5 = 30).
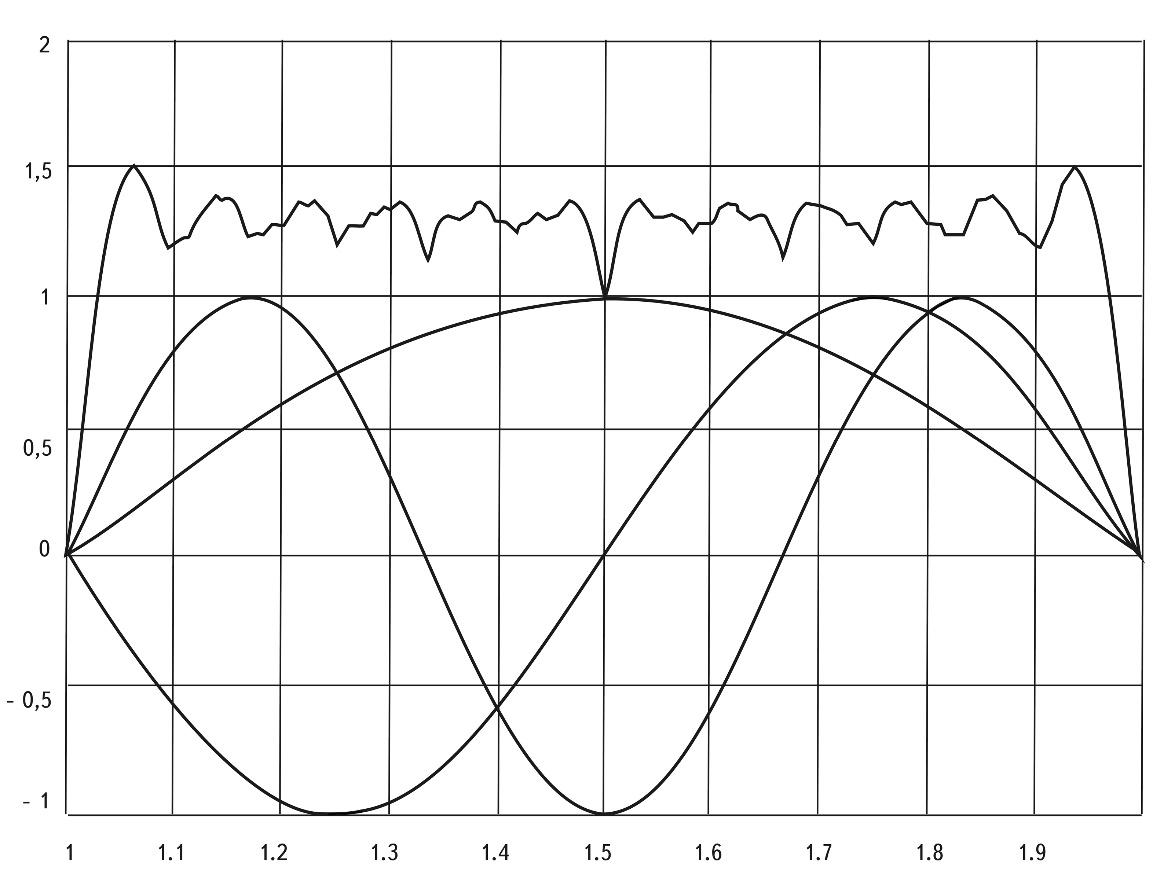
Fig. 2.43. Graph of the sum of standing waves of the first 12 harmonics (simplified model)
For convenience in plotting the graph, let us take the interval from 1 to 2. Then we can write that \(X \in [1; 2]\), where X is simply a number.
\(\lg L \in [-33;+27]\) is the S-interval.
\(\lg L = -33 + 60 (X - 1)\) is a scale for converting X to L.
Then the point X = 1 on the graph corresponds to \(\lg L = -33\), i.e. the size of the maximon. The point X = 2 corresponds to \(\lg L = +27\), i.e., the size of the Metagalaxy, and the point X = 1.5 corresponds to \(\lg L = -3\), i.e., the point of the SCU, etc.
To consider our theoretical model of the stability of the objects of the Universe, we plot the graphs of musical harmonics, where n is the ordinal number of the harmonic. \(y = \sin (n \pi X)\) is the graph of the function of the harmonic with the ordinal number n.
$$ Y = \frac{2}{N} \sum_{}^N \left| \sin (n \pi X) \right| \tag{2.2} $$
the sum of the functions of N harmonics, where 2/N is a coefficient equalizing the energy of all harmonics to a total of 1.
Below are the graphs of the first three harmonics, while the upper curve represents the result of summing the modulus of the amplitudes of standing waves for the first 12 harmonics (N=12) according to equation (2.2).
This curve provides insight into the potential stability/instability of objects, or, in other words, it represents the function of the energetic instability of objects as a function of the logarithm (\(\lg L\)) of their sizes.
The lower the value of Y, the more stable the object corresponding to X (where the size of the object is calculated using the formula: \(\lg L = -33 + 60(X - 1)\)).
It can be observed that the most stable objects, excluding maximons and the Metagalaxy itself, are those whose sizes fall within the MCV.
If we convert the X-values of all “troughs” (1<Y<1.5) into logarithmic size values, it turns out that the entire sequence of known cosmic objects falls into these “troughs”.
The author expresses gratitude to A. G. Ivanov for assistance in the mathematical formalization of the idea.
In any case, we see that to explain all regularities of the hierarchical structure of protein bodies it is necessary to complicate the model of S-harmonics to much higher overtone levels. Therefore, we will leave this problem for further work. Second, since the number of S-Overtones can be potentially infinite, no point on the S-axis has zero stability. Another issue is that the power of each subsequent overtone decreases, hence the degree of stability due to its nodes also decreases. Therefore, the picture of the general stability of the objects of the Universe depending on their sizes will most likely have a FRACTAL VIEW.
Hence - DUALISM OF STRUCTURE OF SPACE. On the one hand, it is quantized, and quantization should be especially pronounced near the main nodes of the S-axis, and on the other hand, it is continuous since the higher overtones create a continuous series of stability.
Some parts of the S-axis will be predominantly quantized (around the main knots), and others - predominantly continuum (scale levels maximally removed from the main knots).
This explains, from our point of view, the fact that microphysics is successfully described by quantum theory, and macrophysics does not need it.
One can only PROPOSE that also for the physics of stellar nuclei (because of the power of the node of the 2nd overtone - (+7)) quantum effects are essential, which at present are simply not detected yet.
In general, it is not difficult to obtain a mathematical expression for the integral stability of the objects of the Universe based on the addition of the harmonics of the Fourier series (see Fig. 2.43). Undoubtedly, the obtained dependence is of a qualitative and principled nature; in the future, it requires further clarification and concretization.
Let us return to the PROPOSITION that the Universe consists of four-dimensional layers nested into each other, each of which has its own frequency characteristic.
So, for example, the main tone sets the Universe of ether, the second overtone sets the Universe of star nuclei… the 11th overtone sets the Universe of stars and galaxies… the 120th overtone sets the physical matrix of a human being. The question arises: how and through what do these layers interact with each other? The most common for all layers is the layer of ether, i.e. the maximon medium through which gravitational and, apparently, all other influences are transmitted. In general, the problem of the interaction of different overtones is a very complicated and extremely interesting question.
Another question: can objects of one layer move to other layers? If, for example, stars belong to the 12th layer (11th overtone), can they move above or below?
It is known that stars die after exhausting their internal energy source. In particular, for stars with masses greater than two but less than ten solar masses, astrophysicists have calculated such a scenario: the star explodes, forming a supernova, in which the shell explodes in space, and the core is compressed to a superdense state. At the same time, the structure of all atoms in the core is destroyed, their electron shells are crumpled, and only bare nucleons remain.
The resulting structure is a neutron star, which is a giant nucleus. The NS has dimensions of about \(10^7\) cm, and its elements are \(10^{-13}\) cm. Such a structure belongs to the second overtone (see Fig. 2.42), and since the original structure (a living star) at least belonged to the third overtone, the death of the star is its transition from higher harmonic levels to lower ones. This conclusion returns us to the earlier observation (see Fig. 2.33) that birth is concentration on the S-axis, and death is deconcentration. Now we can say that CONCENTRATION IS A TRANSFER FROM LOWER HARMONICS TO HIGH HARMONICS (Fig. 2.44), and vice versa.
This large-scale scheme reveals to us a deeper meaning of the phenomena of birth and death. THE DECREASE OF OVERTONE LEVEL IS THE PROCESS OF DEATH, THE DEATH OF ANY SYSTEM OF THE UNIVERSE.
Obviously, this follows the mirror conclusion that OBERTON LEVEL BUILDING IS A BIRTH AND DEVELOPMENT PROCESS.
VITIES OF THE SYSTEM. Let us see whether this conclusion has any correspondence to the facts.
Once again, let’s return to “Grains of the World Spirit,” which consists of the world’s ether.
The whole logic of the scale-harmonic model shows that the lower the overtone level, the longer the life span of its systems.
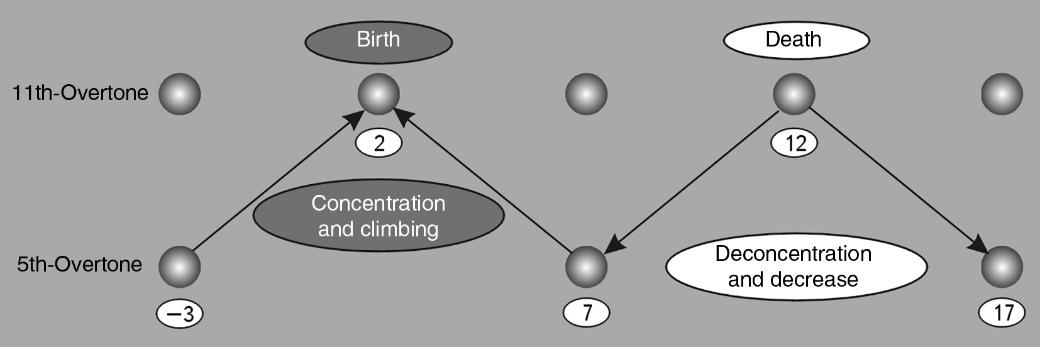
Fig. 2.44. Conditional scheme of birth and death on the diagram of scale-overtone levels. On the right is the death of a star. In this case, it is shown that the separation of a star (+12) into a core (+7) and a shell (+17) leads to a decrease in the overtone level.
On the left is the birth of a human being. It is shown that the growth of the embryo (-3) due to the Biosphere substance (+7) leads to the increase of the overtone level and the appearance of a human being (+2). Of course, the above examples only schematically convey the general idea and do not pretend to the accuracy of modeling the process
Thus, if protons and star nuclei (the second overtone) live for billions of years, then maximon and the Universe (the main tone), obviously, longer. In between (the first overtone) are the “Grains of the WORLD SPIRIT”. Hence, they are more stable than protons, i.e., they are more stable than ANY substance!
In the Universe of the first overtone, there is nothing yet, except for maximons, of which they could consist. In such a Universe there is not a single proton, electron, stars, planets, or galaxies. In such a Universe there is no matter yet, because matter is traditionally understood as matter consisting of atoms (or at least nucleons), and there are no atoms in the first overtone, there are no photons because photons as particles appear at the 11th overtone.
At the same time, in the Universe of the first overtone, unlike the Universe of the main tone, there are objects of rather large sizes - about 50 microns (these are the very sizes in which life is created). And these incorporeal immaterial formations theoretically have a mind-boggling stability and, consequently, a lifetime. As we hypothesize, their lifetime must be at least as long as the lifetime of the Universe, since they appeared in their pure form at the second harmonic, at the first overtone. If the Universe has existed for 14 billion years, then its age is the same. And as long as the Universe exists, they will also exist, being an integral part of its life.
Finishing this section, we note that a great variety of the most diverse facts collected by the author during 25 years of research on this question, confirm the reality of scale (four-dimensional) harmony. Long years of phenomenological processing of many reference data on the sizes, scale dynamics, and evolution of various systems of the Universe allowed us to identify and formulate the basic principles of the scale symmetry of the Universe.
All these years the author intuitively felt that behind this large-scale order, there is one simple and rather beautiful principle. Only recent years have given me the confidence that allowed me to formalize this intuitive model and to decide to give an explanation of the hierarchical order with the help of the model of four-dimensional harmony of the Universe.
It turned out that it is necessary to make only one but very fundamental step from the three-dimensional model of the world space to the four-dimensional one, as it turns out that the whole structure and dynamics of the Universe can be described with the help of the theory of waves and oscillations, with the application of the principles of musical harmony. If with the help of the theory of waves and oscillations, we can obtain all the stable dimensions of the evolutionary spectrum, which at the same time is continuously rearranged in its fine details, then the question arises, where do all the spectra of the basis series, which remains unchanged in the whole history of the Universe development, come from?
-
Sukhonos S. I. On the Causes of the Emergence of Preferred Sizes of Natural Bodies in Nature. Dep. VINITI from 27.01.1988. № 733–V88. ↩
-
Sukhonos S. I. The Fourth (Scale) Dimension. (Manuscript). ↩
-
Vladimirov Yu. S. Space-Time: Explicit and Hidden Dimensions. Moscow: Nauka, 1989. ↩
-
Sukhonos S. I. On the Threshold of a Four-Dimensional Civilization // Integral Knowledge. Logos of the Universe. First Issue. Moscow: White Alves, 1999. P. 5–32. ↩
-
Sukhonos S. I. Russia in the XXI Century. Moscow: Agar, 1997. ↩
-
Müller H., Sukhonos S. I. The Law of Densest Packing on All Degrees of Freedom of Biospace // MOIP Reports 1982. General Biology. Experimental Analysis of Functions of Biological Systems. Moscow: Nauka, 1985. P. 98–102. ↩
Base rate of S-symmetry The main coefficient of the S-symmetry of the Universe
There is every reason to assume that the Basis S-Wave remains unchanged for a very long time, perhaps it has always been so at least since \(T_0 = 10^9\) years ago, when the first stars began to form. Its invariance is related to the integrability of the basis coefficient of scale symmetry - \(10^5\), which permeates the entire scale structure of the Universe. We have no reason to believe that this coefficient has changed significantly over the last 10 billion years. It may be as stable a constant of the Universe as Planck’s constant, the speed of light, etc.
Let us try to outline here at least an approximate approach to explaining the periodization (with a step of five orders of magnitude) of the scale dimension of the Universe.
Suppose that after the first act of perturbation of the primary material medium, some primordial elements were formed. We will assume that they appeared in the form of spherical objects, which have some kinetic energy of pulsations (oscillations on the S-axis). So, initially, we have a very large number of primary “balls”, which pulsate with a natural frequency and fill some space.
We are talking, of course, about maximon. The sizes and all other parameters of the initial maximon can be the same. But since our Whole (Metagalaxy) has boundaries and inhomogeneities, the pulsation frequency of maximon can vary slightly. Because of this, interference phenomena may occur in the frequency field of the maximon medium. The closeness of the initial parameters of the maximon allows us to assume that the velocity and amplitudes of scale waves will be approximately equal, i.e. beats of pulsation waves may occur.
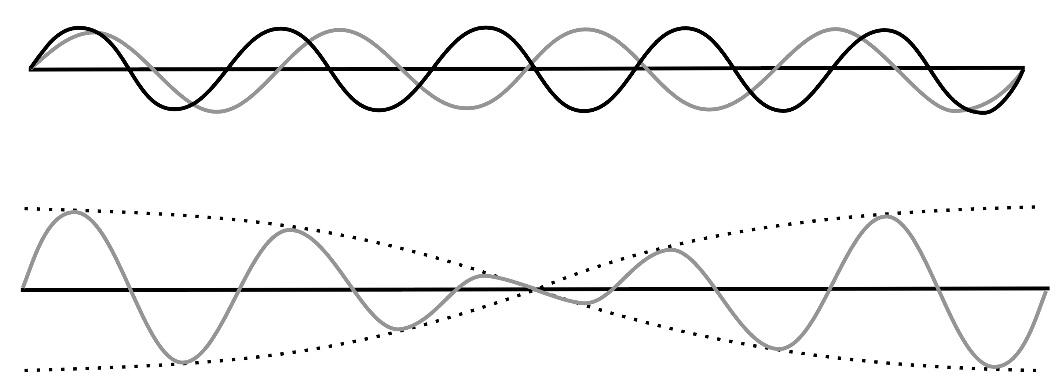
Fig. 2.45. The addition of the 8 Hz and 10 Hz signals gives us a 2 Hz beat, which produces a longer waveform
To illustrate the following conclusions, let us first consider the simplest example of runout from classical physics.
Figure 2.45 shows two separate sine waves traveling along a single line. At the bottom of the figure, these waves are superimposed on each other by adding the displacements produced by the two waves at each point.
Where the two signals have approximately the same phase, the resulting amplitude is larger. Where the individual signals are shifted in phase by approximately 180°, interference results in a signal with a very small amplitude. Suppose that the frequencies of the two signals are 8 and 10 Hz. The frequency of the total wave, the beat wave, will be equal to the difference in the frequencies of the original waves, i.e. 2 Hz. Naturally, the length of the beat wave will be 4 times longer than the first source wave and 5 times longer than the second source wave.
Let us now return to our “pulsating balls”. Suppose that for some unknown reason, the frequency difference between one part of them and the other is very small and equal to \(1/10^5\). It is not difficult to realize that the beat wave will have a frequency \(10^5\) times lower and a wavelength \(10^5\) times longer than the primary wave. Since the maximon has a spherical symmetry, then the beat wave will have the same spherical symmetry.
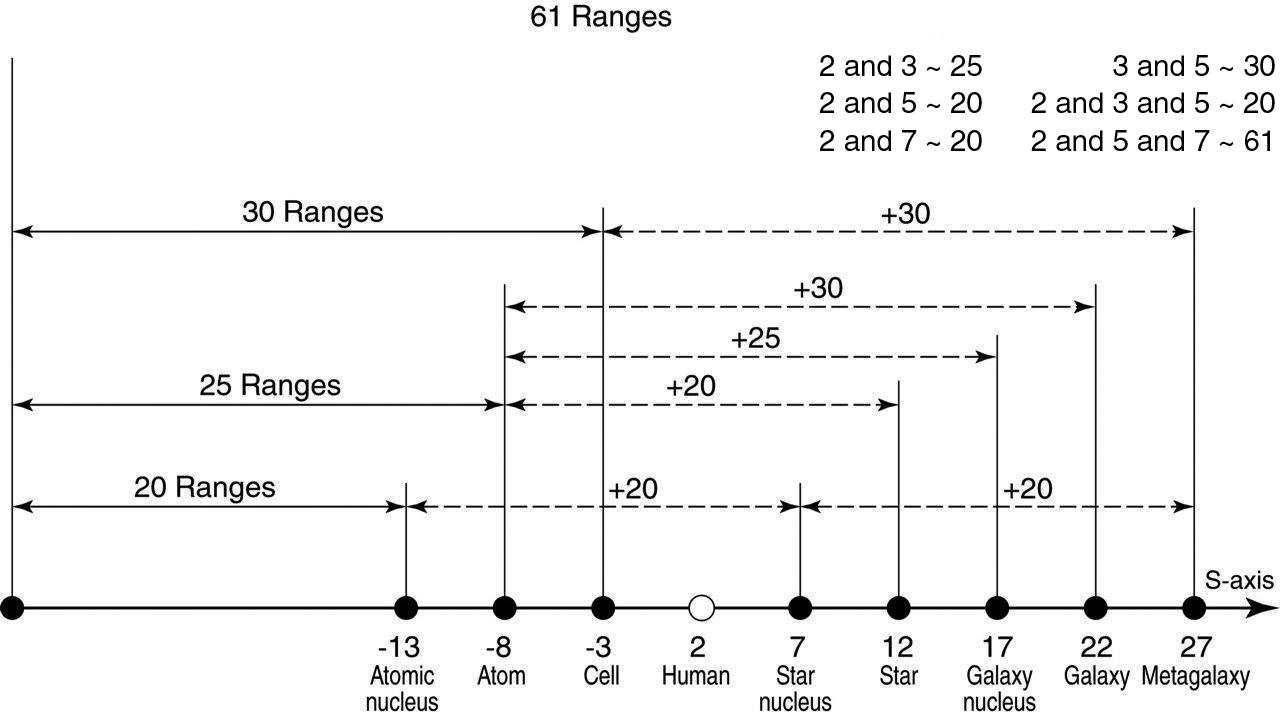
Fig. 2.46. Basis coefficients of scaling periodicity, when added and repeated, define a grid of stability nodes, which does not depend on the size of the Universe and on time
Consequently, in the maximon environment, there will appear spherical surfaces (more precisely - nodal volumes) whose sizes will be \(10^5\) times larger than the size of maximons. These regions can acquire a certain independence.
Thus, another hierarchy floor can be formed, on which it is necessary to consider already larger systems -
on this floor will lead to the appearance of the next stable level of the hierarchy with a step of five orders of magnitude.
The attempt to obtain by means of this model the coefficient \(10^5\) led the author to calculations published after the first edition of this book, and they are worthy of mention.
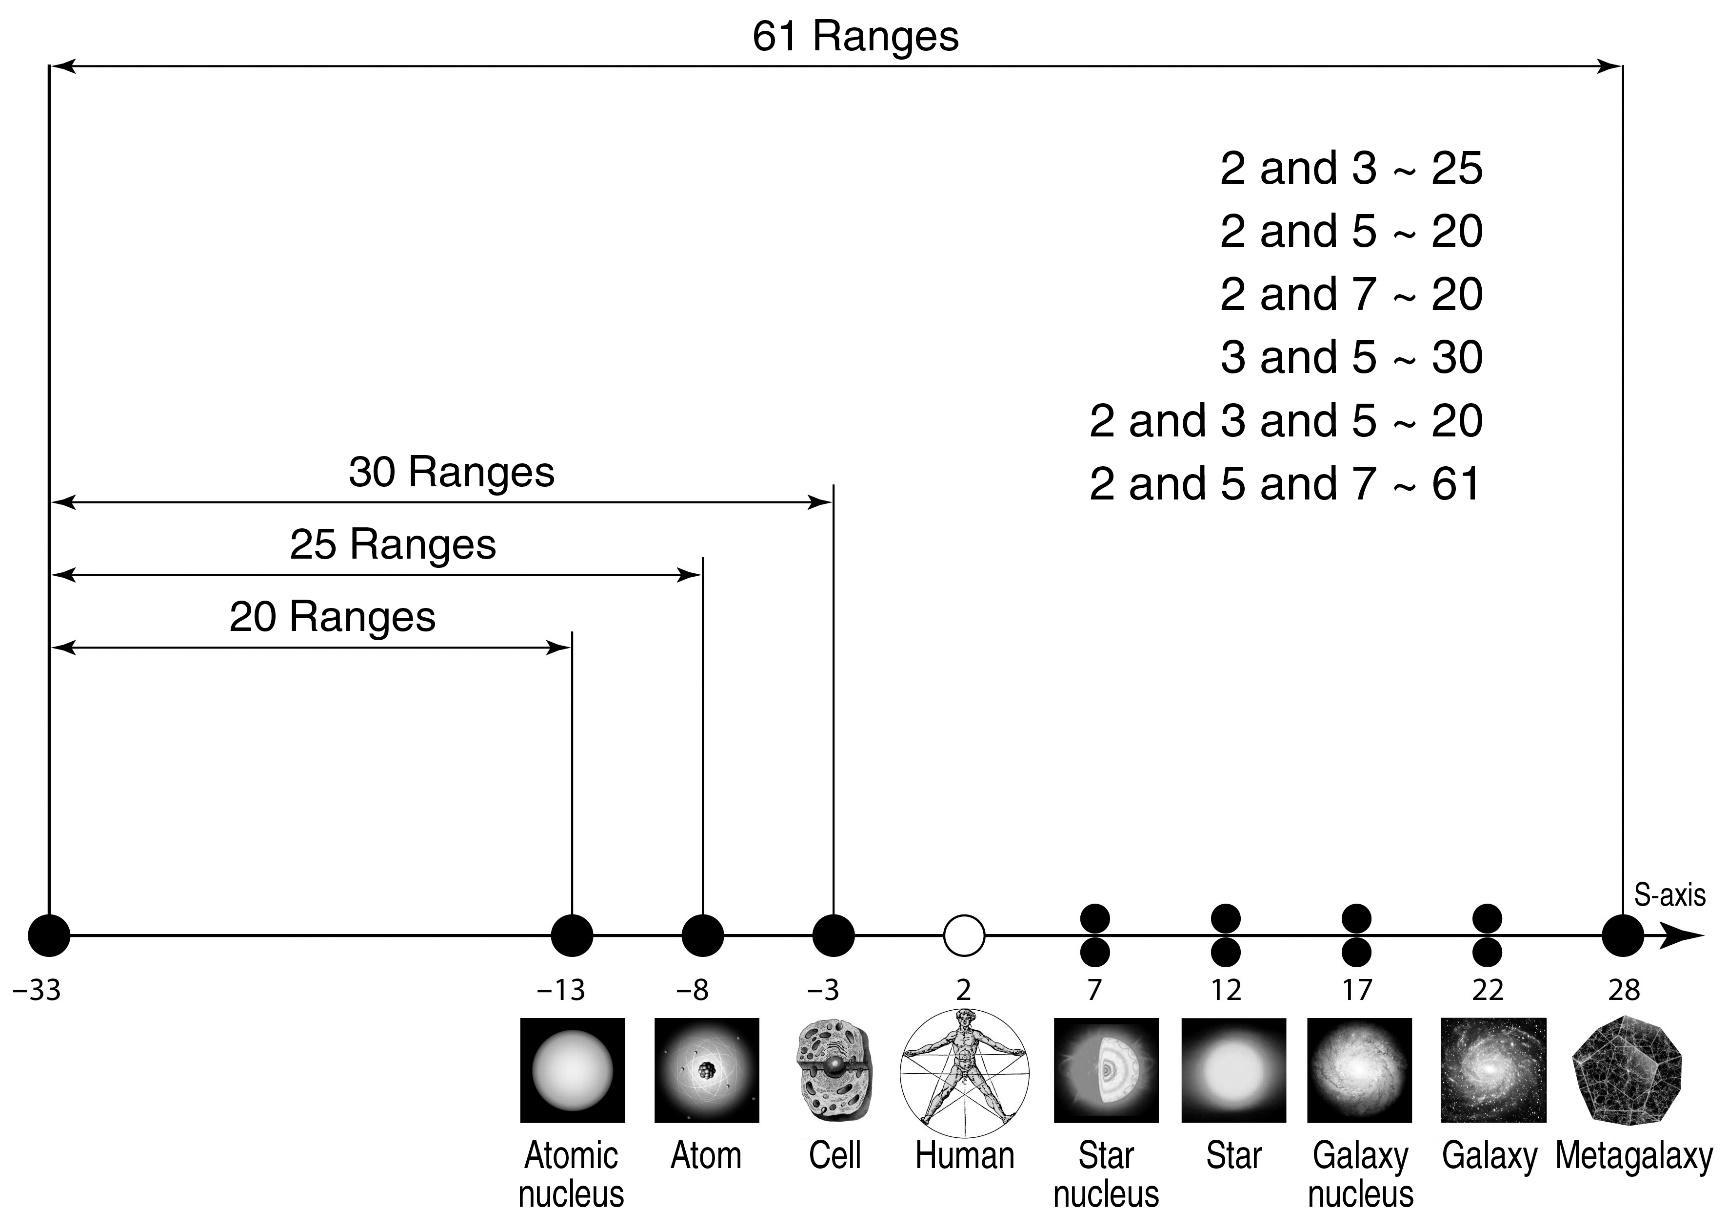
Fig. 2.47. Filling of the nodes of basic stability with known and most representative objects of the Universe
The variant of the origin of the basis coefficient \(10^5\) was considered in the paper “Arithmetic of the Universe”, where the coefficients \(\sim10^{20}\), \(\sim10^{25}\) were obtained based on the model for ion scale waves (pulsation waves) with the help of a computer program, \(\sim10^{30}\) and \(\sim10^{60}\).
These coefficients set the basic stable objects of the Universe (Fig. 2.46) and do not change depending on its expansion.
If we find a correspondence between these nodes, we obtain a very remarkable diagram (Fig. 2.47).
The given description leaves a lot of unresolved questions, the most important of them is why the frequency difference in the maximon environment is equal to one hundred thousandth. However, the proposed model does not pretend to derive the basis coefficient of scale symmetry from some general considerations. Its task is to show how stable formations can arise in the maximon medium at higher floors of the hierarchy - through the mechanism of wave beating. At the same time, there is no certainty that this is the way of creating a clear hierarchical structure of the Universe with a step of five orders of magnitude. Beats may have nothing to do with it at all. It is only important to understand that in the initial pulsating space of maximons there should arise total pulsations, the superposition of which can lead to essentially larger phenomena than the maximons themselves.
Some reflections on evolution of the harmonic structure of the universe
In this section, we allow ourselves some free reflections and nontrivial associations, based on the facts and models proposed in the previous materials. These reflections do not have a strict and complete logic, but they will probably help subsequent researchers of the problem of scale symmetry to go further than the author. In addition, they will allow to show how the author sees the evolution of the Universe, based on all the previously stated material. The facts show that the Universe is undergoing the evolution of structures at all its large-scale levels of organization.
The main vector of evolution is directed along the S-axis to the right, toward the increasing size of the Universe.
This conclusion has a fundamental worldview and scientific-philosophical significance. It indicates that all structure formation processes in the Universe are synchronized on its scale floors and are clearly tied to changes in its boundary conditions (sizes, etc.). We believe that there are no exceptions to this rule for any structures. Apparently, the beginning of the main evolution of structures can be considered a special state of the Universe, when its dimensions in the process of expansion reached a value close to \(1.6 \times 10^{27}\) cm (\(t \sim 10^9\) years). It was during this period that the length of the scale interval of the Universe was exactly equal to 60 orders of magnitude in the cosmological model of the expanding Universe. This S-interval was divided an integer number of times by 5 orders of magnitude into 12 half-waves (or 6 waves). Hence, at this special moment of expansion, the two numbers: \(10^5\) and 12 gave exactly the same breakdown of the S-axis into characteristic points. It was at this moment that the evolutionary standing scale HW had a “length” of \(10^{10}\) (i.e. 60: 6 = 10), which exactly coincided with the length of the basis HW. We called this state of the Universe the GLOBAL RESONANCE of the Universe.
Let us recall that it is to this age (1 billion years) that most cosmologists attribute the first and main epoch of rapid structure formation. It was then that such systems as galaxies and stars were formed, which even now determine the shape of the cosmos.
Further expansion of the Universe gradually led to the deviation of the evolutionary wave in phase from the basis wave. The evolutionary characteristic points were constantly creeping to the right along the S-axis, following the expanding Metagalaxy. Recall that the baseline stability nodes on the S-axis remained unchanged. At present, the overall mismatch has reached one order of magnitude for the Metagalaxy and various fractions of an order of magnitude for other objects of the Universe.
Let us now see what physical meaning can be given to the scaling harmonics. For this purpose, let us introduce the concept of a S-FIELD- a field transmitting the interaction along the S-axis. In the usual physical sense, such a field is responsible for synchronization of all pulsations in the Universe, since any of the pulsations (contraction - expansion) is an oscillation along the S-axis. Therefore, in the simplest variant, we can consider the scale field as a global resonance field of pulsations.
Next. All our previous analysis shows that there are special points on the S-axis in which the stability of objects increases. In other words, on the S-axis there are selected sizes of systems whose prevalence and complex stability are higher than systems with intermediate sizes. Nature, as it were, strives for certain sizes (certain points on the S-axis) and escapes from intermediate sizes. Thus, there are stable and unstable dimensions in nature. Let us see how this can be interpreted from the positions of the concept of S-Field introduced by us.
Since the selected, special points on the S-axis determine the most stable dimensions, we can PROPOSE that the stability of objects of corresponding dimensions is related to the fact that the changes in the scale field at these points are minimal or equal to zero, while between stable points the variability of the S-Field increases.
The phenomenological analysis allowed us to identify 13 main stable points on the S-axis. We associated them with the nodes of the 12th scaling harmonic (11th overtone). Of course, besides the 12th harmonic, it is necessary to take into account other integer standing waves generated by overtone frequencies. And therefore it is necessary to consider practically the whole potential spectrum of standing waves. Since it is known from the theory of oscillations that the energy of the overtone frequency decreases as the overtone number increases, the significance of the characteristic dimensions on the S-axis, which will be generated by the frequencies, should decrease as n increases.
It is also important to note that each of the S-Frequencies has its own spectrum of stable dimensions, which are interconnected exactly through this frequency. Therefore, if on the S-axis we find two neighboring and very close stability points, it may turn out that they belong to completely different frequency resonances and are not related to each other, they may even be antagonists in some processes. Such richness and diversity of stable dimensions, which permeate all floors of the Universe, can generate corresponding richness and diversity of their material embodiment.
It should be remembered that ultimately all the subtle spectra of the Evolutionary SW are tied to a single basis spectrum, they are all overtones of the main tone, and since the SSW is a standing scale wave, the frequency of the main tone is determined by the length of the S-Interval of the Universe, which changes with time, as the Universe expands (or pulsates).
Consequently, standing waves and the whole spectrum of stable sizes of the S - Evolutional Wave of stability (SEWS) are a constantly changing spectrum. In this connection, a grandiose task arises to model the process of expansion of the Universe, especially from the time moment of 1 billion years up to our days, with such a condition to restore the whole picture of overtone oscillations and the spectrum of evolutionary stable sizes generated by them. Already the first attempts of modeling convinced the author that this is a very interesting and fruitful task, the solution of which will allow us to understand many specific features of the evolution of matter in the Universe at all its levels.
Let us consider another aspect of the problem. The author is often asked “tricky” questions: why are \(10^{-32.8}\) cm and \(10^{28.2}\) cm such significant sizes in the Universe? Why is there 61 orders in the S-Interval and not 62 or 537, for example?
The answer to these questions can be surprisingly simple. All these centimeters and orders are purely human conventions. FOR THE UNIVERSE, THE WHOLE S-INTERVAL IS A WHOLE EQUAL TO ONE.
The harmonic division of this unit is carried out according to the same laws as the division of a string by standing waves of fundamental frequency and overtone frequencies. In this case, neither the length of the scale interval nor its measurement in centimeters changes anything in principle. Therefore, the whole theory of musical harmony is applicable to the theory of scale harmony.
The appearance of specific sizes in centimeters is a historically temporary phenomenon because you can measure the length of the boa constrictor, as in the famous cartoon, by parrots.
However, it is surprising that, despite the undoubted conventionality of the centimeter, it is coordinated with the average size of the human body almost through the golden section coefficient. Let us remember that the average human height corresponds to one of the vertices of the S - Basic Wave of stability (SBWS).
A question of another kind arises. Why exactly are maxims the point of reference for all processes?
This question can also be considered in another plane. Let us imagine for some time a situation when in some primary material multidimensional medium, an important property of which is the possibility of infinite fragmentation into smaller and smaller elements, some perturbation occurs, for example, a monotone sound is born (“In the beginning was the Word…”). Then a standing wave with all overtones is formed in this medium.
The first basic tone is set by two extreme points on the S-axis - these are the nodes of the first wave. In these nodes, the stability of matter will be the highest (and to the left and right of them matter does not end, so we can speak only about some phase boundaries on the S-axis). We take the length of the primary interval as unity.
The left edge of the interval will give us the stable size of some primary element - the first brick of all matter - the UNIT. We do not care about its size expressed in something. We care that it will be smaller than the WHOLE. The right edge will give us the boundary of the WHOLE. Then a spectrum of overtone oscillations will be formed on it, which will divide the whole interval into many segments. This is how systems smaller than the WHOLE will appear. The more there will be overtones, the more there will be standing wave nodes on the S-axis, the more there will be a variety of sizes, the more there will be levels within the whole interval, the more there will be steps between its left and right edges.
For the frequency spectrum of the scale axis, this difference is measured in fractions of a unit. For us, as for physical objects of the multidimensional world, the difference between a stone and a star is measured in many billions of meters and kilograms. In the first case, the difference is almost imperceptible. In the second case, it’s enormous. So, since, remaining within the framework of only scale dimension, we have set as an initial condition of infinite possibility of division of the primary material medium into parts, it is as easy to get ultimately \(1/10^{61}\) of a fraction of the Whole as it is to get all other fractions. Well, since we do not know where the process breaks off and of which supercelestial our Whole is a part, all problems of this kind become rather conditional.
This is how a hierarchy of stable sizes could appear - a prerequisite for the birth of atoms, stars, galaxies, etc. All their sizes can be measured in fractions of the UNIT, the WHOLE.
Which, by the way, is done in Fig. 2.43.
Then we will get an amazing accuracy of stable sizes and their consistency at all levels of the hierarchy of the Universe. Therefore, the only natural and truly physical measure for everything in the Universe should be considered as a measure of proportions, a measure of relations, and dimensionless coefficients. That is why NUMBER is the measure of everything.
Consider once again the HYPOTHESIS about the two kinds of scale fluctuations that are responsible for baseline and evolutionary WAVES of stability.
Let us first consider the BASIS type of vibrations. We assumed that it is the basis S - Basic Wave of stability, which originates at the left extreme point of the S-Interval of the Universe (on the floor of the maximon), that forms the most stable and widespread objects. It is with the scale length \(10^5\) that such stable structures of our world as electrons, protons (neutrons), hydrogen, etc. are associated. And although the mechanism of formation of these oscillations remains a mystery for the author, intuition suggests that we are dealing with large-scale interactions that come from the structural depths of the Universe.
These interactions can be generated by pulsations of the primary elements of the Universe - maximon, which do not depend on the size of the Metagalactic boundaries.
The basic parameters of maximons are as fundamental constants of nature as, for example, the speed of light.
Somehow this pulsating field of maximon generates \(10^5\) times lower frequency of pulsations. Accordingly, the wavelength of this second frequency is also \(10^5\) times the wavelength of the primary frequency of the size of the maximon. It is important to emphasize that the new frequency has the same rigid parameters as the primary frequency. It forms at a higher level of the matter hierarchy a new kind of objects whose sizes are 100,000 times larger than maximon.
These objects, interacting with each other, can form a third frequency, which will set in 5 orders of magnitude another higher level of hierarchy.
At the fourth step from maximon (after 20 orders of magnitude) we obtain such stable particles as protons and neutrons, and at the fifth step - hydrogen. The stability of their frequencies and other parameters is as high as that of the maximon.
Further, as we believe, all other levels of the hierarchy up to the metagalactic level - \(1.6 \times 10^{27}\) cm - are built according to the same principle.
Let us note once again that for the author the most unsolvable mystery is the existence in the Universe of such a round step between scale levels as \(10^5\) . Why exactly this number turn out to be so “survivable”? Why not \(10^3\) or \(10^{2.35}\), for example? Perhaps, the clue is hidden in the general properties of the interaction of pulsating objects, perhaps, this parameter was laid down by the Creator as some primary constant of the large-scale organization of all matter.
The author has no answer to these questions, but intuition suggests that in any case, the basic oscillations come from the depths of matter at any point of three-dimensional space. There is a scale-frequency tuning fork, which stabilizes all matter and forms the hierarchical skeleton of the Universe. This scale frame does not change when moving in space, it does not change in time, it is universal and stable, and it is supported by a certain wave scale oscillation process, which originates in the Maximon medium and does not depend on the size of the Metagalaxy and any external conditions of the three-dimensional world.
So, this process is built from below, from the first level, from the fundamental size. That is why this whole complex scale-story structure is permeated with precise basic proportions, which are ultimately multiple of the fundamental size, mass, frequency, etc. - the parameters of the Maximon. With time in the process of Metagalactic expansion these proportions (hence, sizes) do not change, they are constants of the Universe, its invariant unchanging skeleton.
This frequency flow, which comes from the depths of matter, passes through the surface of any object from inside to outside (and a human being included) and goes beyond it, into higher levels. It maintains the basic parameters of the Universe. Without this flow, the Universe would turn into some rapidly changing fluid kaleidoscopic medley of appearing and disappearing objects. It is a kind of maximon of the Universe, to which all its systems are tuned without exception.
An EVOLUTIONAL kind of vibrations are standing waves and their overtones. The physical reason for their appearance is very transparent. Any pulsations in the Universe, propagating in space, should be reflected from the boundaries of the Metagalaxy. Their interaction can lead to the appearance of large-scale standing waves, whose motion will be directed inside the structural arrangement of matter. These reflected waves will be compressed until they reach the maximon edge of the S-interval. The resulting flow of reflected waves from the Metagalactic boundaries forms the INFORMATIONAL spectrum of parameters. The term informational is applied here very conditionally. It means that all edge changes of the Metagalaxy through a complex system of cascade-hierarchical influence penetrate all objects of our world with its help. This flow comes as if from above, from mega-levels. It penetrates objects so that energy and information go from outside to inside.
Thus, there are as if two counters (on the scale axis) flow (see Fig. 2.48). They should constantly interact and create a temporarily stable synthetic S - Wave of stability, which constantly (but, most likely, discreetly) changes its nodes and bunches and reacts sensitively to all changes in the Universe as a whole.
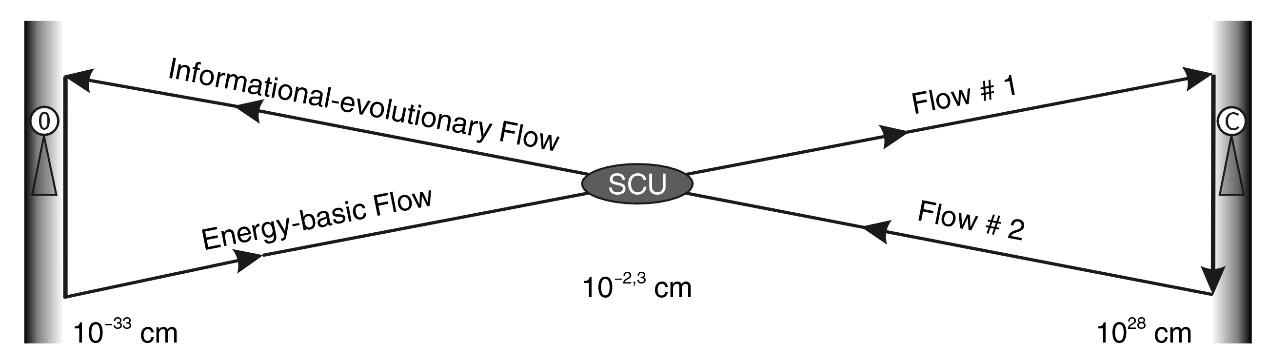
Fig. 2.48. Two counter scale flows - energy (No. 1) and information (No. 2) - intersect at all levels of the Universe hierarchy, but at the S-Center of the Universe the interaction of these scale flows can have special consequences
This wave, by virtue of the laws of generation of overtone frequencies, also generates a mass of special points on the S-axis - stable sizes, the spectrum of which has a fractal character. Transferring to ordinary images, we can note that two global S - Wave of stability of the Universe affect the same maximon substrate, so they are obliged, interacting with each other, to generate a general in the spectrum of steady states - the large-scale interference of S-Vibrations of the Universe. It is this interference pattern that we perceive as the EXISTING WORLD. As this interference pattern changes because of the dynamic processes going on in the Universe, so does the world. Often, what was stable yesterday and seemed immutable, as if by magic tomorrow is washed away by a new reflected SWS, which generates a different arrangement of forces and a combination of other parameters. At the same time, due to the presence of an invariable S-frequency with a wavelength of \(10^5\), a certain unchanged structural framework of matter is preserved at all scale levels, which allows the world to preserve its continuity with all its variability.
From a philosophical point of view, the flow coming from inside any object of the Universe can be called the energy flow **(**EH). For any person, the image of the flow coming from the depths of the Earth is closer and more familiar. Why?
We live on the surface of a balloon. Everything that comes from inside this balloon is due to the basic flow. Everything that comes from the outside comes from the evolutionary flow. That’s right. We should not forget that from inside to outside of each person there is a base flow, and from outside to inside there is an evolutionary flow.
In this sense, the power of Yin is concentrated not under the feet, but in the depth of the structural organization of man, while the power of Yang comes not from above, but from all sides of the Universe, from its higher hierarchical floors.
Two counterflows of information and energy penetrate all scale floors of the Universe, and at each of them, these two flows pass through each other (see Fig. 2.46). At the very center of the S-axis, they meet in the large-scale equality of their forces. Here, at this large-scale focus, they produce the most complex play of interference waves. Here the changes occur with the highest velocity. Everything that happens both in the depths of the Universe and on its boundless cosmic expanses is reflected here. It is here, on the floor of the SCU, that the basis of life, the cell, was born.
THAT IS WHY LIFE IS THE FOCUS OF ALL UNIVERSAL PROCESSES, ITS QUINTESSENCE.
The life of each person is a reflection in a capacious spatial form of everything that happens in the Universe.
The S-Field transmits and regulates birth and death, the expansion of states, and their demise, it regulates all processes on Earth. For us, the S-Field is the field through which the Universe controls the entire Universe and everything that is close to us. So, we PROPOSED that oscillations along the scale axis have some physical meaning.
We PROPOSED that some abstract wave in the scale space generates stable sizes of objects. If we pass from the field of formal reasoning to the field of traditional ideas about the physical world, then from all this it follows that ALL WITHOUT EXCEPTION THE MATERIAL SYSTEMS OF THE UNIVERSE ARE SUPPORTED IN THEIR SIZES BY SOME MYSTERIOUS LARGE-SCALE VIBRATIONS.
It also follows from all this that it is these, previously unknown to science, S- Fluctuations that create all the diversity of both stable forms of matter (S - Basic Wave of stability) and its variability (S - Evolutional Wave of stability).
So, the Universe is a COMPLEX FOUR-DIMENSIONAL (AS A MINIMUM) SYSTEM, IN WHICH STANDING S-WAVES ARE REALIZED.
The nodes of these waves are three-dimensional, so in the Universe, there are three-dimensional objects with increased stability and decreased stability (stability depends on the degree of distance of the object from the node).
METAPHYSICAL DIGRESSION
What can be more absurd than the picture of a world that came from nowhere, from a mathematical point - from abstract nothingness, will go through a gigantic path of evolution, the creation of a mind capable of mapping this entire path, and which will end in universal death, chaos, where no trace of the beginning of this world and its evolution will remain - only a huge number of tiny iron droplets scattered across the universal void. The senselessness and absurdity of this picture cause the author’s universal longing.
It is only necessary to restore the symmetry of the global scale dynamics, and this dull picture disappears like the remnants of a nightmarish dream after the awakening of the mind. And a completely different world opens before us in all its splendor, where there is no place for global chaos and emptiness, where life and death are two opposite phases of infinite reincarnation of matter and energy, where the Universe is a perpetual motion machine that has never stood and will never stop in the future. And one involuntarily turns to the religious worldview, in which there is no place for the dismal and inglorious end of this world, and discovers amazing parallels. If the S-axis is depicted vertically, in accordance with the generally accepted idea of the top (megamir) and bottom (microcosm), the ***phase picture of energy flows can be represented as a cross (***see Fig. 2.49).
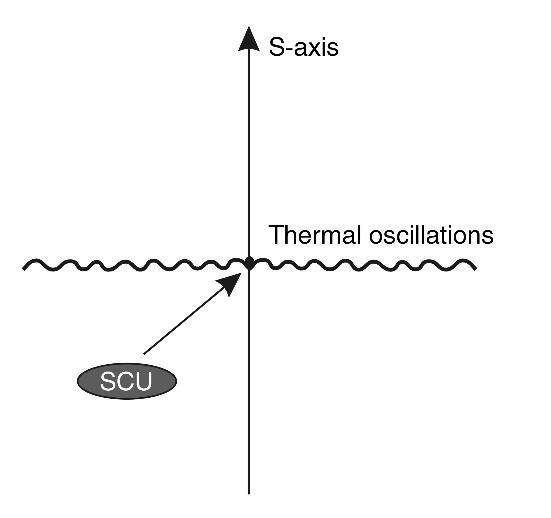
Fig. 2.49. The S-thermal diagram of the Universe looks like a cross
The vertical of the scale hierarchy of the Universe is complemented by the horizontal of the energy flux of thermal radiation, which is concentrated in a narrow scale slice exactly located in the center of the S-interval.
The horizontal symbolizes all types of motion traditionally studied by science, which, as a rule, do not include large-scale motion (motion along the S-axis). Any Brownian motion of particles of matter, the motion of stars in galaxies, the oscillatory motion of atoms in crystal lattices, the motion of people in a city and cars on highways, the motion of planets in the solar system, etc., etc., etc. - all these are the dynamics of scale-constant processes that proceed at the same scale level.
Classical physics in most cases is occupied with consideration of exactly these “horizontal” processes. That is why it indifferently passes by the lying on the surface examples of scale-symmetric processes of death of stars
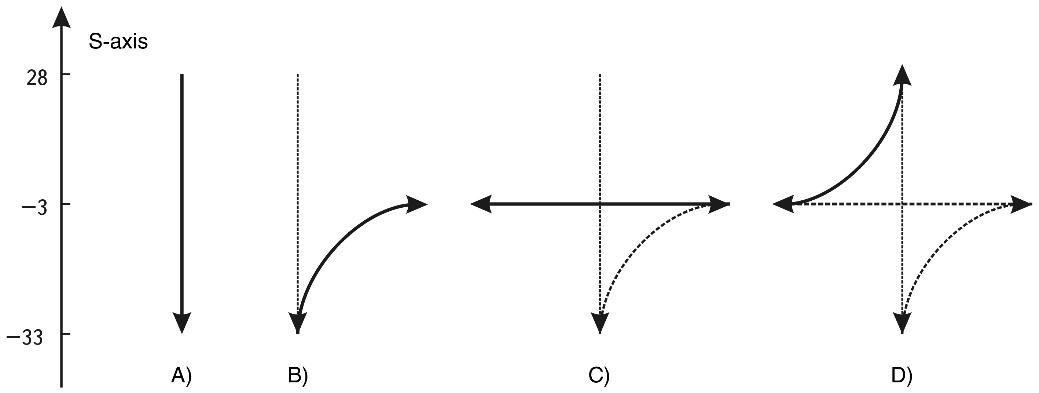
Fig. 2.50. The spatial scheme of prayer baptism mysteriously coincides with the author’s discovered scheme of dynamic, “life-giving” processes in the Universe.
A. The top-down movement is the Word (sound) that generates the structure, the spatial-informational framework of this world through the standing Evolutionary Wave of stability.
B. The movement from the bottom up to the middle is the process of filling this framework with the material substratum, the raw material of which is the maximon, the generation of the material world.
C. Horizontal motion - the material world generates thermal radiation whose wavelength corresponds exactly to the middle of the S-vertical.
D. The movement from the middle upwards is the generation of the thermal expansion of the Universe, which leads to a new space-information matrix. The cycle is closing.
And…a new Word, a new sound…and a new baptism of prayer
and other processes (a tiny fraction of which we have attempted to examine in this book), that it is all a vertical dynamic, not a horizontal one.
Now we see that along with classical dynamics, science needs to open a new section - the section of S - Dynamics. In this section it will be necessary to study all laws of such processes as pulsation, expansion and contraction, birth and death of systems.
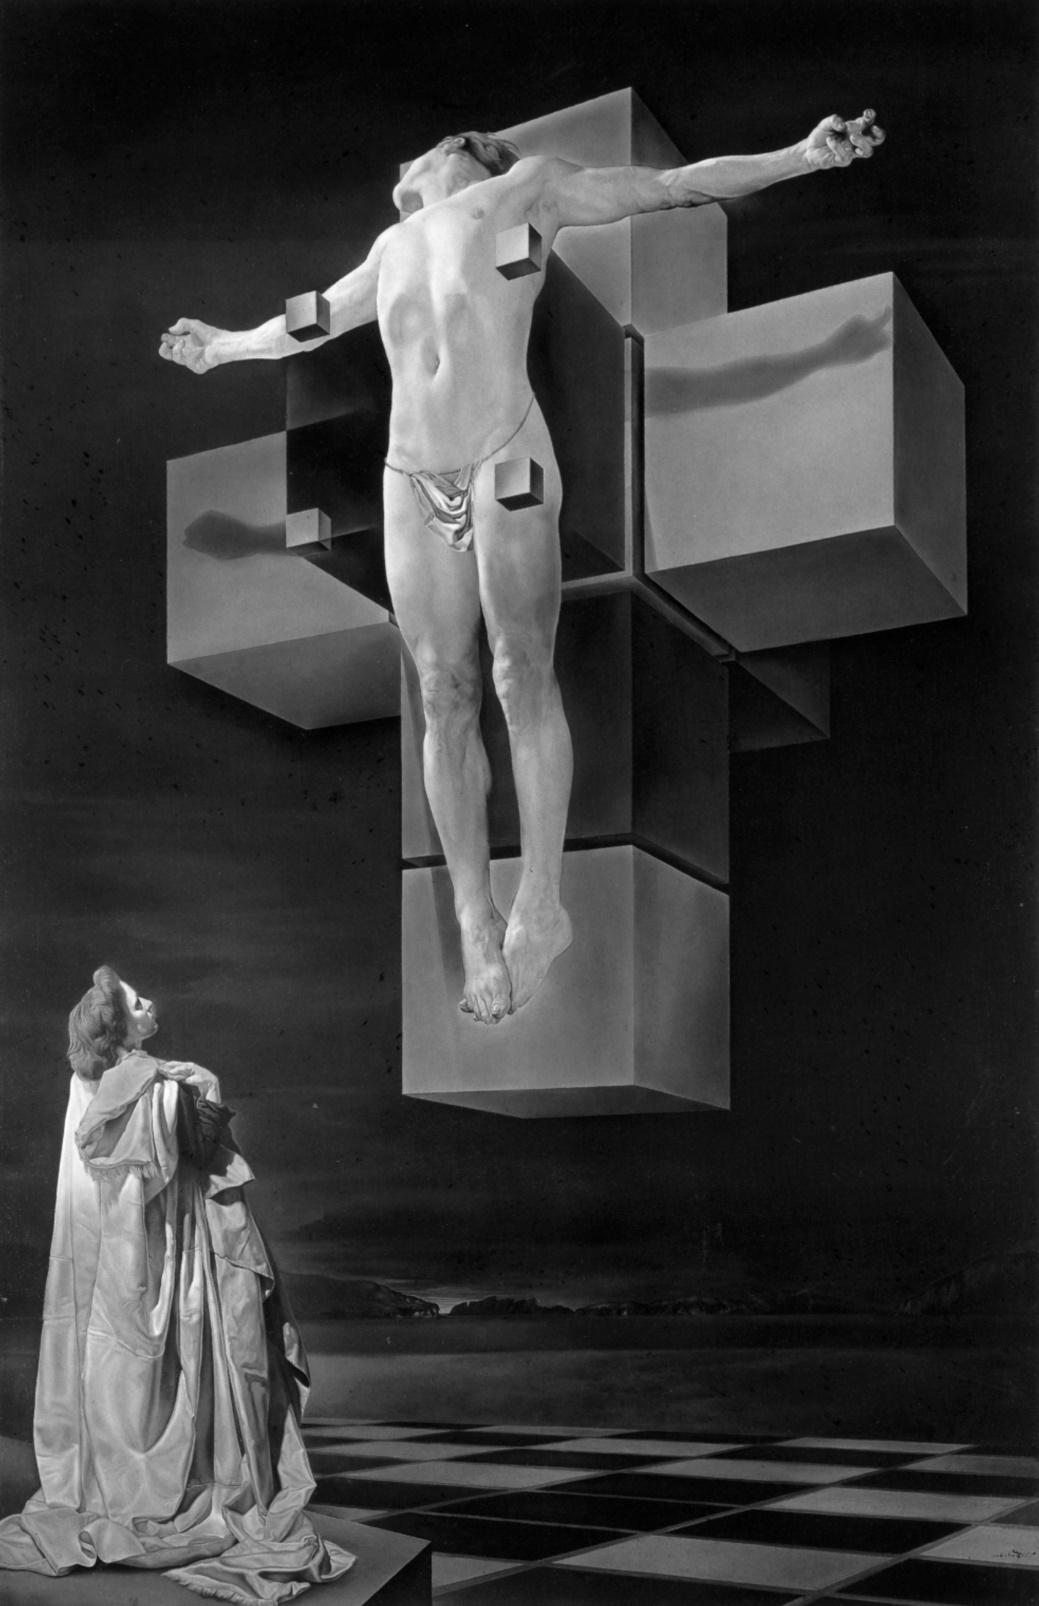
By the way, I would like to note that the cross is also a metaphysical symbol of global dynamic processes in the Universe, and prayer baptism is a kind of modeling of these processes in the form of a phase diagram
The unique properties of S-center of the Universe
When, at the very beginning of this research, back in the 1970s, I discovered that at the S-Center of the Universe (SCU) there is a living cell, I was overcome with the thrill of communicating the deepest mystery of the Universe. And it was this fact that awakened in me an unquenchable desire to understand what is represented by a large-scale space, the center of which is so precisely occupied by life.
Doubts constantly hovered over me, sometimes encompassing me completely, and then the scale boundaries seemed shaky, their definition seemed arbitrary, the S-axis itself became no more than a conditional parameter.
The only way I could banish my doubts was to collect another layer of information, systematize it along the scale axis and determine its structure-forming role. This is how the STATICS of the SCALE RANGE was first manifested, then the STRUCTURAL SIMILARITY OF THE THREE FLOORS OF THE UNIVERSE was revealed, the meaning of the DYNAMIC PERIODICITY OF SYNTHESIS-DELIVISION became clearer….
After each step, my doubts left me for a while, but then reappeared. It was too much information to be sure of the accuracy and volume of the information.
The work of systematization was sometimes exhausting. But the fatigue receded when I saw that no one but me still knew about the central scale position of life in the Universe, and when I saw that this ignorance led to an appalling worldview of despondency and cynicism. Then I went back to the reference books and special literature and got another slice of the S-World order, which convinced me myself that the S-Center of the Universe is not an empty formality, but an essential aspect of our world.
Of course, our whole world, with its galaxies and atoms, may be just a part of a much bigger world, where other laws exist, where another mind is doing the hard work of understanding, but does that make the universe in which we live not the whole world less important?
Whether the scaling boundaries we have used in this paper are absolute or relative, whether the fundamental length and radius of the Universe limit the world to humans only or to all intelligent beings in the Universe — these are philosophical questions of a very general nature.
Man cannot break out of his own shell, abandon his Earth and become an alien. We are creating a science of humans, not ephemeral inhabitants of other worlds. And for our science, the identified boundaries will forever remain as important as the boundaries of the planet Earth established centuries ago.
And so, comprehending the laws of scale space in order to establish the real significance of the scale-central position of life, I gradually discovered such facts that were not connected with boundary conditions and even with scale symmetry.
I discovered facts that simply showed the highlighted position of the Scale Center of the Universe (SCU) in the hierarchy of processes and phenomena of the Universe. So the SCU began to work in a feedback loop. Its isolation reinforced the reality of the large-scale boundaries of our world.
And it became clear that the size of about 50 microns is itself a fundamental parameter of our world, which is as accurate as the radius of the Universe.
Simple calculations show that at a diameter of the Universe of \(1.6 \cdot 10^{28}\) cm the SCU is located at 50 µm, at a diameter of the Universe of \(10^{28}\) cm at 40 µm, at a diameter of \(2.5 \cdot 10^{28}\) cm at 63 µm, at a diameter of \(10^{28.8}\) cm at 100 µm.
We see that the entire range of the theoretically calculated age of the Universe from 10 to 25 billion years gives very non-significant variations in the position of the MCV between 40 and 100 μm.
Let’s look again at what is remarkable about the S-Center of the Universe.
At the same time, it is necessary to realize that in nature regularities often make their way through statistical diversity. Therefore, it is pointless to analyze objects with a size of only 50 μm and not to consider objects with a size of 40 or 60 μm. To begin with, it is quite enough to choose a range of only one order of magnitude: from \(10^{-3}\) cm to \(10^{-2}\) cm (or from 10 to 100 μm), which is 1/61 of the entire S-interval of the Universe, or about 1.5% of its length. Consequently, considering a “fat” point on the S-axis in one order of magnitude, from 10 to 100 µm, we get deviations not more than 1.5 %, which for the first theoretical approximation is more than accurate.
For the sake of brevity, we will hereafter refer to the size of 50 µm as the SCU and the range from 10 to 100 µm as the SCU range.
Let us enumerate the many remarkable features of the mass center of the Universe, dividing them into those belonging exclusively to biology and to physics.
BIOLOGICAL ASPECT
First. It is the SCU range that is the average size for all kinds of cells: unicellular, plant and animal.
Second. It is in this size range that cells acquire the ultimate form of symmetry — radial-spherical.
Third. It’s practically only in the range of SCU that the mystery of the transformation of non-living matter and energy into living matter, since both diatom algae, autotrophic bacteria, and chloro-plastes of plants have sizes mostly from this range.
Fourth. The reproduction of unicellular organisms proceeds by the process of division. And this process mainly occurs when organisms reach the size of the HAB range.
Five. Reproduction of multicellular organisms occurs by the synthesis of two sex cells.
Most spermatozoa and female germ cell nuclei are in the size range of the SCU range.
Sixth. The size of the nucleus of a female germ cell and a human sperm-tozoon at the moment of their synthesis corresponds almost perfectly to the size of the SCU.
Thus, the isolation of the SCU range in the scale hierarchy for protein systems is obvious. The following fundamental conclusion can be drawn from it.
LIFE IS NOT ONLY CONCENTRATED IN ITS BASIC — CELLULAR FORM IN THE S-CENTER OF THE UNIVERSE, BUT ALSO APPEARED AND CONTINUES TO REPRODUCE IN THIS VERY LARGE-SCALE SLICE.
Let us indulge in some philosophical reflections on this topic.
We can see that not only all multicellular beings originate in the SCU, but also the act of reproduction for all unicellular organisms takes place in the same size range. Once they reach this size, they begin to divide, thereby giving rise to new cells. Practically outside this range, reproduction of unicellular organisms does not occur.
Consequently, on this section of the S-axis, on this hierarchical site, the mystery of reproduction of all living organisms is realized: from unicellular to multicellular.
Moreover, not only the reproduction of previously formed systems, but also the formation of new ones — the transformation of dead matter into living matter — takes place in this size range.
Let us recall that all living things are divided into two main groups: the first group lives at the expense of the physical environment and physical energy, forming the foundation of the pyramid of nutrition; the second group lives exclusively at the expense of the energy of the first group.
The main building block of the first group is plants; among multicellular organisms, only plants can transform the energy of sunlight into biological energy and physical substance. All other living organisms ultimately derive their energy and substance from plants. And only plants use substances from the non-living environment for growth.
So, plants are the source of life on Earth in the sense that they are the ones who perform the sacrament of revitalizing dead matter.
Plants have different sizes, but it is obvious that the whole process of revitalization takes place in the plant cell, the average size of which, as already mentioned, is in the range of SCU.
This fact, however, merely indicates the centrality of a structure such as the cell in the animation of matter.
Since all living things (excluding pre-cellular systems) consist of cells, there seems to be nothing unusual in the conclusion about the role of SCU.
Nature has provided two more clues that allow us to verify the logic of the hypothesis. The point is that the energy of sunlight is converted into biological energy not by the cell itself, but by a special structure, the chloroplast. Initially, this system could be of any size: much smaller than a cell or consist of a set of cell colonies. But even here everything coincides: the factory for processing physical energy into biological energy - intracellular organoids chloroplasts - have a length that just reaches 10 microns (the lower limit of the interval marked by us).
The second clue has to do with bacteria. In addition to plants, there is another type of biological systems that revitalize dead environments - bacteria. But not all of them, only autotrophic ones.
Since bacteria come in two types: heterotrophic and autotrophic, it is curious to see how they differ in their place relative to the range of ICH. Is there a fundamental difference in size between them?
So, it is known that heterotrophic bacteria feed exclusively on organic food, i.e. parasitize living matter, while autotrophic bacteria are capable of primary production of organic matter in the Biosphere. So, practically all heterotrophic bacteria are smaller than 10 µm, and all autotrophic bacteria are larger than 10 µm and are exactly in the range of SCU.
Consequently, bacteria also appear to be capable of the mysterious process of revitalizing a dead environment only within the range of the SCU.
Moreover, although multicellular plants make up more than 90% of the biosphere’s matter, nearly half of the oxygen and biomass is produced by unicellular algae, mainly diatoms. The overwhelming majority of these algae have sizes belonging to the range of SCU.
To summarize, we can make a very non-trivial CONCLUSION: ALL SYSTEMS WHICH ARE RESPONSIBLE FOR THE CREATION OF NEW LIFE HAVE SIZES OF THE DIAPASON OF SCU.
Figuratively speaking, LIFE CAN BE BORN IN THE SCU AND ONLY IN THE SCU IN THE UNIVERSE! THIS IS THE ONE POINT ON THE S-axis FROM WHICH THE SPRING OF LIFE FLOWS.
This is where sunlight is transformed into biological energy, where minerals are transformed into proteins, where the mother cell divides into daughter cells, allowing unicellular cells to fill every conceivable and unthinkable ecological niche in nature, and where the two sex cells of multicellular organisms meet to start a new life, a new creature. It is likely that the first living systems to appear on Earth were also of the size of an SCU.
AND MAN DOES NOT PASS THIS RULE. The length of the male sex cell, the sperm, and the size of the nucleus of the female sex cell, the ovum (30-50 microns), correspond strikingly precisely to the SCU. Although the oocyte itself is considerably larger than the center-scale size (its diameter varies within 130-160 µm), the lion’s share of its substance is only nutrient material for the first stages of development, nothing more than raw material.
The main developmental processes of the human embryo begin with the meeting of the sperm and the nucleus of the ovum, which takes place on a large-scale “shelf” that is practically perfect, this is truly “the place to be”.
Once again, we remind the reader that any coefficients from 1 to 9.9 in front of a ten with a degree are only a one order of magnitude deviation within 61 orders of magnitude, hence, changing the coefficients while maintaining the degree will result in a very small error of 1.5% at the very center of the Universe’s Scale Hierarchy!
PHYSICAL ASPECT
First. The SCU is the center of the range of dominant electromagnetic forces:

Second. The SCU is very close to the scale center of the thermal radiation range, which is the universal “accumulator” of all kinetic energy of the Universe:
Third. The SCU is the center of symmetry for the stellar heat generation process:
Fourth. The SCU is the center of symmetry for thermal radiation generated in the process of anthropogenic combustion of matter:
Fifth. The SCU is the supposed center of large-scale symmetry for the gigantic amount of heat released during the explosion of galactic nuclei:
Sixth. A partial, but very important additional example is the fact that the Sun’s radiation is maximally stable in time exactly in the range of SCU frequencies.
“The amount of thermal energy emitted per unit of time by the Sun … is remarkably constant. is remarkably constant “1. But if one moves the S-axis to the left or right of the SCU, the stability of radiation disappears: “…If one judges the Sun by ultraviolet, X-ray, gamma-ray radiation or by the level of radio emission power…. the Sun is a variable star. The intensity of the Sun’s corpuscular radiation… also fluctuates “2.
Thus, the isolation of the HAB range in the scale hierarchy for protein and non-protein systems is obvious. But here is a paradox: thermal radiation, according to the generally accepted opinion, brings chaos, disorder, and entropy, while life brings the opposite phenomenon — order, non-entropy. However, both processes are concentrated on a narrow strip of scales exactly at the scale center of the Universe.
What is it? A coincidence? Are there too many “coincidences” for a tiny speck on the S-axis?
So, the point of equilibrium, the lever axis of the scaling scales for the whole Universe is the point of the SCU. After all, it is to this point that the energy of the Universe flows. How interestingly everything turns out to be organized!
First, it is from here, from the point of the IAB, that the fountain of biological life springs forth.
Secondly, it is here that the large-scale flows of energy and information intersect, forming in this place the most intense interference pattern of large-scale interactions (see Fig. 2.48).
In addition, there is also a deep physics in the symmetry of thermodynamic processes in this highlighted position of the SCU.
It makes sense, since it is the HAB that is the node of the standing wave of the second harmonic of large-scale oscillations of the Universe, if we consider it in the four-dimensional model. Moreover, except for the extreme scale boundaries of the Universe, there is no point more important for the scale-harmonic oscillations than the MCV. In fact, at least every even M-harmonic creates special stability conditions at this point on the S-axis.
That is why, from the author’s point of view, the system stability increases significantly in the IAB, as evidenced by the increased degree of symmetry of all objects without exception, the sizes of which correspond to this range of scales.
Certainly, in this work only the first step to understanding the role of scale interactions and the role of the center of these interactions, the role of the center of the scale symmetry of the Universe, the SCU, was made.
The author is convinced that further research on this issue will reveal to us an incredible number of remarkable laws of nature, which will reveal to us many hidden secrets of the origin of life, its place and role in all universal processes without exception.
But let’s ask ourselves another difficult question: is there any geometric, spatial meaning to the center of the S-axis?
At first glance, this is not a real center of the Universe, because there are an infinite number of such centers in the Universe: wherever there is an object with a size of about 50 microns, there is the center.
The center of a sphere or a cube is another matter. Obviously, it is one and unique. The scale center of the Universe has some unusual meaning.
It is the center of a dimensionless proportional space in which everything is not measured in meters or kilograms,
Unique properties of the scale center of the Universe and relations, it is the center of the hierarchical structure of the Universe, which stretched from the Maximons to the Meta Galactics (Fig. 2.51).
In this mysterious center, alas, it is impossible to put any stele with the inscription: “Here is the center of the universe”.
But it can be easily shown (see Fig. 2.51) that the concept of a CENTER in general is a RELATIVE concept and has no meaning whatsoever without first defining the size of the space model.
For example, it is obvious that on the surface of a ball, as well as on a circle, there is no center at all!
Let us consider as an example an object very familiar to any reader — a table. When asked where its center is, most readers will immediately point to the center … of the table top. But thanks to the legs, the table has volume, so its “true” center is under the table top, halfway to the floor.
Consequently, in the three-dimensional model of the table, the only center is not where most of us would point. If the three-dimensional figure of the table is mentally cut by planes parallel to the table top an infinite number of times, then each section will have a single center, but it will differ in its spatial position from the three-dimensional center (see Fig. 2.52).
It turns out that even in such a simple example with a table, there can be as infinite number of centers as there are mass-staff centers.
Consequently, if we consider a three-dimensional model of an object, we can find a single center in it, but when we go to flat models, we find that the centers become infinitely many.
Fig. 2.51. Examples of searching for the true center in spaces of different dimensions, which show that the only center of any closed space is in the higher dimensional space
Let’s go further. Let’s imagine that we live in a two-dimensional world, for example, on the surface of our table. Then it will appear that there is only one single center in this world (it will be far from the other “true” center of the three-dimensional table). Since we can draw an infinite number of lines through the tabletop, each of them will have its own center, which will not necessarily coincide with the center of the tabletop. Again we have lost the single center.
Let’s draw an important conclusion:
Unique properties of the scale center of the Universe
Fig. 2.52.
А. The search for the true center of the table is meaningless if the dimensionality of the space in which the table is considered is not defined.
B. A three-dimensional table can have infinitely many two-dimensional sections, each with its own single center
THE SINGLE CENTER IS DEFINED ONLY FOR THE PRE-DIMENSIONAL SPACE MODEL WE USE.
By the way, this is why in everyday life we subconsciously use different models of space depending on the situation. For example, when young people are asked to sit in the center of the table, they will not think of climbing to the center of the tabletop or climbing under it — to the three-dimensional center, they understand perfectly well that we are talking about the linear space of the edge of the table, the center of which is in a completely different place.
And if in the Universe we can find countless three-dimensional coordinates of a single scale center, it is only evidence that the scale axis is the fourth spatial dimension. Therefore, in the fourth dimension, the size of 50 microns is unique, and in projections on three-dimensional slices of our world we find it in infinite manifestation.
SO, THE S-CENTER OF THE UNIVERSE (SCU) IS NOT A CENTER IN THREE-DIMENSIONAL SPACE, IT IS A CENTER IN FOUR-DIMENSIONAL SPACE OF THE UNIVERSE.
However, in order to prove it sufficiently, it would require a separate book, which is currently being written by the author 3. Here we will only note in the most general way that the space of our world is certainly not three-dimensional, but multidimensional, although our knowledge of it is limited so far to only three dimensions.
All modern science (physics, chemistry, astronomy, etc.) is the science of a three-dimensional slice of the Universe, of a world in which the laws of three-dimensional space mainly work. In the third millennium, mankind will have to make a step towards understanding the four-dimensional structure of the world4.
Can we now, on the threshold of these tremendous changes, immediately understand and imagine what it is — the fourth dimension of space?
It should be said that this question was asked at least 120 years ago.
FLATLAND
“…For the first acquaintance with the four-dimensional world we find the method of analogy more suitable. Based on the visual geometric ideas about the dimensionality of geometric figures, we can make a gradual ascent on the scale of dimensions and pass from one-dimensional figures to two-dimensional, from two-dimensional to three-dimensional and, finally, to make a decisive step: to take advantage of the remarkable regularities and pass to the consideration of four-dimensional figures”.
All references will be cited from the cited book by E. Abbott with page numbers in brackets E. Abbott’s book Flatlandia 5, first published in 1880, is a truly epochal event in the science of space.
In a very popular and witty way, the author managed to show how conventional all our ideas about the three-dimensionality of space are. For this purpose, he invented a whole world on the plane, in which creatures were represented by polygons, segments, circles.
These beings lived by their own rules, distinguished each other by the rate of change of brightness when moving relative to each other, and so on. They had families, children, homes, their own two-dimensional science, which logically explained why the world was organized in such a two-dimensional way.
But one day, one of the heroes of this world had an unusual adventure.
“It was the last day of 1999 AD. The sound of the rain had long ago heralded the coming of night. I sat in my wife’s company, pondering the events of the past and trying to foresee what the coming year, the coming century, the coming millennium would bring.” (С. 83)
It is worth noting the date that E. Abbott chose, for it was still 120 years away at the time of publication of his book.
And at that moment a stranger suddenly appeared in the room. “What was our horror when, right in front of us, we saw… I thought it was a circle. I thought it was a Circle, but the mysterious shape before my eyes was changing its size in a different way from that of Circles or any of the regular shapes I knew.
After some time Abbott reveals the secret of the strange Circle’s behavior and it becomes clear that Flatland was visited by a Sphere (see Fig. 2.53), which, passing through the plane of this world, changed the size of its cross-section. Naturally, the flat inhabitants of Flatland could only see the Circle, but its properties were unlikely to them - it could increase in size and decrease in size very quickly, appear “out of nothing” and disappear.
It’s “nothing and nowhere” was a third dimension that the flatlanders didn’t even know about.
Fig. 2.53. The path of a three-dimensional sphere through the flat world of Flatland. You can see how the circle on the plane first grows, then shrinks and disappears
What follows is a very sharpen intelligent dialog in which The Sphere tries in vain to vol to make it clear to the hero that she’s a three-dimension. At first, the conversation is absurd. It is only after much effort that she manages to say something sensible:
Stranger. I come to you from the third dimension. It extends upward and downward.
I. Your ladyship apparently meant to say north and south?
Stranger. Not at all! When I spoke of the third dimension, I meant the direction you can’t look into because you don’t have eyes on the side.
I. I beg your lordship’s pardon, but a quick glance is enough for your grace to see that where my two sides meet I have a great eye.
Stranger. I don’t disagree, but in order for you to look into Space, you need to have an eye that is not on the perimeter, but on the side: the place that you would rather be in we would call our inside. We in Tridimentia call it our side.
I. To have an eye in your gut! An eye in your own gut! Your Grace is joking.
Stranger. I am not in the mood for joking. I tell you that I come from Space, or, since you do not understand what Space means, from the Land of Three Dimensions, from where, until a short time ago, I used to gaze upon your Plane, which you call true Space. From this vantage point, I could easily look inside any object that you call three-dimensional (i.e., “bounded on four sides”): your houses, your temples, your chests and safes, even your entrails and stomachs. Everything was open to my sight!
I . …I must confess, your grace, that I have not understood a word of what you are saying…“ (С. 89-91)
After demonstrating its ability to penetrate rooms, closets, and other objects that are closed on the plane but open in volume, the Sphere did not convince the hero that the three-dimensional world was real. It finally had to pull him into three-dimensional space and show him his entire two-dimensional world from above.
What he saw finally opened our hero’s eyes. This is the climax for which the book was written:
I. But after taking me to the Land of Three Dimensions, your lordship showed me the insides of my compatriots in the Land of Two Dimensions.
What could be easier than to take my humble servant on a second journey, to the blessed region of the Fourth Dimension, whence I could cast my eyes with his lordship to the Land of Three Dimensions and see all that is hidden within any three-dimensional house, comprehend the mysteries of the three-dimensional earth,
to know the treasures of the mines and mines of the Three Dimensions and the insides of any three-dimensional living creature…
Sphere. But where is this Land of Four Dimensions?
I. I don’t know, but my honorable mentor should know.
Sphere. I don’t know anything. There is no such country. The very idea that it exists is meaningless.“ (С. 109)
It turned out that the analogy expanded the consciousness of the two-dimensional hero, and he realized that other N-dimensional worlds were possible. But the Sphere could not imagine it, because its consciousness was only reduced one dimension lower in the course of events.
Undoubtedly, the problem of TRANSITION TO FOUR-DIMENSIONAL VISION is very difficult for our standard three-dimensionally organized consciousness. If we accept the author’s version that the fourth dimension is the scale axis, then any movement along the S-axis will change the dimensions of the system.
Then it is clear that all pulsations (contractions - expansions) are purely four-dimensional movements. Our heart is the most four-dimensional organ! Moreover, ball lightnings are also four-dimensional, because they have the ability to appear “from nothing” and disappear “nowhere”.
It is equally obvious that all UFO stories are encounters with “traveling” objects in four-dimensional space, for which our world is just one of the parallel worlds.
AND OUR WORLD IS ACTUALLY MORE FOUR-DIMENSIONAL THAN THREE-DIMENSIONAL.
Naturally, the lack of understanding of the laws of structural organization of matter along the fourth dimension is compensated by mysticism and other occult explanations.
In such a new issue as the expansion of consciousness to four dimensions, mankind will certainly have to deal with it for many years to come. In the meantime, we appeal to analogies again and we’re looking more at projections of the fourth dimension onto traditional models of our world.

Maurice Escher’s painting “Reptiles” illustrates the transition from a two-dimensional world to a three-dimensional world and back
At the same time, the S-AXIS is by no means the only projection. We can talk about the hierarchical structure of the Universe, about the spiritual vector, and about many dimensions that do not fit into the three-dimensional model of the world.
As for the SCU, it is certain that many more unique features of this point on the scale axis of the Universe will be discovered in the future. It is important for us to draw a new conclusion here, in line with the modern paradigm: That the human being, as a representative of the biosphere, is not a random occurrence in the Universe but a highly lawful and central phenomenon on the S-axis.
It is true that in the same center there is room for a great variety of other systems, for this center provides the universal information for all living things on earth.
Therefore, the question arises further, WHY, from the point of view of the considered scale model of the world, HUMAN BEINGS ARE DIFFERENT FROM OTHER LIVING BEINGS?
-
Kazimirovsky E. S. We Live in the Sun’s Corona. Moscow: Nauka, 1983. P. 58. ↩
-
Kazimirovsky E. S. We Live in the Sun’s Corona. Moscow: Nauka, 1983. P. 59. ↩
-
Sukhonos S. I. The Fourth (Scale) Dimension of the Universe. (Manuscript). ↩
-
Sukhonos S. I. On the Threshold of a Four-Dimensional Civilization // Integral Knowledge. Logos of the Universe. First Issue. Moscow: White Alves, 1999. P. 5–32. ↩
-
Abbott E. Flatland, Burger D. Sphereland. Moscow: Mir, 1976. ↩
Evolution of life in the S-hierarchy of the Universe
“A new command I give you: Love one another. As I have loved you, so you must love one another.”
John 13:34
The presentation of the results of the investigation of scale symmetry is in general finished, dear reader. Only small fragments, which, in the author’s opinion, have not yet “matured” into a systematic presentation. And yet another rather extensive part of the book awaits you. When the book was conceived, the writing of this part was not planned, and yet it appeared. Why? I was led to the following points of principle.
Firstly, it is obvious that there is a clear worldview contradiction between the laws of harmonious structure and large-scale integrity of the Universe described above, on the one hand, and the imperfection of the social structure of mankind, on the other.
The question arises: is mankind governed by universal harmonious laws? Maybe, besides the laws of harmony in the Universe there are also the laws of disharmony, which the author failed to reveal? And, maybe, in the human community are dominated not so much by the laws of harmony, as by these unidentified laws of disharmony? In other words, maybe the social world is some “untidy bear corner” of the Universe?
Second, the conclusion about the scale-central position of the cell in the Universe obviously leads to an explicit world view to a hypothetical distortion. It turns out that there is nothing more central and important than a cell in the Universe (even taking into account the hypothetical “grain of the world spirit”). The human being is shifted \(10^{15}\) orders of magnitude to the right from the scale center, and the community of people — even further away.
Throughout the process of writing and designing this book, the importance of the IAB in terms of scale symmetry remained undeniably important to me. However, I realized that prioritizing ICH in daily human practice can lead to unbridled egoism or fetishization of one’s hereditary self.
Thirdly, the question previously posed by biologists surfaced with new acuteness: why did the Biosphere need to create the world of multicellular organisms and man in particular? After all, for non-specialists only, a cell is a small drop of something. Cytologists know very well that a cell is a magnificent creation of nature with a complex internal structure and well-adjusted processes of vital activity at all levels of organization. And, by the way, until now biologists have not given an answer as to why nature has not gone the way of increasing the cell to centimeter size. Evolution of life in the large-scale hierarchy of the Universe and meter-sized cells, but launched the mechanism of cell fragmentation and the creation of multicellular systems. After all, biology does not see any particularly fundamental obstacles to the growth of cells to much larger sizes. And in general it is not clear why it was necessary for the nature, which created a magnificent cellular world, which, besides, is very close to such an important for the Universe scale, as ICBM, to go to all lengths and build organisms from cells. After all, many hundreds of millions of years only single-celled organisms lived in the Biosphere. What universal reason drove the unicellulars into the “anthill” of multicellular systems, where the number of cells reaches, for example, in a human being — the value of \(10^{15}\)? And what force then drove multicellulars into flocks, herds and biocenoses? Man was torn out of the integral and harmonious world of communal life, in which he lived for at least hundreds of thousands of years, and thrown into the “anthill” of big cities and the rigid system of giant empires?
These and similar questions had been bothering me for many years. It is not that I did not know traditional answers to them from biologists and philosophers; the problem was another: how to find a common answer to them within the framework of the model I had built. It turned out that either the laws of scale symmetry in the Universe are violated, or its scale boundaries are defined incorrectly, or there is no special place for a human being in the Universe. It is provided for a cell, but not for a human being. Thinking over all possible variants of answers to these questions for many years, I finally came to the following conclusion.
I think that there is a SCALE WIND OF CHANGES “blowing” in the Universe. And it “blows” mainly from left to right, along the S-axis, i.e. from the microcosm to the macrocosm. Therefore, the issues of scale equilibrium, stability and symmetry should be considered with this factor in mind. I once thought of an image that illustrates this idea quite well. Suppose we are conducting a simple experiment in a closed chamber to determine the most stable position of a coin on a grid. We invite an outside observer and ask him to give the coin the most stable position. The observer, of course, will put the coin flat, it will not occur to him to put it on the edge. Indeed, in the case of placing the coin on the edge, a slight oscillation of the chamber will cause it to fall, while in the lying position the coin will remain lying. Now let us slightly change the conditions of the experiment without telling the observer anything about it. Let us create a powerful air flow through the grating from bottom to top. Then the coin laid flat will tumble in this air flow, because it will be in an unstable position. A coin placed on the edge, on the other hand, will be unexpectedly as stable as possible. Its sides will be blown by the upward currents with minimum resistance.
An independent observer, whom we did not warn about the fan being on and who has no way to feel the airflow, will be extremely surprised by what he sees. The picture will seem absurd to him. Contrary to common sense The coin standing on the edge will not fall down when the camera vibrates and shakes. Anyone who studies scale symmetry may find himself in the same astonishment. The author himself was perplexed for a long time. If we do not introduce the notion of scale symmetry in the winds of change, much of the panorama of large-scale processes will seem illogical, strange and even absurd. In particular, one can make a wrong conclusion about a very unstable and random position of the Biosphere in the Universe. One can try to adopt some more stable position and at the same time f “lie across” the Universal flow of changes.
For example, if one does not consider the pressure of the wind of change from left to right, one can put one’s heir-at-law at the center of the universe The first gust of the universal wind will make this position very unstable. But at the first gust of the universal wind, this position will be very unstable, and you may be “tumbled” through life…
All this, the reader may say, is literary imagery. And where are the facts confirming the existence of this vector of evolution shifted to the right along the S-AXIS? Alas, the reader is right. There are almost no facts. There is mainly an intuitive vision of some phenomenon. It can be called S-EVOLUTION, which creates a constant pressure for the shift of all development processes in the Universe towards larger scales. I, as the author of this book, do not have sufficient facts and arguments to describe S-EVOLUTION in as much detail as S-SYMMETRY or S-DYNAMICS. I have therefore found myself placed before a choice. I could be satisfied with the presentation of the laws of scale symmetry and stop where the Evolution of life in the large-scale hierarchy of the Universe 5 second part of the book ends, or I could go on to speculate on this complex and unexplored topic. I repent, at first I chose the first option, which was much safer from the point of view of possible criticism and attacks by opponents. However, when, after several presentations at conferences, I saw where the worldview of many listeners was turning, I came to the conviction that it was better to try to speak, even if not quite accurately, fully and correctly, about S-EVOLUTION than to remain silent about it at all.
This is how the following structure of the third part came about. At its beginning, very little systematic argument is given for the existence of a wind of change. Then these grounds, which are half observable, half postulated, are taken as axiomatic. Evolution of life in the large-scale hierarchy of the Universe From the axiom logical corollaries are made and some general principles of S-Evolution are constructed. Then I tried to find the correspondence of these consequences in the history of world culture — in its philosophical and religious strata. It is in these, and not in the scientific, strata, because they are more mature in outlook, than the scientific stratum of understanding the world, because once upon a time all science came from religion and philosophy.
Naturally, this approach has often led me very far away from the conclusions and schemes presented in the first two parts. It has led me into the realm of personal worldview perceptions and predilections. Perhaps, somewhere these perceptions will seem insufficiently mature or contradictory to the reader. The point is that I, as an author, did not set myself the task of giving my own holistic worldview. The task was much more local: to find at least an associative connection of laws and provisions long known in world culture with the previously stated idea of S-Evolution.
If one wonders why the author has not attempted to give his holistic vision, the answer is simple. Because it is still maturing, it has not yet taken final shape, and many of its areas look raw and tentative. May the Lord God therefore forgive me for all my possible errors in this final part of the book!
Directionality of evolution in S-space
All of the data collected in cosmology suggests that The Universe is continuously evolving. All the data collected in biology show that the Biosphere is continuously evolving as well. In the cosmological model of the expanding Universe there is a natural sequence of birth and development of its subsystems. First, the world of elementary particles was formed, then the simplest atoms appeared, and further development proceeded on the scales of stars and galaxies. After the completion of this basic first epoch of structure formation the second epoch followed. During this period new varieties began to be added to the main representatives of each class of systems as a result of differentiation and synthesis. This was most clearly manifested in the process of chemical evolution of the Universe, as a result of which the diversity of its atomic composition was growing. At the same time, both at the first and at the second stage, the vector of evolution in general was directed towards the increase of sizes, on the S-axis - to the right.
We can PROPOSE that the evolution of the Biosphere has repeated the path of the evolution of the Universe (certainly in general systemic features). The fact that the first inhabitants of the Earth were unicellular leads us to this assumption, and it took time for multicellulars to appear, which also took quite a long time to evolve to their current forms. Without going into details, in the most general terms we can say that the evolution of biosystems on the Earth went from smaller to larger sizes, and it can be divided into three major stages.
Stage one. Evolution of unicellular organisms.
Stage two. Evolution of multicellular organisms.
Stage three. Evolution of population systems.
Most likely, the last stage has only just begun. The author believes that social populations are the most complex of all populations. Therefore, the third stage can also be called a stage of social evolution. On the S-Axis, each of these three stages can be associated with a certain interval of 5 orders of magnitude each. Each interval can be represented by its scale center - the focus of evolution. For unicellular organisms, the focus of evolution is located in the SCU, for multicellular organisms - in the point (+2), for population forms - in the point (+7) (Fig. 3.1).
PROPOSED that each of the focuses characterizes the center of maximum activity of evolutionary processes at each of the three stages highlighted above.
BEFORE GOING FURTHER, LET’S MAKE A FREEWAY TO STEP OUT.
Let us consider two similar processes: birth and creation. Despite their similarity, there is a fundamental difference between them. Birth is a process of reappearance (reproduction) of systems that have already existed before. Therefore, although each new object is born, but in its key properties, it is a new object. It repeats a certain general type.
Birth is a universal and omnipresent phenomenon for the Universe. New stars, new organisms, new galaxies, new particles are born. This process takes place on all floors of the Universe, at every point of the S-axis. There is nothing eternal in the Universe, everything has its end and its beginning - birth.
Fig. 3.1. The “foci” of Biosphere evolution on the S-Axis.
Creation is the occurrence of any type of object for the first time. If cosmologists are to be believed, there were times when the Universe did not have not only galaxies and stars as types of systems in general, there were not even atoms and elementary particles. Consequently, creation, apparently, is inherent to all floors of the Universe, but in comparison with birth creation is always an act, as after creation of the first stars and galaxies their further appearance in the Universe already passes into the category of birth phenomena. Indeed, it is possible to create something practically only once, definitively. Certainly, when we consider creation in comparison with the subsequent countless repetitions of birth, we can call it an act. However, if this act is examined separately, as an independent phenomenon, then creation manifests itself as a complex process with many internal stages, each of which requires a separate study. In what follows, we will refer to creation as an act or a process depending on the context.
So, if we compare creation and birth (repeated reproduction) in the field of human activity, we can unequivocally state that creation is a more complex process than birth. After all, one can only create something fundamentally new, i.e. something that has not existed in the Universe before.
This unequal value of the two phenomena is also reflected, incidentally, in religious consciousness .
The author is a believer, although he grew up , like most of his peers in the Soviet era, as an atheist. In recent times, many scientists have abandoned theism and are trying to find a scientific basis for the existence of God . How successful these attempts are I cannot judge here, but sometimes it is obvious that there is a “mixture of styles”. I can’t judge here, but sometimes there’s an apparent “cosynthesis of styles “- In purely scientific , even experimental work, there are discussions of the Creator . Often they are replaced by a lack of understanding of the device being studied by the author of this work , of some part of the universe . They only show that their author is a believer in the reasonableness of the universe. is a believer in the reasonableness of this world . In dealing with a subject as complex as the evolution of the universe , I would like to state my position at once : I believe that the world was created by the Almighty. I see the task of science as constantly uncovering the design The Creator and the laws that He established in the Universe. Laws are only laws for science when arbitrariness is excluded from them and strict logic is established, which is automatically fulfilled in nature within the limits of tolerance. Therefore, if we do not understand the world order in some way , then, from my point of view , this is a challenge for us, an active call to knowledge. Knowledge includes at the same time the accumulation of facts , and the strict logical justification , and the relationship of the established laws with previous knowledge . In my further reflections on the evolution of the biosphere and the universe, I will specifically avoid “references” to the Creator wherever possible, to avoid mentioning his name . I believe that if we cannot discover the law of evolution of any part of the universe, then I believe that if we cannot discover the law of evolution of any part of the universe, then we cannot discover the law of evolution of any part of the universe. of any part of the universe, then humanly we can shake our hands and say, “This is how the Creator designed everything”. However, any scientist , if he wants to be within the framework of scientific methods (their legitimacy and breadth are not the subject of discussion in this work ), cannot make the process of cognition easier for himself by reasoning on the themes of evolution and reference to the evolution of the Almighty. of the Almighty. For all of the above, by using the term “creation”, I will mean that the universe has been created with such informational , logical and physical prerequisites that a new species of systems is possible. This is what I will call the “act of creation”.
God is the Father, but God is first and foremost Creator, for He created the world, along with all the types of objects that fill it. Obviously, the role of the Creator in religious teaching is given more importance than that of the Father. This, from our point of view, reflects the general idea of the correlation in the universe of the significance of the phenomena in question.
If we now return to natural science, then, comparing man with animals, we can find a fundamental difference in the fact that man differs from animals in the ability to create. After all, any animal is capable of replicating all those skills and instincts that are inherent in it from nature. Moreover, the classical Marxist division of animals and man according to the ability to labor does not stand up to criticism. After all, many animals labor. For example, ants, bees, birds that build nests, a bear that builds a den. All this labor, but the labor is “instinctive”, stereotypical, the labor of repetition. And only man is capable of becoming the creator of new objects and phenomena. Only man creates what was not there before him on the Earth. And it is this ability to create that, in my opinion, distinguishes man from the animal world.
Therefore, one can afford to doubt the classical Marxist formula that “labor created man”. It was creativity, or more broadly, labor, that separated man from the animal world.
Any creative person, whether writer, scientist, composer or inventor, knows how much more complex and energetically costly the act of creation is than the act of subsequent repetition, than the act of birth. If you think deeply about the creative activity of mankind, you will be struck by its significance even more. After all, by creating even the most primitive tools of labor and household items, man created something that had never existed before in the Universe (provided that the Earth is the only inhabited planet), in any case, something that had never existed on Earth.
Therefore, in vain some historians laugh at the natives who exchange their gold for glass shards. After all, gold existed before, it was even before the appearance of man on Earth, it was found both by the ancestors of the natives and their ancestors’ ancestors. Gold is an object of nature, an ordinary object that has existed for a long time. Glass shards, on the other hand, are objects that the natives see for the first time. They are objects that have been created by man. They are not just shards of glass, they are shards of the great civilizational activity of mankind. The natives justly worship them, for these pieces of glass carry the charge of the great creative tension of the whole civilization. They are a symbol of man’s difference from the rest of nature. They are a symbol of man’s distinction of his fundamental difference from the rest of nature.
Analysis of the foreseeable history of the Biosphere shows that no new species of animals, birds or plants have appeared in the last thousands of years. Some species have disappeared, some continue to disappear, but nature has not created anything new in the memory of people. All her creative activity belongs to the distant past.
The author anticipates that some biologists will dislike this statement because of its categorical nature .
Therefore, we can almost confidently assert: in the last thousands of years, the process of creativity has been most vigorously and diversely taking place on Earth precisely in the human being. of civilization.
They may say that we are not good Directionality of evolution in scale space. We do not know how and at what rate the process of creation of all currently existing or pre-existing living systems took place in former times. It may have been as rapid as the present process of human creation. But we know that in the part of the Universe visible to us at present the process of creation is most active and intensive in a very narrow layer of matter - in human society. Note that the process of birth has not changed its intensity: as before, animals, birds, fish, insects are born, new stars and galaxies are born. Here the question may arise about the correlation of the quality of the creative product from nature. And uneducated natives feel it better than many modern scientific “sages” realize it. Reflecting on the role of creativity in the history of human civilization we come close to the mystery of the question of the role and place of man in the Universe, Biosphere and civilization. Much of what mankind has created in its history is nothing compared to any kind of animal, less perfect and sometimes harmful to the Biosphere. However, chickens are counted in the fall. It is necessary to wait, when mankind will pass the way of creation at least in one million years. After all, the Biosphere has at least three billion years at its disposal, and the Universe has more than deWe know the natural world of the planet to be so definite . Let us assume that biologists have not noticed the emergence. So what ? Does that change the principle of the relationship between the creative flow of humanity and the Biosphere ( without humans )? hundred and seventy billion. As for harmfulness, let us remember about locusts, which destroy all vegetation on their way and other similar examples. Let’s think about the biospheric “catastrophes” repeatedly occurring on Earth that at intervals of tens of millions of years have renewed up to half of the species composition of the living world. The last update led to the extinction of dinosaurs.
By the way, contrary to most of the versions of astronomers and science-fictionists , biological excavations convincingly testify to the fact that the dinosaurs “disappeared” for hundreds or thousands ( if not millions ) of years
By the way, if there was an animal protection society in those days, who would it have filed a complaint against? After all, only in fantasy novels 60 million years ago on the Earth were running around with small armsthey’re either human ancestors or aliens.
Science has no facts about interference in the course of evolution of the Biosphere by any humanoid beings. If such facts appear, it would be very interesting for the author to familiarize will be established. I think it is more likely that system-wide laws will be established to control the evolution of the Biosphere, which will reveal the influence on this evolution of the processes going on in the whole Universe (and not in an experimental flask of aliens).
Thus, the history of the Biosphere shows that along with the appearance of new species in it, there was also the disappearance of old species. It is true that some of the most ancient species have survived on Earth to this day. Therefore, calls to keep everything on Earth intact are idealistic, unscientific, unrealistic and unpromising. The author does not call for mindless reorganization of the Earth’s surface. This is the other extreme.
I am convinced that mankind needs to create, but in such a way as not to destroy itself and its planet. At the same time not to fall into the extreme of museum conservation of the current state of the Biosphere. For such an extreme ruins the creativity of human civilization in its infancy. Figuratively speaking, it leads to the dominance of the phenomenon of birth over the phenomenon of creation and, consequently, to the relegation of the human civilization to the status of a “nucleus”. of humanity to the level of animal existence.
The author is not at all going to give here recipes on how to organize the creativity of civilization itself. All these considerations are necessary only for another purpose - to show more clearly how important the phenomenon of creation is for mankind in principle.
The juxtaposition of the phenomenon of creation and birth clearly suggests that the phenomenon of creation is far more significant than the phenomenon of birth. the birth of a new birth. If only because the first one happens only once, and also because it is always more difficult to create a new one than to repeat a previously created one. Therefore, in what follows we will build on the idea that creation is the most important and most interesting thing to us in nature.
Creation precedes birth - and it follows automatically that once the process of birth enters its stable phase of repetition of one form, creation over this particular form practically comes to naught.
The example of human civilization shows that, having created one layer of existence, people do not stop and move on to the next one. There is every reason to believe that the process of creation in the Universe never stops.
This raises the question of the “place” of the actual creation in the parametric space of being of the Universe.
Suppose that having “opened” the microcosm with all its baryons, leptons and resonances, the Universe left it in a perfect harmonious form and moved to the macro- and megaworld. In this case we can talk about moving the “focus of concentration of creation” along the S-axis. Of course, this focus can move not only along the scale dimension; most likely, it “wanders” according to a complex system law in the multidimensional parametric space of the Universe. Since we investigate in this paper the M-dimension, we will further emphasize the problem of moving the “focus of creation” along the S-axis. At the same time, at the first stage we will simplify our task to the limit and will not reflect on the scale “width” of the hypothetical “focus of creation”, to what extent its scale edges are blurred, etc. We will speculate in the most general terms about trends, priorities, and preferences, but terminologically we will reduce everything to a simple movement along the S-axis of a certain point of concentration of creation.
Simplifying our task, we will further rely on the PROPOSITION that in the known universe there is only one single large-scale focus of the creation process at the present time, the creative tension in this focus is the highest and it is to this focus that the creative tension is directed. all the subtle threads of the information flows of the universe.
At the same time I would like to emphasize again the words “in the known Universe”. I do not at all assert that the parametric focus of the Universal creation is one. Moreover, it is possible that even on one parameter, the S-axis, there are currently several of them. It is only a question of the fact that, investigating many different processes in their evolutionary unfolding, I purely intuitively came to the PROPOSITION that on the S-Axis there is for each time of development its own point of special limit evolutionary tension. We will analyze the consequences of this assumption in this part of the book. Based on this assumption, we can assume that S-AXIS MOTIVATES THE WAVE OF CREATION. And it moves from left to right, from the depths of matter to its upper floors.
This thesis is difficult to prove, relying on the cosmological database. If we go down to the Earth, then thanks to excavations, the chronicle of the evolution of forms of living beings will appear before us “documented”.
We know that there were once no dinosaurs on Earth, for example. Then the species was created in the Biosphere, and dinosaurs were repeated for many millions of years in the process of many births. And although the dinosaurs were modified, they still remained exactly dinosaurs. Then this form disappeared, but a new form was created - mammals. Similarly, all species of living beings now existing on the Earth were once created for the first time.
So, if cosmologists assume that the Universe once had a creation of its basic systems: particles, atoms, stars and galaxies, biologists know for sure that there was a creation process on Earth. Moreover, unlike cosmologists, they can determine its sequence quite correctly.
It is very important to emphasize once again that scientific data undeniably testify that evolution on Earth proceeded in major stages - first all forms of unicellulars were developed, then multicellulars. In this connection, a curious question arises: has the process of creation in general ended on the scale of unicellular organisms after the Biosphere began an active process of creation at the multicellular scale?
After all, if we go back to the Universe, it is likely that neither new types of elementary particles nor new types of atoms are being created anymore. The stage of creation at this level of scale for the Universeof the Universe has remained far in the past. Figuratively speaking, on many floors of the universal hierarchy an ideal systemic order has been put in place, construction debris has been removed, all the rules of interaction have been prescribed, and the laws of nature work there clearly and unambiguously - “according to formulas”.
We can quite understand the logic of these events, because man is no longer returning to many layers of being. For example, the process of domestication of animals, breeding of the main varieties of plants useful for humans, etc. has long since ended. Figuratively speaking, no one is inventing the wheel today. New forms and types of wheels may appear in response to new demands and new technological possibilities, but these are slight mutations within the limits of the once created “wheel principle”. In any case, the creative tension is many orders of magnitude lower than in the process of attempts to create synthesis reactors.
Similarly, we can put forward the PROPOSITION that in the Biosphere, after the completion of a long period of creation on the single-cell floor, Nature moved on to creation on a higher scale floor, using single-cells already as working material. Undoubtedly, it had to modify many previously created cell forms.
Biologists often observe that many intracellular systems have precursors in single-celled organisms. An analogy to this process in human society can be found, for example, in the steam boiler, originally created for certain purposes, but later put on a steam locomotive, where it changed significantly. The same analogy can be found in the microcosm, where a free electron differs significantly from an electron included in a higher level system - an atom. Based on the data and intuition available to us, the POSTULATE a very important point: in the Biosphere, the wave of creation has long ago passed through the floor of unicellulars and has recently passed through the floor of multicellulars.
POSTULATE THAT THE FOCUS OF CREATION IN THE BIOSPHERE IS CURRENTLY AT THE POPULATION LEVEL OF SCALE.
Why are we so interested in where the focus of creation is? It is because the process of creation not only in the Biosphere, but also in the Universe, is the most complex, the most information-rich and, therefore, the most important process.
It can be assumed that the main “attention” of the Universe is concentrated around this process and all its resources, all subtle energies, all information flows are drawn to it, that is why the process of creation occupies the top line in the system of priorities of the Society, Biosphere and the Universe. There is no need to explain how important it is for humanity as a whole and for each individual to have the right system of harmoniously coordinated societal, biosphere and universal priorities.
Any human being can potentially participate harmoniously in the universal process of creation, otherwise he either hinders it by his own blindness and egoism, or is passive material. That is why it is so important to determine whether there are any focused points on the S-axis around which the most active and most important at this particular stage process of the emergence of new forms takes place. For if we accurately determine these coordinates, we will be able to correctly build the hierarchy of the value system in our daily activities. And then, subordinating secondary values to primary values, we will be able to achieve harmony with the Universe, consistency with the evolutionary process, and precise actualization of ourselves in time. Then the whole world in all its power will come to people’s aid in every step, support them in all external affairs and give them a feeling of soft and harmonious movement in the world. Directionality of evolution in scale space.
So, if we limit the consideration of the question of evolution to the Biosphere, then, to a first approximation, we can PROPOSE that, when the focus of evolution moves along the S-axis, there is an attenuation of evolution in the whole area of the biosphere. of the range from which this focus leaves. If this is so, then on the floors of the large-scale structure of the Biosphere, which have completely finished their evolution, there is nothing principinally new and more complex Nature will not create any more. The evolution of viruses, bacteria, unicellular, fish, plants and animals is over. Therefore, the call for the preservation of all kinds of living organisms is extremely relevant - we have now in the Biosphere a perfect system of organisms, better than which nothing will be created on Earth! So, the completeness of biological evolution leads us to the necessity to recognize that WE LIVE IN THE BEST OF WORLDS… (excluding the social one).
In other words, Nature can no longer create a more perfect cat, dog, tiger, elephant, dolphin or butterfly. All species existing on the Earth today are the most perfect creations of Nature in general, as a whole, without regard to time and, perhaps, space. Out of all the potential diversity of forms and structures, Nature has chosen and left the most perfect and the best on the Earth by the time Man appeared.
It is true that the conclusion about the completeness of the Biosphere evolution at first sight contradicts the results of selection work of man himself, who created new varieties of plants and new breeds of animals, but can we say that these varieties are more perfect than their wild ancestors? They are more convenient for man himself, nothing more. None of the artificial species are fixed in the wild. Consequently, they are all secondary results of social evolution, not biological evolution anymore. This is not the evolution of the Biosphere, but its modification under the conditions of civilization development. After all, when a Japanese grows a dwarf pine tree on his window sill, from the point of view of the Biosphere, he only uglifies its beautiful creation. Therefore, while further change in the Biosphere is ongoing, this in no way contradicts the conclusion reached earlier that the evolution of organisms on Earth ended at the moment (stretched, of course, for many thousands of years) of the appearance of man on Earth.
So, we repeat - the focus of creation on the S-axis is in the center of the third area of the protein size range (see Fig. 3.1). It follows from this that the highest tension of the Biosphere evolution has now reached the scale interval of population forms, in its social layer.
It is here that Nature is now creating systems new to the Universe, gradually increasing their complexity, diversity and strengthening their integrity. The latter is achieved through harmonization of relationships within human communities. Based on the assumptions made and the consequences of them, we can PROPOSE THAT NATURE CREATED THE HUMAN BIOLOGICAL SPECIES for the construction of the next huge scale floor of the hierarchical building of the biosphere - from the center floor.
What are the author’s reasons for drawing this conclusion? Very simple.
First, social systems have greater energy power compared to biocenosis.
Second, social systems are much more complexly organized already if only because they include all previous scale levels, and are much more operationally and holistically organized to respond to the challenge of the external environment.
Thirdly, we see that social systems have been rapidly developing for the last at least five thousand years. All this indicates that the focus of evolutionary processes in the Biosphere is not in general - in the third scale interval, but specifically - in its social slice.
Fourth, only social systems are capable of further advancing biological life from Earth to Space, i.e., they are capable of continuing the movement of evolution up the S-axis by creating space civilizations.
To summarize. The majority of observational data available to science on the development and evolution of systems at different scale levels of the Universe testify to the following, that EVOLUTION OF WORLD OBJECTS CONTINUES WITH GROWTH OF SIZE.
We are far from absolutizing this rule . It is possible that in some specific cases evolution is reducing the size of systems , while at the same time compressing or fragmenting them into component parts. However, so far, the author has been unable to find an example of such a character
This rule has both individual, species and system-wide significance. Indeed, the development of any animal occurs from an embryo in the process of its growth. The development of the entire Biosphere, too, occurs as the size of its systems increases.
Therefore, the shift of the entire protein interval along the S-axis to the right by 5 orders of magnitude is far from accidental. It testifies that life as a subsystem of the Universe also develops in general in the direction of size increase.
It is possible that in this movement life is ahead of the entire Universe. After all, according to the model of the expanding Universe, for the last 3.5 billion years (when the Biosphere was developing) the boundary of the Metagalaxy has moved along the S-axis only half an order to the right, from the size of \(10^{28}\) cm to the size of \(10^{28.5}\) cm. Life, however, having started its development from primordial cells (\(10^{-3}\) cm), during the same time interval shifted its center of evolution to the meter size of organisms (\(10^{2}\) cm), i.e. 5 orders to the right, and subsequently by another 5 orders M — to the area of population forms (\(10^{7}\) cm). At the same time, the focus of evolutionary tension shifted to the right along the S-axis.
So, concluding the introduction, let us outline the initial positions. It is very likely that the evolution of life on Earth can be correctly divided into three separate large stages: unicellular, multicellular, and population forms. Further, we can make a very bold PROPOSITION that the “focus of evolution” moves along the S-axis from left to right.
For the Biosphere, this means: at the present moment, the “focus of evolution” is concentrated on the third site of the protein range, while on the two preceding ones, evolution as a whole has already been completed.
Another PROPOSAL: at present, the maximum tension of the evolutionary process in the Biosphere, which can be represented as one of the parametric layers of the third section of the protein range, is concentrated in the field of social structures.
Let us now consider how these assumptions about the stepwise shift of the focus of evolution along the S-axis can be reconciled with the central position of the cell in the scale space of the Universe and of man in the scale space of the Biosphere. For this purpose, we will analyze each of the three parts of the protein range, or each of the three stages of the evolution of life on Earth, from the position of the scale regularities revealed in the previous parts of the work. At the same time, we will compare these regularities with the assumption of the central focus of evolutionary tension in the social range of scales.
Stage One. Life at the S-center of the Universe
The first stage in the evolution of life on Earth, where all single-celled organisms were formed, took at least two billion years. Biologists cannot give a precise answer as to how life originated, what was the stimulus for its emergence, and what the first organisms were like. We have already noted that the theory of random origin of complex protein systems cannot withstand any criticism.
With the discovery of the fundamental role of SCU in the life activity of the Universe, there appear additional, very significant arguments in favor of the nonrandom origin of life. After all, most likely, the SCU is the node of all energy and information processes in the Universe. Therefore, the fact that the average sizes of all cells were equal to the value of the IAB range is hardly accidental. It can be assumed that information comes from the whole Universe and is concentrated on the scales of 10… 100 microns, and this is the most important factor of connection of biological cells with the whole Cosmos. Moreover, let us remind that according to the model of scale-harmonic oscillations at the first overtone the Universe generates some “immaterial” (etheric) structures, the sizes of which exactly correspond to the SCU. Within the framework of this model, the Universe space is literally “packed” with such “grains”, which consist only of maximon. There are no elementary particles or photons in them, so they are not registered by modern instruments. Since maximon are 30.5 orders of magnitude smaller than “grains”, their number in each “grain” can reach an incredibly large value - about a \(10^{90}\) (!).
FREEDOM OF DISCUSSION
Let us consider the consequences of this modeling assumption. If we assume that inside the “grain” maximons are not randomly located, but are combined into some configurations, then we should also assume that each such “grain” can accumulate, store and transmit information. The potential information capacity of such a “grain” will be fantastically large due to the gigantic number of its constituent elements. Preliminary estimates show that the information capacity of a “grain” is comparable to the information capacity of the entire Universe. This conclusion may seem absurd at first sight. How can the information of a part of the Universe be greater than the information of the whole Universe? However, analysis shows that the paradox he validity of this conclusion may well correspond to the real state of affairs. Let us consider it in more detail. In the whole Universe there are about \(10^{78}\) nucleons, the total number of galaxies in the Universe is \(10^{10}\) , stars — about \(10^{20}\) . In one “grain of the world spirit” there can be about \(10^{90}\) maximon. Since the number of elements in the “grain” is much greater than the number of all material elements of the Universe, the potential information capacity of the “grain” exceeds the potential information capacity of the “grain” by orders of magnitude the capacity of the Metagalaxy. If someone were to write down information about the world using the mutual arrangement of stars, galaxies, atoms or nucleons, he could. It would be possible to record on these “carriers” a much smaller amount of information than with a tiny “grain of the world spirit” on the scale of the Universe. Here it is appropriate to remind that in the memory of a small computer today can fit much more information than in a giant library, only due to the use of elements of much smaller sizes than letters and pictures. Therefore, we can say with certainty that the information memory of the “grain of the world spirit” is larger than the information memory of the entire material Universe.
To give an analogy. Mankind has accumulated a huge amount of information throughout its history. Some of it is stored in architectural monuments, some in the infrastructure of cities and states, some in libraries and museums. However, perhaps, its greatest volume is stored in compact and concentrated form in the experience and memory of individual people, conditionally speaking, “in heads”. It is obvious that civilization’s information is the most accessible and mobile when it is in a person’s head.
Continuing the analogy, it can be seen that just as any person studies the world in two ways — firstly, independently, secondly, through the experience of other people (at school — through teachers, then through books, etc.) — it is possible to study the Universe in the same way — firstly, by experimentally “feeling” it and secondly, by obtaining information from the “grains of the world spirit”. The Universe can be studied in the same way — firstly, by experimentally “feeling” it and, secondly, by receiving information from the “grains of the world spirit”. The first way without the second leads to crude materialism. The second way without the first leads to groundless idealism. Only a harmonious combination of these two beginnings, representing the two worlds of the Universe, leads to the optimal development of the individual and society as a whole.
Recall that by matter , we have agreed to understand the objects of the Universe consisting of known elementary particles , such as inclines, electrons, etc. Stage One. Life in the large-scale center of the Universe 26 Certainly, the information “recorded” at the maximon level can be stored in the Universe not only in “grains of the world spirit”, but also in open maximon structures, the sizes of which can be any smaller than 50 microns and any larger. But if there are such structures, their role, most likely, is secondary, because according to our model, the first overtone creates in the Universe extremely stable formations of maximon, and it is quite likely that outside the “grains” maximon are much smaller. Besides, each of the “grains” contains the number of elements (maximon) approximately equal to the number of all “grains of the world spirit” in the Universe. This equality is determined by the median location of a “grain” on the S-axis — 5 0 microns, at dense packing \(10^{90}\) of such “grains” can be placed in the Universe. Therefore, the POTENTIAL information capacity of the Universe when using “grains” as recording elements is approximately the same as the information capacity of a single “grain”.
Certainly, the cumulative information recorded within all “grains of the world spirit” of the Universe is greater than the information recorded within a single “grain”. By analogy, for example, the social consciousness of mankind stores more information than the consciousness of an individual person. However, the “head” of each person is the element of the gigantic structure of public consciousness in which all information is concentrated, stored and processed. So, we can assume that information in the Universe is concentrated in the “grains of the world spirit”, outside the “grains” its volume can be much smaller. It should be noted that this idea has one more attractive aspect. Information recorded in such a compact way is much easier to move from one region of the Universe to another than if it were recorded in a maximon field not structured into “grains”. The fact that the “grains of the world spirit” arisen at the first overtone have extremely high stability in time and resistance to external influences in comparison with any other structure of the Universe (except for the Universe itself and maximons, since they arose during the passage of the main tone) is also of no small importance.
So, a startling PREPARATION is revealed. “Grain”, which is composed of maximon, may turn out to be the main element of the Universe’s “thinking”, HIS GENERAL SELF-CONSTITUTION.
It is very important that theoretically this cell cannot be destroyed by any material processes of the Universe. It cannot be destroyed neither by an atomic explosion, nor even by the explosion of the galactic nucleus. Why? Because the energy of these processes the “grain of the world spirit” floats in the depths of the “Ocean” and all storms, typhoons and tsunamis going on its surface do not have any destructive effect on it. Figuratively speaking, the “grain of the world spirit” floats in the depths of the “Ocean”, and all storms, typhoons and tsunamis on its surface do not have any destructive effect on it, just as chemical reactions with atoms do not destroy the nuclei of atoms themselves or as the process of crushing a rock does not lead to a change in the atomic composition of the rock. Hence, the “grain of the world spirit” may be, in fact, the ETERNAL ELEMENT of the universe. A “grain” is able to accumulate and store a gigantic amount of information due to changes in its internal structure. Practically it is able to “remember” absolutely everything that has happened in the Universe since its birth. And this “grain” has theoretically calculated spatial dimensions, which Nature surprisingly accomplished. I’ve chosen exactly the right way for a living cell to exist! Doesn’t it boggle the mind? Maybe, indeed, each cell of our organism besides its material structure also possesses (unknown for science yet) etheric (maximon) structure, which stores all information about the Universe surrounding us? Maybe our whole life is recorded on this etheric matrix forever?
To verify the above reflections directly by scientific methods, as it seems to the author, is unlikely to be possible in the near future. There are only a few indirect arguments that show that these assumptions are quite probable. These arguments are based on the principle of similarity (or anti similarity) of the two worlds: the material and etheric. According to this principle, everything that we find in the material world can have an analogy in the etheric world. It should be reminded that the cell nucleus (the size of which corresponds to the range of HABs) stores all genetic information of any living being. That information, which a creature has managed to accumulate during its life (so far it has been established only for genetic information), is compactly placed in the germ cell and transferred to the next generation, which then (we can say — all its life) unfolds this program. A lot of things are recorded at the genetic level, about which the life of identical twins. If the etheric world is similar to the material world, then in it, perhaps, the process of unfolding of information compactly packed in the “grain of the world spirit” (according to our assumption, the “grain” is connected with the primary germ cell) and formation of the human soul from it (similarly to form from the germ cell of the human body). Possible, that the reverse stacking of information occurs at the moment of death. Let’s consider one more aspect of the interrelation of life with the CME. Each person radiates all kinds of waves into the Universe space. The maximum power of radiation is in the range of tens of microns — these are thermal, or infrared, waves. Consequently, we all shine in the invisible infrared range with a decent power of several hundred watts, and the curve of intensity of our radiation has an It is written in the Talmud : “ To recognize the invisible , look closely at the visible . It is true that paradigm biology recognizes so far only that the most primitive biology is accumulated and transmitted primitive information at the genetic level. Maybe she’s right. Why record information on a genetic horizon that could be much more effectively recorded on ether , maximon , etc. upper point in the region from 10 to 100 microns. On the other hand, all the planets of the solar system shine in the sky with the maximum intensity of reflected sunlight also in the range from 10 to 100 µm (see Fig. 3.2). However, each planet has its own maximum, and the character of the radiation curve changes significantly depending on the angle of the planet above the horizon at observations from the Earth.
It is interesting that:
- The wavelength of the planets’ own radiation (4-5 μm) corresponds to the size of the sperm head and the size of the chromosomes when unfolded (see Fig. 3.2A);
- The wavelength range of the intrinsic thermal radiation of the planets on the S-axis is one order of magnitude to the left of the HAB range;
- maximum of the radiation of reflected sunlight by the planets is in the Maxis range (see Fig. 3.2A), which is already closer to the scale of the nucleus of the female germ cell, i.e., to the range of SCU;
- Each planet also has its specific coordinate (in the sense of radiation maximum) on the S-axis;
- spectrum radiation bandwidth of each planet, among other things, varies significantly depending on the angle of inclination of the planet’s position with respect to the Earth’s horizon (see Fig. 3.2B).
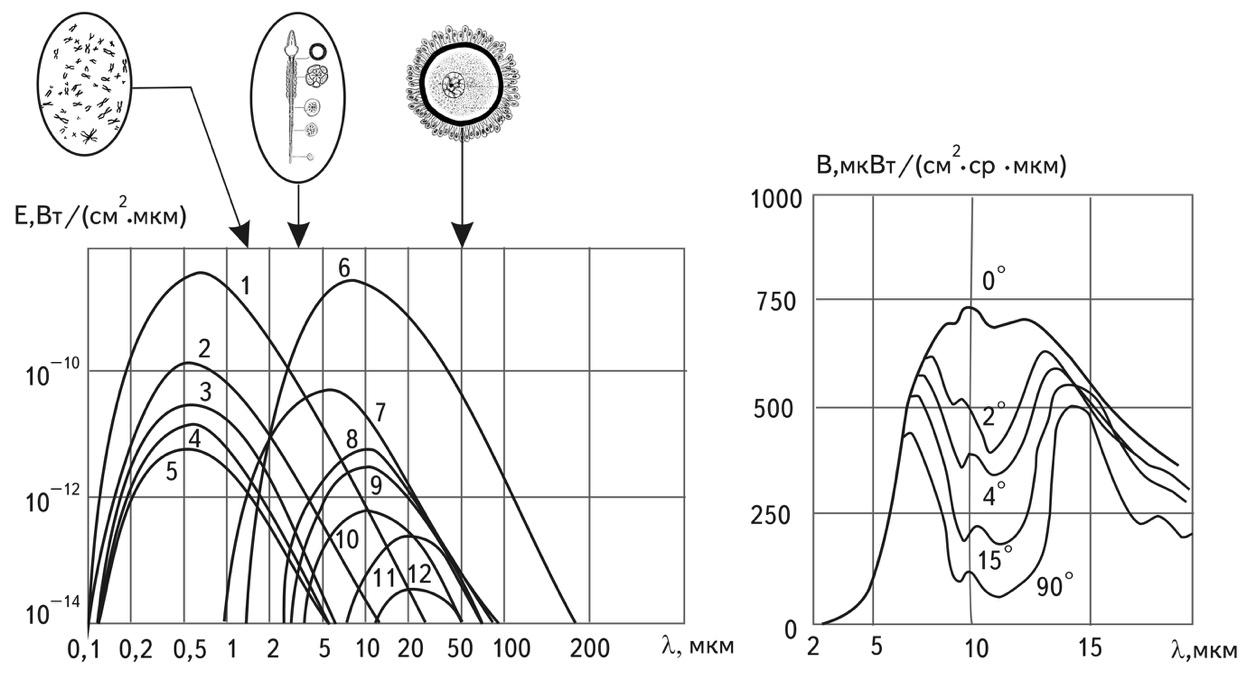
Fig. 3. The radiations of all planets and stars have power maxima that are surprisingly close to the S-Center of the Universe (SCU) on the S-axis.
А. Self-radiation in the upper atmosphere: 1-NightMoon ; 2-Venus ; 3-Mars; 4-Saturn ; 5- Mercury . Solar radiation reflected by the planets : 6-Moon ; 7-Jupiter ; 8-Venus; 9-Mars (opposition); 10- Jupiter (opposition); 11-Saturn( opposition). Stage One. Life in the large-scale center of the Universe 30 Chromosomes, male and female halves of the human cell ( arrows show the size of their nuclei ) are shown above the graph according to their sizes.
B. Spectral energy brightness of the night sky at different viewing angles . The author is grateful to Y . V. Sorokin for the provided data.
Here arises a very unexpected PROPOSITION. What if the light from planets falls on genetic material, on sex cells at the moment of their synthesis and affects genetic heredity?
So, what are we getting?
Each person “departs” in his life journey from the station “Scale Center of the Universe” (range 10-100 microns). At the moment of “departure” he receives information from the entire starry sky in the form of radiations with maximum power in the same wavelength range.
Isn’t this where the possibility of scientific substantiation of astrology opens up? After all, it is at the moment of synthesis of female and male nuclei that the unique genetic set is formed, which, judging by many researches, determines in many respects the “trajectory” of a human being through the life space. For the rest of his life, a human being does not part with the range of ICV: in fact, all his \(10^{15}\) cells have an average size from 10 to 100 microns, and the maximum of his integral luminosity falls within this range.
So, we can confidently assert that the genetic foundation of man (and, consequently, man — as a generic concept, as some time-lasting and changing element of the Biosphere) is closely tied to the MCV, or, in other words, the GENETIC MAN IS IN THE SCALE CENTER OF THE UNIVERSE.
FREEDOM OF DISCUSSION
It can be assumed that the changing nature of the radiation of stars and planets depends on their position in the sky (see Fig. 3.2B) at the moment of conception of a child can have a specific and very concrete effect on its heredity and on its further destiny.
If we use the principle of similarity of two worlds, then at the moment of formation of the genetic matrix of the future human being his etheric matrix should be formed as well. Information can be collected from all expanses of the Universe and concentrated into a “grain of the world spirit”, which is perfect in its size corresponds to the size of two merged material nuclei. And the volume of information, which is transmitted to a human being at the etheric level, can be many orders of magnitude greater than the volume of information, which is transmitted at the level of genes. Moreover, this information is no longer about the life of the human race on Earth, this information is about the life of the entire universe since its birth.
So it is possible that EVERYONE OF US POTENTIALLY KNOWS EVERYTHING ABOUT THE UNIVERSE. The only question is how to read this information, how to translate it from the language of maximon structures into Russian or English. This, apparently, was understood by Egyptian priests of the times of construction of the great pyramids. As it was proved by R. Buvel1, that the Great Pyramid of Cheops has channels located in such a way that at a certain moment the light of selected and extremely important for the Egyptians stars fell into the chamber of the king and queen (see Figure 3.3).
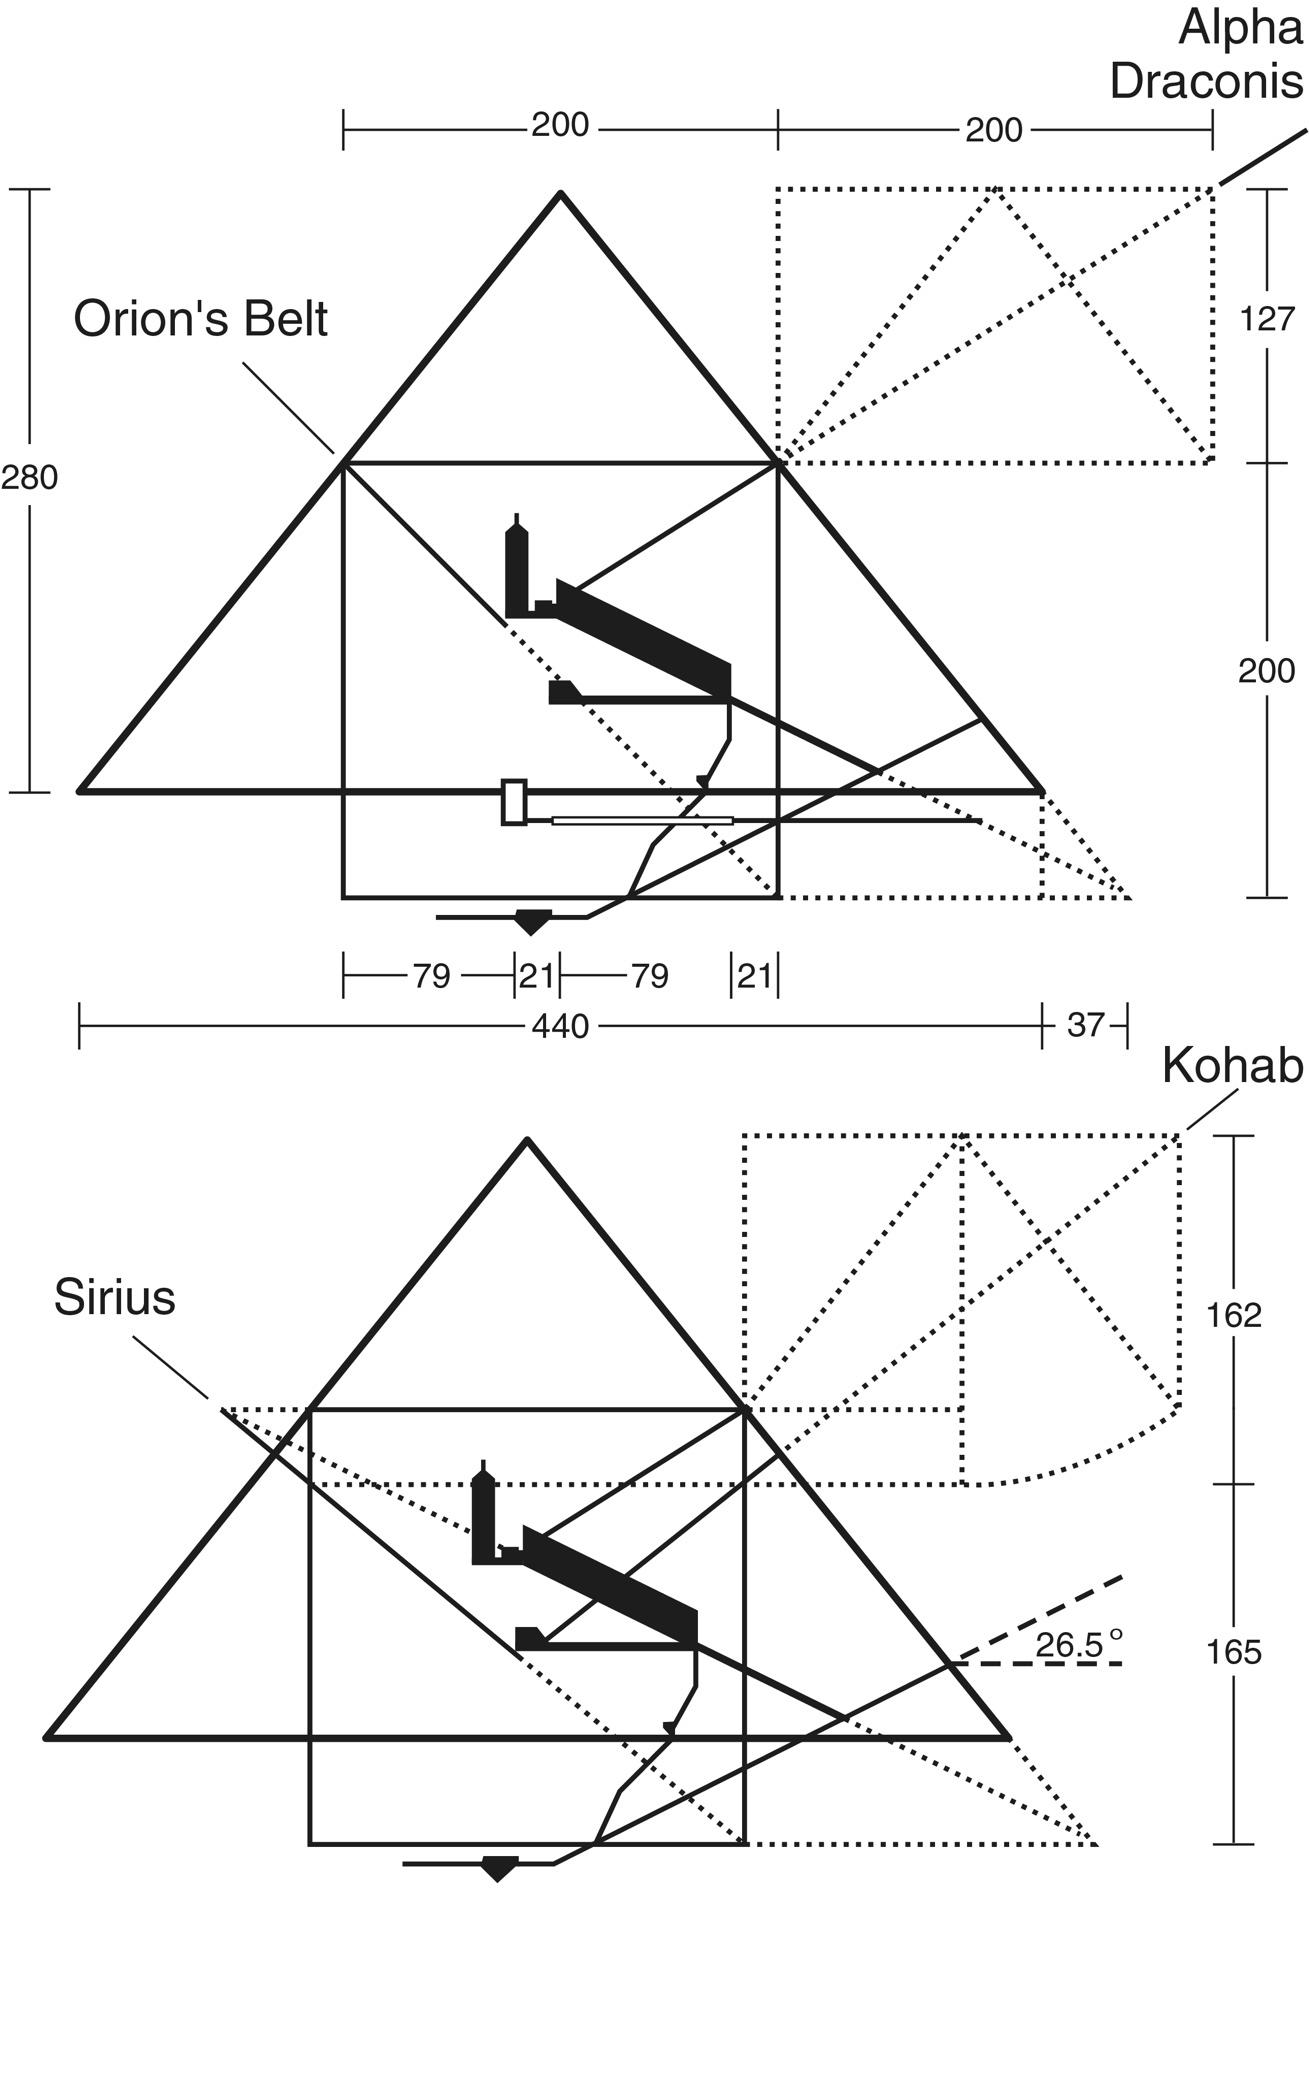
Fig. 3.3 Astrogeometric calculations show the position of shafts and chambers in the Great Pyramid with the angles of maximum star ascent during the period about 2450 BC (according to R. Buvel). The upper chamber of the king was illuminated by the lightof a star from the belt of Orion and Alpha The Dragon. The light from Sirius and Kohab fell into the lower chamber of the queen.
Р.Buvel is convinced that in this way the priests helped the souls of the deceased pharaohs to unite with specific stars, and the stars — the beaters of many souls of the predecessors of the newly born pharaoh — to become his “parents”. In this connection Buvel often quotes a piece from the famous “Pyramid Texts”:
“Your sister (wife), Isis, comes to you to enjoy your love. Thou hast placed her on thy phallus (shaft), and thy seed has entered her; she is ready to become Sothis (Sirius), and Gor-S odu (star) has come out of thee, like Gor who is in Sothis…’” (Pyramid Texts, 632).
However, R. Buvel attaches only mythological meaning to this choice of starlight in the sky. And what if the Egyptian priests gave it also a biological, physical meaning, believing that the light of specific stars, chosen by them according to a certain principle, will allow at the moment of conception of the future pharaoh to lay in him an astrological program, exclusively inherent in these stars?
So, returning to our material world, let us remind that after the synthesis of male and female germ cells, a human being unfolds from the MCV, which “flies” along the S-axis 5 orders of magnitude in 9 months. Let’s consider what is the trajectory of movement along the S-axis of each person during his life.
For this purpose, let us introduce some parametric space “S — T”, i.e. scaletime, where time is denoted by the letter T.
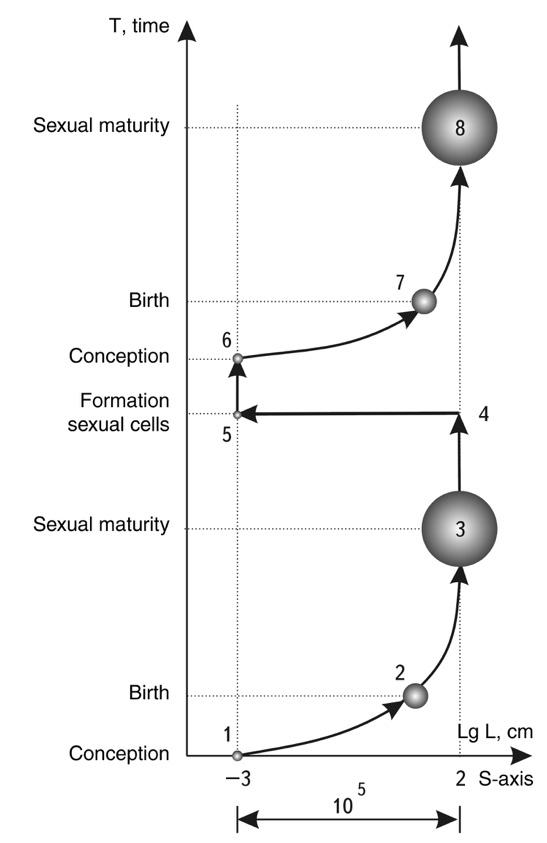
Fig. 3.4. Time-scale diagram (T-S) of the life of a “genetic human”
Let us assume that the starting point “1” for each individual is the moment of synthesis of male and female germ cells in the MCV. Then during 9 months the fetus moves along the S-axis by almost 5 orders of magnitude until it is born at point “2”. After 16-20 years, it reaches its ultimate growth and enters point “3”, which is 5 orders of magnitude to the right of the starting point “1”. From point “3” a person travels through time, remaining in a constant dimensional range. After death, a person disappears from the life space of the T-S diagram. However, if we consider his continuation in descendants, the diagram acquires a cyclic character. At a certain moment of time, all information accumulated by a human being during his life is collected and concentrated in his germ cell, which, joining with another germ cell, starts a new cycle. The process acquires a pulsating character, with a period in time of 20-40 years and a period in scale of exactly \(10^{5}\) (see Fig. 3.5).
It is very important to note that the base and starting point of fixation on the S-axis for each person is the. It is a kind of large-scale eye of a needle through which each time a person passes, being born again after his previous life.
Pyramids with the angles of the maximum human ascent of the stars in the period around 2450 AD (according to R . Buvel). The upper chamber of the czar was illuminated by the light of the star from Orion’s belt and Alpha the Dragon . The lower chamber of the czar was illuminated by the light of Sirius and Cohab.
FREEDOM OF DISCUSSION
It can be assumed, based on the model of the “grain of the world spirit”, that each person is a synthesis of two beginnings: earthly and heavenly. The earthly is accumulated from generation to generation and is passed on with genes from ancestor to descendant.
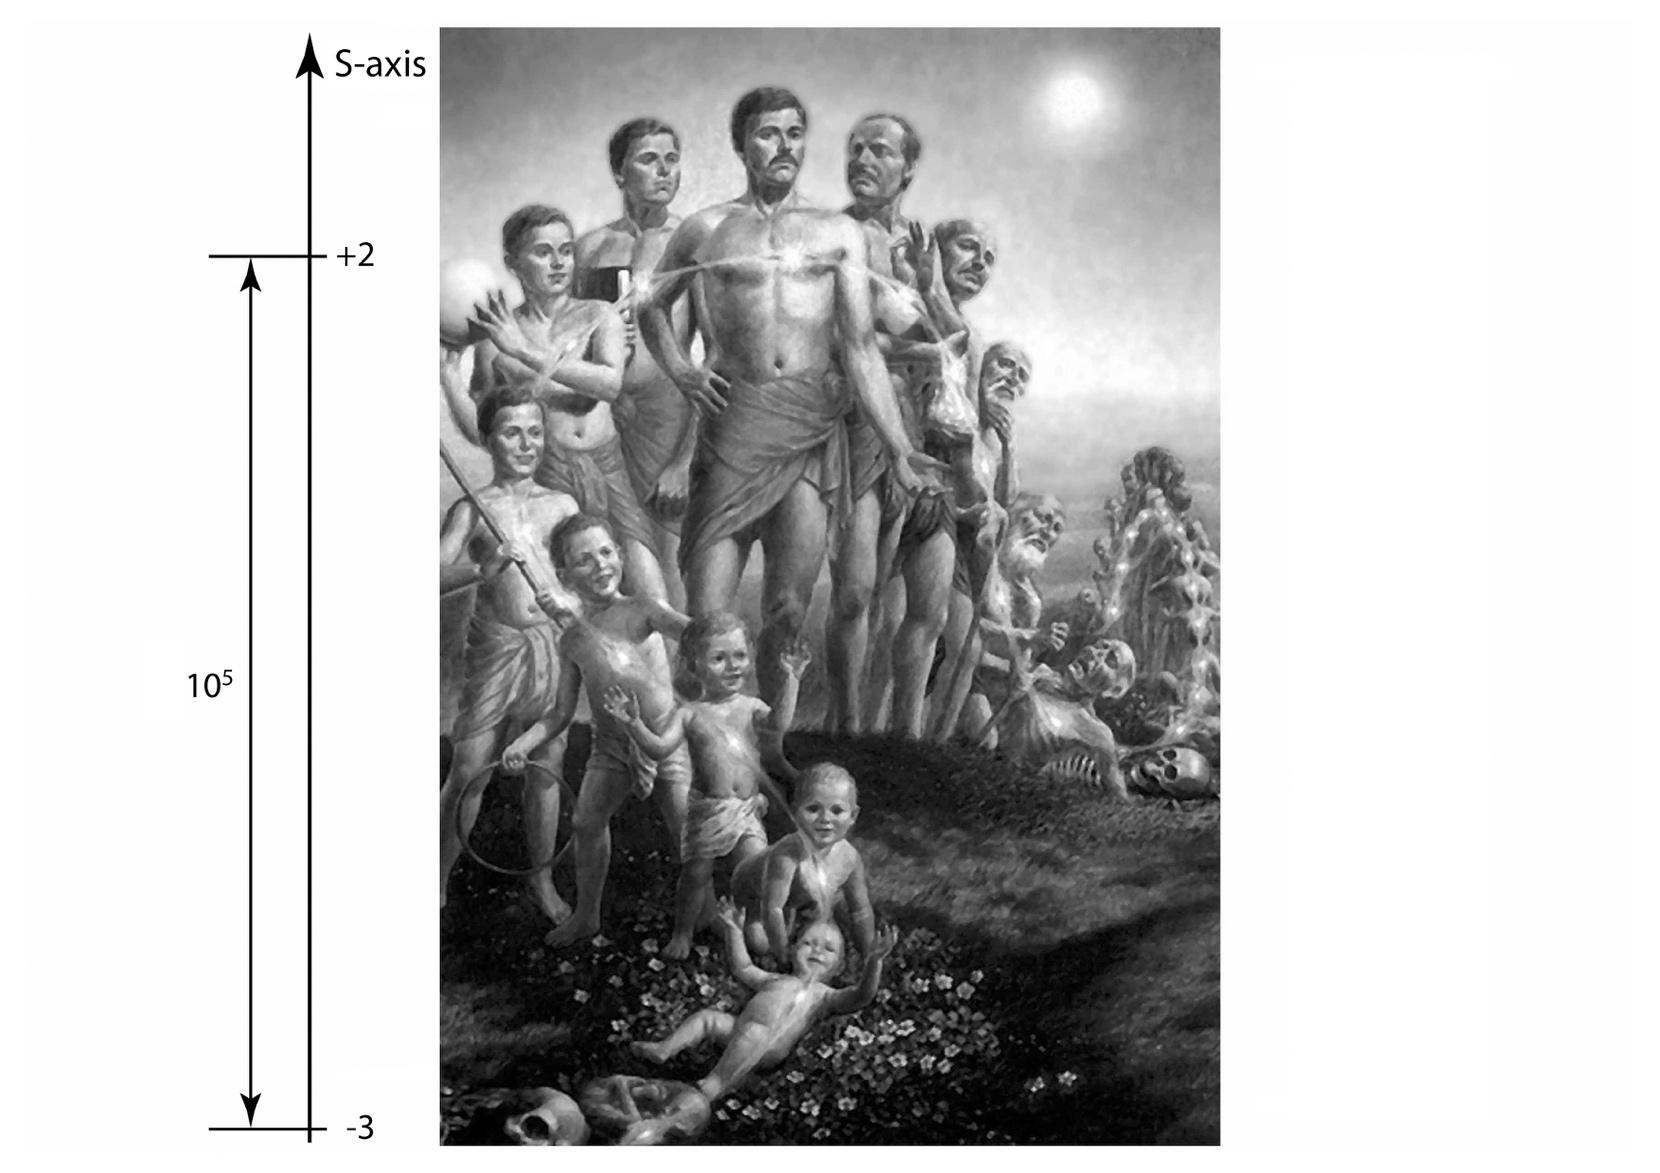
Fig. 3.5 Birth — maturity — death. The ancient Vedic picture of multiple human rebirth can be clarified, since each person performs large-scale pulsations on a scale of exactly 5 orders of magnitude: from the germ cell to an adult… and vice versa?
Suppose that the “grain of the world spirit” at the moment of joining two cells joins the formed genetic material of a new human being and semi- should be clarified, since each person performs large-scale impulsions in a range of five different ways : from the sex cell to the adult cell … and back again ? is receiving information from the whole Universe. Then also through the arrangement of stars a part of the “mission assignment” can be encoded, which is received by a particular “seed of the world spirit” that joins the ovum at the moment of its fertilization. Undoubtedly, much of the above is only intuitive PROPOSALS. It is important to note that they are based on the model of large-scale harmonic oscillations developed in this book.
-
Buval R., Gilbert E. Secrets of the Pyramids. Moscow: Veche, 1997. ↩
Phase Two. The place of man in the S-hierarchy of the Universe
Do not complain: this is the law of fate;
the whole world revolves around man,
- Will he alone be immovable?
А. S. Pushkin, 1836
Before proceeding to this chapter, the author would like to stipulate in advance that this and the following chapters are only an attempt to consider, through the prism of the laws of the material world, the tasks facing man in the same material world. For this reason, the vast majority of the material is intended to reveal the external aspects of human existence. The only exception is the texts of “digressions”, whose free flight of thought sometimes leads the author to the problems of the inner world of man.
Let us recall some facts related to the peculiarity of man’s position in the large-scale hierarchy of the Universe.
The scale place of the human being on the S-axis is five orders of magnitude to the right of the SCU. This asymmetry is not accidental and has a deep meaning connected with the evolutionary development of the Universe. It is also very remarkable that not only man is shifted to the right by 5 orders of magnitude from the SCU, in the same way the whole “wave of life” is shifted relative to the scale center by 5 orders of magnitude to the right, and \(10^{5}\) is a universal Universal dimensionless constant, the value of which for the scale regularities is paramount and most important.
Let us remind once again that just as a living cell is in the scale center of the Universe, so a human being is in the scale center, but in the “protein Universe”. It is important to note that the shift vector of the “wave of life” coincides with the vector of the Metagalactic expansion and with the vector of the global evolution of the Universe. If we speak about time as a process going in the large-scale space, then the vector of time is directed in the same direction. After all, the Universe becomes larger with age, and the global universal time flows in the direction of increasing masses, and not vice versa. Moreover, as already mentioned, most of the multicellular species (mammals, fish, amphibians) are located in the size range from 3 centimeters to 30 meters. On the S-axis, this interval has an average logarithmic size close to the human height. Consequently, man is not only in the scale center of all protein life, but also in the scale center of multicellular life. Its central position in connection with these facts looks less and less accidental.
However, it is not only the central position in the protein world that distinguishes man on the scale axis. As we have already written, its scale position is located about 5 orders of magnitude to the right of the SCU. Moreover, if we put off 5 orders of magnitude from the leftmost point of the S-interval - from the fundamental length, from the point A = \(10^{-32.8}\) cm (see Fig. 1.7), then in exactly 7 steps we will get to the scale of human size - \(10^{2.2}\) cm = 161.58 cm, or 1.6158 meters. In the last century, this corresponded almost perfectly to the average height of a human being. But by our time the average height has increased by several centimeters, which can be explained by the mass use of hormones.
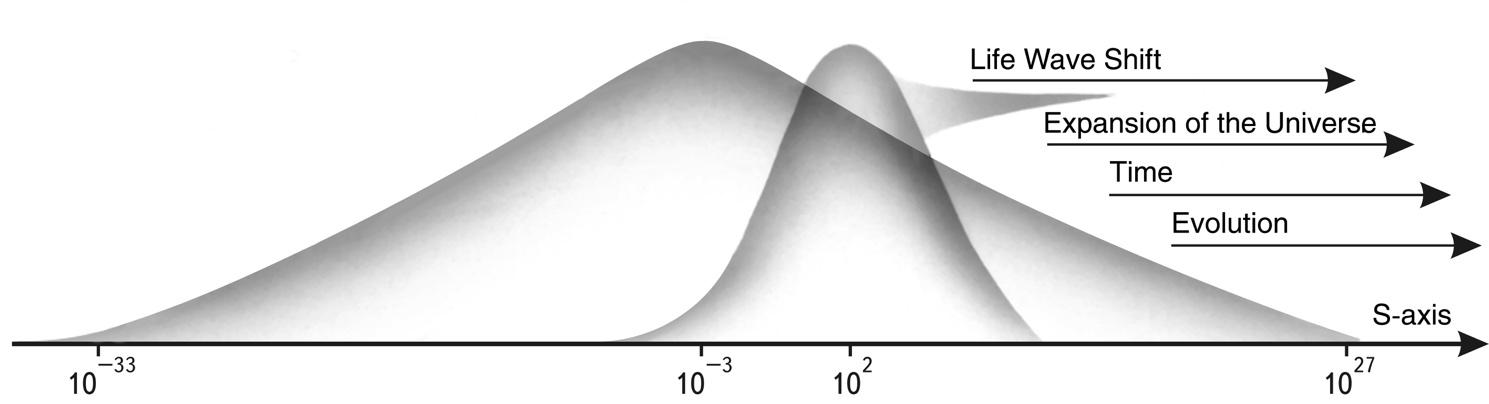
Fig. 3.6. The wave of life rapidly advances to the right along the S-axis in the direction of increasing sizes of more complex protein systems. The scale center of the wave of life is shifted relative to the scale center of the Universe by exactly 5 orders of magnitude.
All the above-mentioned testifies to the undoubtedly distinguished, special position of man in the hierarchical structure not only of the Biosphere, but also of the Universe.
FREEDOM OF DISCUSSION
If man really occupies a central position on the scale interval of protein life, if he is really the best child of the Universe on Earth, his individual power could be much higher. All the more so because there is no number of examples when a person’s potential is much higher than the degree of his realization. It concerns both physical and mental and psychophysical capabilities of a human being. For some reason, however, this super-high potential manifests itself only in individual cases.
Many legends and myths say that the latent abilities of man in the past were manifested not in a lesser but even in a greater degree. If, for example, we believe the literature about Atlantis, Hyperborea and other vanished civilizations, then individual capabilities in those times were fabulously great: people flew, traveled to other worlds, moved the stones of the pyramids with their eyes, and so on. Where did it all go, if it was?
And in general, what is the result? If we follow Darwin’s godless theory of evolution, a useful property, even accidentally acquired, is accumulated and consolidated. Natural selection in this case would lead to the fact that for many thousands of years individuals who could eat glass, cut themselves without consequence with swords, eat a tiny amount of food, see through walls, levitate, memorize huge amounts of information, overcome any difficulties by the power of thought, etc., would have to survive and win the struggle for existence.
If we believe in God, it is not clear why He constantly shows these examples to people, but does not let them master them? Does He punish them for their sins? And the longer mankind lives on the Earth, the more sins increase? Consequently, humanity has been going wrong for thousands of years, God sees it, but for some reason tolerates it? Or does He want to wait for more sins to accumulate, so that He can punish them severely and make them sick! What is this model of the Creator who has created an imperfect world and waits only for a convenient opportunity to destroy it?
Let’s imagine that we have children whom we love. Children are spoiled, mischievous, do something wrong. Are we waiting for them to spoil themselves so that we can gather them together and flog them? Is this the thought of God that magnifies Him? Could it be simpler and more logical? Man with all his biological past heritage is an animal. Animals have been eating each other for hundreds of millions of years.
I should think that this was the plan. After all, attempts to remove natural enemies have always led to mass disease and extinction of herbivores. So for the antelope being eaten by the lion, this is a totally negative event, but for the entire antelope community it is a wonderful event: “Get the bad grass out of the field!” It is not for us, with our tiny knowledge of the laws of the world, to judge the Creator for having created the Biosphere as it is, and that natural selection and the food pyramid have been operating in it for billions of years.
And here appears on Earth the first creature for all billions of years, which is able to intensively develop the population level of organization of the Biosphere. The focus of evolution on the S-axis changes. If before the most important for the Biosphere was to create the most perfect and diverse species of multicellular organisms, now this task has been accomplished and there is no need to improve the organismal level. Now it is time to build the next floor from the already created organisms. And what yesterday was the purpose of creation - organisms - today becomes a means, a building material.
Those who have built brick houses know very well that when they buy a brick, they always try to choose the perfect bricks: whole, without cracks or chips. But when they are used to build a house, it is often necessary to chip these perfect bricks to make a corner or put a beam. And so it is here. Initially perfect people are subjected to special “deformation”, capping, as they are “stacked” in a social construction. Soldiers are taught to shoot, police are taught to catch criminals and put them in jail, judges are taught to judge, although the Christian commandments say: do not kill, do not judge…..
Now let us imagine that such an imperfect social system will be filled not by ordinary people, but by such supermen, magicians and wizards, sorcerers and flyers, i.e. people with increased psychophysical, physical and intellectual capabilities. What will happen? And everything will be much worse - there will be mutual struggle with great energy expenditures, with great losses and troubles. After all, practice shows that social flexibility and adaptability of bright personalities are much lower than average ones. Pride prevents them from fitting frictionlessly into the social fabric of life. That is why we sometimes think that God gives people the smallest of all their potentialities (the least of which cannot be given) in order to minimize the losses from social conflicts.
In any case, looking back critically on his life’s journey, the author is glad that he did not have in the past, in many cases, a real opportunity to realize his angry impulses.
And only in order that we know and see our unrealized potential, do not forget about it and strive to obtain it, that is why God allows people with supernatural abilities to appear on Earth from time to time, but only as examples, only as guides, as beacons of the future. Some of these people become saints and bring good to people with their abilities. Some of them cannot cope with the feeling of their own exclusiveness, which creates in them a consciousness of gigantic superiority and conceit, which creates pride. This leads them down the path of egoistic lust for glory, honor and adoration. They can do so much mischief that society will once again realize that it is too early for people to have such high possibilities. It is not without reason that many elders in Russia, if they could not cope with pride, asked the Lord in fervent prayers to take away the gift of healing, which they received after a certain period of self-conscious striving for the divine ideal.
At the same time, the author has no doubt that as soon as mankind matures and achieves wise harmony with the universal laws, as soon as a harmonious social structure is created, the secrets of divine individual power will immediately open up in many people.
Let us consider another assumption based on the principle of large-scale analogies between the physical and social worlds. Suppose that human psychophysical forces are analogous to nuclear forces, and social forces are analogous to electromagnetic forces. Then psychophysical forces should be much stronger than social forces on short scales, at the level of individual mutual contacts (within social nuclei), and on large scales they will become negligibly weak and will be overpowered by social forces. This is what is actually happening. Let us explain this analogy once again.
Let us imagine that we are inside a complex nucleus. Contrary to the forces of electromagnetic repulsion, protons are tightly coupled into a single whole due to strong interactions. At the same time, if protons manage to get separated at a distance slightly more than \(10^{-13}\) cm, they instantly fall into the “embrace” of electro-magnetic forces and fly away from each other under their influence.
Probably, human psychophysical forces have a very limited potential of influence, i.e. their radius of action is rather small. Then, if we get into the energy field of a magician, if we are near him, he is able to keep around him a certain number of disciples, followers who worship him. However, as soon as we leave the “sect” (beyond the boundaries of the “core”), we enter the field of social interactions, and the “magician” loses his power over us.
Certainly, just as religious, magical, and mystical schools were needed in the past, today we need schools for scientists, directors, musicians, and politicians. The actual go-hen, there is nothing inherently negative in uniting people around one very strong personality. The only question is where does this person lead his disciples?
At first there were only 12 apostles around Jesus Christ. It was not only the truth of His sermons that kept them around Him. He did not show His supernatural powers for the sake of entertainment. Why do new religious schools and sects arising today lead their followers into a dead end? This is a very difficult question.
Perhaps one answer is that in the purely RELIGIOUS sphere, nothing better can be invented or created than what already exists. At least not until all ten Christian commandments are practiced every day.
And as far as I understand this problem, many “prophets” either simplify known religious teachings or create a cult not around a deity, but around their own personality. In both cases, this is a negative phenomenon.
It is a different matter if scientific schools are created. In this case there is not a process of deification of the teacher, but merely a concentration of people’s attention on a new scientific idea.
The second aspect of the large-scale analogy is the proportional relationship between natural systems with strong ties and systems without strong ties. Recall that more than 70% of the matter of the Universe is concentrated in hydrogen atoms, and the hydrogen nucleus is just one pro- ton. Hence, for most of the matter of the Universe, strong interactions play no role at all.
Could it be that in the social environment the ratio of people in schools and sects to people outside such sects and schools is about 1:8?
The third aspect of the scale analogy. Recall that the heaviest nucleus consists of no more than 300 nucleons. Beyond this number, it is impossible to hold the nucleons together with the help of strong interactions. Could it be that psi-physical interactions cannot hold together people numbering more than 300 or so? Maybe that is why sects and schools of all kinds, based solely on the psycho-physical power of one person, do not live long and cannot subdue a much larger social space. Perhaps it is precisely because of the desperation of not being able to expand their social influence that the leaders of such schools go to extremist measures. One of the most recent examples is the Aum Senrikyo sect.
Perhaps this is why many of the strongest psychics and miracle-workers are so poorly socially adapted. Their incredible abilities set them apart from ordinary people and they do not think of themselves as preaching in an individual temple where ordinary people are only allowed to bow down to them. At the same time, they cannot go out into the wide expanses of social spaces on “naked psychophysics”. The success of some schools, as the study of their history shows, is based on the skillful use of the whole set of modern social technologies, up to bribing high-ranking government officials. The many scandals involving newfangled prophets, which the twentieth century is so rich in, for example, show that it is impossible to enter the future from the back door, bypassing the logical development of culture. The path that bypasses science only through ancient esotericism, in the author’s opinion, is an attempt to bypass the difficulties of building a logical construct of society, an attempt to bypass the future. Such regressive moves are peculiar only to collapsing social systems, which in physical time move into the future, and in evolutionary time - into the past.
Let us look, however, at this problem from another angle. All the diversity of the world is based on the presence of complex atoms (hence complex nuclei), although they are much smaller in mass than simple ones. Using large-scale analogies, we can assume that clusters of people also bring a leaven of diversity to the social world. So to relegate the idea of society to social ionized individualism is analogous to trying to return the universe to its primary hydrogen-proton state.
So, one can PROPOSE that just as electromagnetic forces hold the entire macro-floor of the Universe, so social interactions overcome the mass-staff horizon of psychophysical connections and expand the horizon of people’s association.
Man is located absolutely precisely in the center of the protein interval on the S-axis. However, his central position is such only in the static picture of the scale structure. We believe that the wind of change blows along the S-axis, towards larger scales. In other words, the expansion of the Metagalaxy creates the RIGHT VECTOR OF EVOLUTION constantly acting on the S-axis.
If we consider the hierarchical structure of the Universe more traditionally, i.e. vertically, then the ALMOST EVOLUTIONAL FLOW IS UPward. Naturally, the anti-evolutionary, regressive movement is directed downward.
One can BELIEVE that for such evolving systems as man, equilibrium cannot be achieved only by focusing on the development of one’s own mass-staff level (~\(10^{2}\) cm). Traditionally speaking, a human being is not able to hold an egocentric position, for he would then have to resist the evolutionary pressure of the universal scale. Consequently, if the location of the
of man on the S-axis and is by many signs central in the protein range, his outlook should be directed not “to the navel”, but upwards towards the larger scales. From this seemingly simple large-scale “observation” there follow worldview conclusions, which we shall now consider.
Before we turn to the social aspects of this upward movement, I would like to note once again that the boundary of this upward movement is open to infinity. To put it another way, the vector of this upward movement is directed towards the Supreme.
First. Man is centralized relative to two poles: the pole of the completed evolution of the world of unicellular cells and the pole of the ongoing evolution - the world of social systems. Both poles are distant from him by 5 orders of magnitude (see Fig. 3.1). The left half of the protein interval is mostly filled with systems already formed in harmonic perfection, while the right half is only just being filled with systems that are being formed and therefore imperfect, non-harmonious, but developing. Naturally, there arises the PROPOSITION that ONE of the most important tasks of man in the Biosphere is the transfer of Nature’s “inventions” from the left part of the interval of protein life to its right part.
There is no sense to prove here that the social environment is much more complex than the population structure of animals. This complexity is ensured by the social framework, which can be described in different slices. The author, as a systems engineer, is closest to the technosphere of the social environment, so let us consider it. It is obvious that the life of modern society is impossible without technical infrastructure: plants, factories, houses, roads, communications and other external systems. Let us call this subsystem of the Noosphere the Technosphere. It has been developing particularly rapidly in the last century.
As a result of the explosive expansion of the Technosphere, the mankind has received, besides a number of conveniences, not very pleasant consequences connected with it.
For a long time artificial objects (from an axe to a rocket) were perceived by people as creations more perfect than biological ones. It is understandable, because man created them himself, created them by labor. At the same time, all biosystems - “from bee to elephant” - appeared regularly without his intervention and therefore were valued in other, lower categories.
Of course, today you cannot exchange an axe for an elephant, but only because of the fact that an elephant is of greater use value to man. We catch a live mouse in a mousetrap, and we buy a mechanical or electronic mouse for children with pleasure. All this was explained by the fact that Nature could not create a wheel, a bow, a cannon, a doll and many other “wonderful” things that man could create.
Only in the twentieth century, when science seriously started to study the functioning of biosystems, it became clear that many technological inventions are just analogs of already existing (on other scales) biological mechanisms and systems. It was realized that most technical inventions
It was realized that the majority of technical inventions are not only analogs of long-standing (on other scales) biological mechanisms and systems. In this connection, some ideologists who curse all technical development in general, calling the Technosphere a calamitous mistake of mankind, began to appear more and more often. Such a radical denial of the Technosphere, we believe, is a worldview error. The problems of the Technosphere can be solved by technical means, and Mankind has no other way. However, to those hotheads who curse the technical civilization in principle, we would like to advise them to be honest and consistent. Gentlemen, if you curse technological progress, do not pick and eat the “poisonous fruit” from this tree - give up all the comforts it gives you. To do this, settle somewhere in the Siberian taiga or the Amazon jungle and return to a “natural” existence, and from there, having first set an example of “natural living” for yourself, try to propagate your beliefs throughout the world, for example, by means of drums.
Invention is nothing but a transfer (most often intuitive) of processes and constructions that have already been created by the Biosphere and realized by evolution, including within man himself. This realization led to the birth of a new scientific direction - bionics 1. As the mysteries of biological processes became more and more deeply penetrated, it became clear that most (if not all) human inventions have “prototypes” in nature. Those inventions that are difficult to match with natural prototypes are usually imperfect and intermediate.
Indeed, what is a kitchen? It is the human stomach taken outside. What is a pharmaceutical factory? It is the macro-level processes unfolding in the cell. In other words, in the most general form, the Technosphere is a human organism turned inside out and transferred from micro to macro scales (see Fig. 3.7), if we consider it as a typical representative of the Biosphere. In any case, if it were possible to create as perfect a supply structure in society as the circulatory system, as faultless a control system as the nervous system, as ideal a control center of society as the human brain, the life of an individual human-cell in such an organism-society would be several orders of magnitude more comfortable, stable and harmonious.
Thus, the author BELIEVES that one of the functions of Man on Earth is the INVERSIONAL TRANSFER of those ingenious inventions of the Biosphere - which he carries in himself or which he finds in the structures and functions of other organisms - from ONE SCALE FLOOR TO ANOTHER (see Fig. 3.7). It is very significant that such a function of the “kingpin”, carrying from the microcosm to the megaworld the ingenious inventions of Nature, is fixed by the central position of man himself.
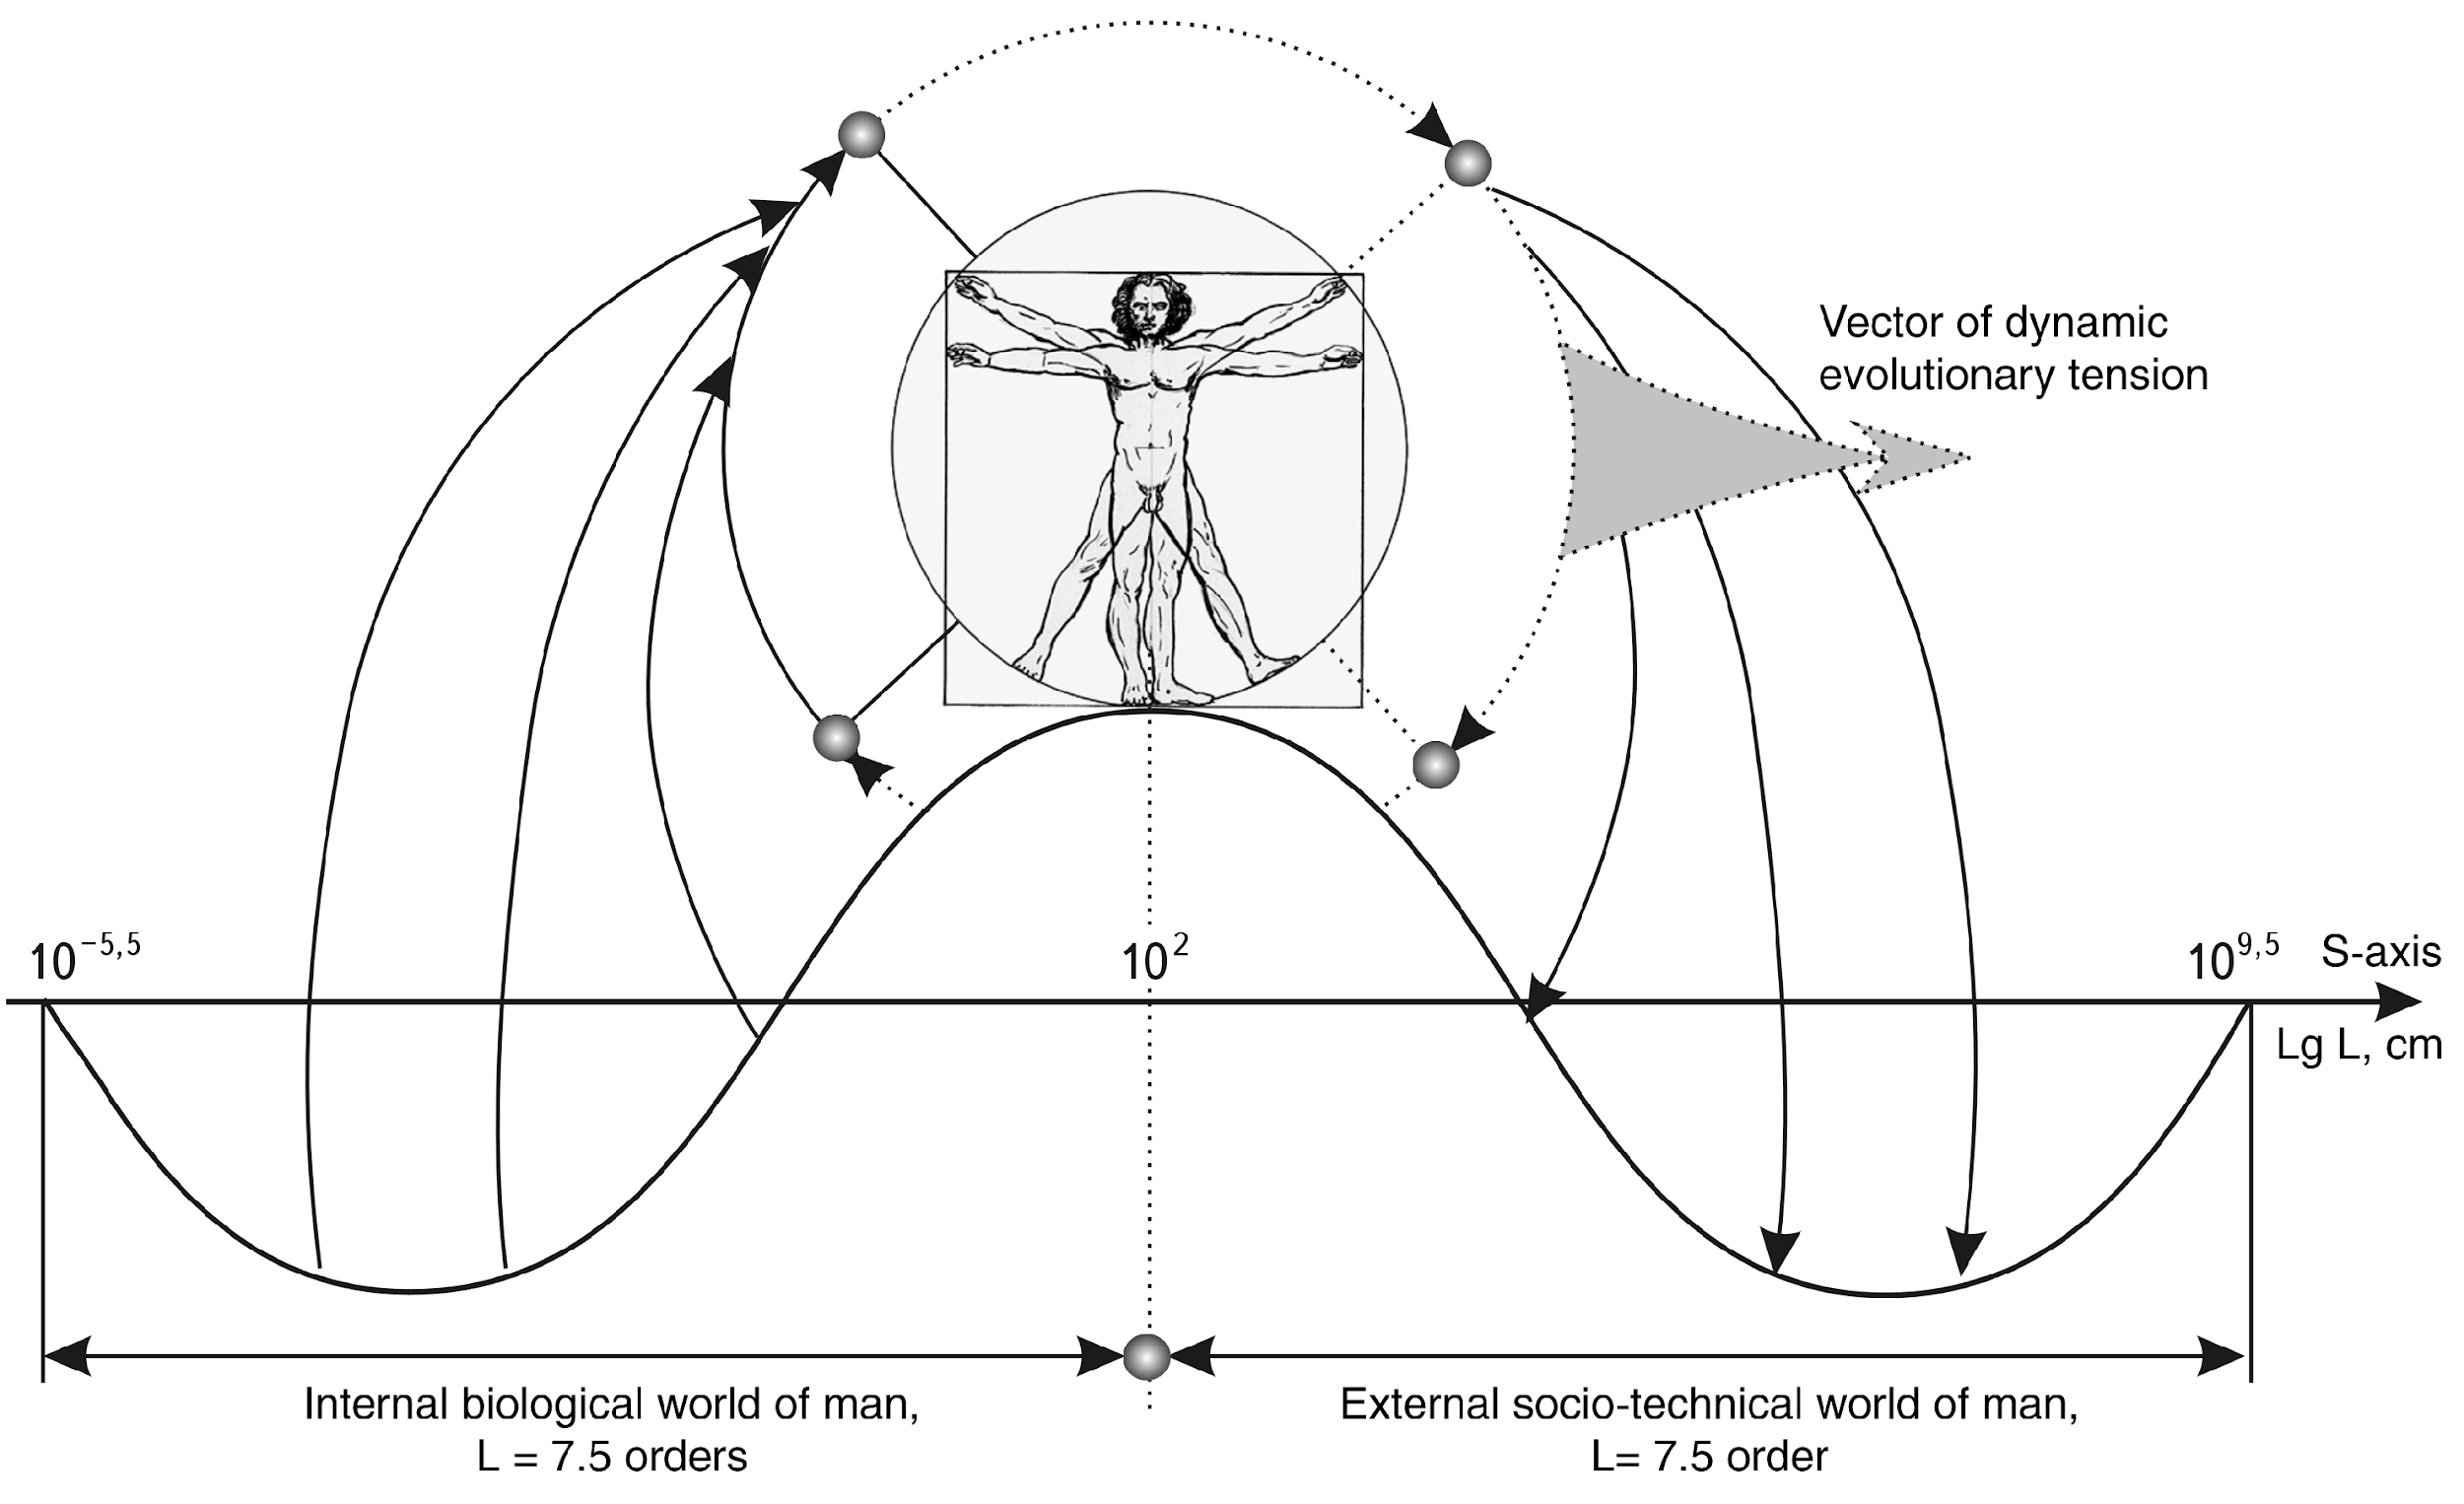
Fig. 3.7. Man is the axis of the scale lever that transfers Nature’s “inventions” from the micro-stages of the Biosphere to the mega-stages
After all, all his organs, systems, cells and their subsystems are his internal structures. Therefore, at the S-Interval of life, the left half at 7.5 orders of magnitude can be considered as the internal space of Man, and the right half at 7.5 orders of magnitude as the external space. Thus, the technogenic function of Man can also be considered as an inversion function: the transfer of Nature’s “inventions” from inside Man to outside.
Of course, it is impossible to blindly repeat biological processes on other scales, because, as we have already shown, the laws of nature are not invariant locally on a large scale. When moving from level to level within the Macro-interval, many natural laws change essentially. For example, the principle of jet motion is the same for both squid and rocket, but the difference in embodiment is huge. Therefore, Man is not a blind copyist of Nature. He must, skillfully using the accumulated before him nature
He must skillfully use the “developments” accumulated before him, skillfully fit them into new scale levels taking into account different conditions. Obviously, it is necessary not to forget about the integrity of the systems he creates and how the new systems will fit into the already existing connections of Nature. Consequently, man should be a creator because there is a large-scale non-invariance. And that is why the knowledge of large-scale laws is vital for mankind.
So, even if man himself is not able to invent anything fundamentally new in this world, he is able, copying Nature’s inventions, to adapt them to new scale levels, which also requires extraordinary creative abilities.
The second important consequence of the assumption about the action of the upper (right) vector of evolution is the following. Since Man is the completed creation of Nature, and the Noosphere is just another step on the scale ladder of complex systems being built by means of people, the task of each person is to participate in this construction. This means that, ideally, every human being should leave the world more developed. Of course, for individual people this thesis can be disputed, but in general, if we recognize that society develops (the author is firmly on this position), it is obviously developed by the efforts of individuals.
FREEDOM OF DISCUSSION
The following PROPOSITION may be put forward here. Initially there is some ideal plan of development of the social structure of society. In this plan mankind moves from simple structures to complex ones. At the same time, the informational complexity of the social system increases (sometimes at the expense of temporary violation of the harmony already achieved at the previous stage of development). Nature originally conceived that every human being is a human being comes into the world with such an inner expectation of social complexity of structures, which is greater than its real state.
Therefore, when he begins to enter the world of social relations, a tension of discord is established between his inner expectation and the external reality.
The inner state of harmony is higher on the evolutionary ladder than the realized outer state. This difference in weak people gives rise to despondency and disappointment in life, while in strong individuals it gives rise to the desire to remake the world, to make it more harmonious, more consistent with inner harmony. Since each person has his own way of life, his own front of struggle, it follows that each person receives from birth his own “mission assignment” from Heaven, his own plan of action, his own “secret package”. It is possible that this package is laid down by Heaven at the moment of conception, at the moment of union of two cells. A person is obliged to open this package in the second mature half of his life.
So, if we recognize that man from birth is always more harmonious than any society, we will understand that any man is specially “programmed” to be constantly dissatisfied with the social world around him. If this dissatisfaction motivates him to positive action, it is for the good. If it eats up a person, it is harmful. Therefore, if we explain to each person from childhood that the social world is a construction site, that it is less perfect than his inner world, and that everyone’s task is to make the world a better place wherever fate puts him, there will not be many disappointments, which our world is so full of.
In fact, wisdom is to choose one’s own (and not someone else’s) burden when entering the social world.
and pull it with the utmost, but not tearing force. Wisdom lies in the understanding that initially the inner world of each person is always more perfect and harmonious than the external social world. It has been so in all ages, and it will be so for a very long time, perhaps always.
It is remarkable that all these conclusions, almost obvious to a cultured person, can be easily drawn using a simple diagram of the dynamic evolutionary tension created by the Universe on the crest of evolution for each human being (see Figure 3.7). Such agreement of model conclusions with general worldview truths, admittedly, pleases the author.
Another aspect of the correlation between large-scale tasks and goals. It is related to the problem of health of each person. The author’s personal experience has shown that, most likely, the main cause of disease lies not inside a person, but outside him. Undoubtedly, hereditary, genetic diseases are hidden inside, but they are mainly caused by unfavorable external factors in the past. In particular, the source of diseases lies in the wrong self-identification of a person in the social sea of tasks and problems. A less perfect social world deforms a person. This deformation in the form of stresses and discord penetrates through his consciousness and psyche into his somatics, giving rise to diseases of all kinds. The disharmony of the external world leads to disharmony of the inner world, and the latter, as research 2 has shown, is the cause of many, if not all, diseases. Just as cells become diseased within the body of a person who leads a wrong way of life, so too do social human cells become diseased within the body of a person who leads a wrong way of life.
human cells become sick because of the wrong way of life of the whole society.
Hence a very nontrivial conclusion: the BEST REMEDY FOR ALL DISEASES IS HARMONIC CONSTRUCTION OF SOCIETY.
A happy, developing society will consist of healthy people. In the light of the above-mentioned, the efforts of modern medicine and the best herbalists and healers are initially less effective than the efforts of people who strive to revitalize social life.
ous damage caused to society by wrong, erroneous social activities?
The fact is that a side effect of medical practice is an ever deeper and more subtle understanding of the processes going on inside the human body. It turns out that it is partly for the acquisition of this knowledge that society pays doctors.
So, maybe our medicine is conceived by the higher powers not only for treatment but also for study? After all, since one of the most important external tasks of a human being on Earth is to build a harmonious society, why not transfer the systemic laws of organization and functioning of the human organism to the social level? What is not a task for “higher bionics”?
Of course, this transfer should be done taking into account both scale similarity, or invariance, and scale non-invariance. Therefore, maybe all our treatment by doctors is a “bait” in order to collect and systematize a reliable data bank on the activity of the human organism at all its levels?
Through the prism of large-scale regularities we can also consider the question of PERSONAL HAPPINESS.
Man is a thinking being, so his happiness cannot be complete if he does not understand his place in the universe. A person who perceives his life as a random blip against the background of eternal and black infinity of nothingness cannot be happy. The search for the meaning of life is important because without an answer to this question, and the answer is correct and optimistic, the real full-fledged happiness of an individual is simply unattainable.
At the same time, the search for the meaning of humanity’s life is, first of all, the search for the ultimate goal of its existence. Obviously, it cannot be simple well-being, because the ultimate goal should always be sought outside the limits of the object under study. To assume for a while that the ultimate goal of mankind is the ultimate goal of its existence.
It is certainly possible, but in this case the evolution of mankind loses any sense and turns either into a simple struggle for survival or into the pursuit of pleasures and comforts.
We have already shown (albeit cursorily) that the direction of development of the human community on the S-axis coincides with the direction of development of the Universe on all its scale levels. Therefore if the goal for Man is understood simply as movement in the direction that dominates in the Universe, and not something opposite or “perpendicular” - then the external task of human existence in the Universe (within the framework of the considered model of the scale structure) consists in a very simple formula - it is the involvement of more and more volumes of “cosmic” matter in the cycle of life, “revitalization” and mastering of matter with the subsequent higher harmonization of more and more space, and not only three-dimensional space, but also parametric (scale) space.
If we accept this simple formula, then the calls to abandon the technical achievements of civilization and return to the primordial nature look at least wrong, and are in fact a temptation to “abandon one’s cross” and go against the universal current.
The spread of life into all kinds of space, into all dimensions, the creation of more and more complex and harmonious systems as a result, the mastery of new scales - this is the permanent external “goal” set by the Universe before the Biosphere, and the human species in this spread is another link necessary to overcome the threshold to the fourth dimension, to the fourth phase space. Moreover, the logic of development of the modern technological industry is such that in the coming decades it may lead to the development of the fourth dimension, to the fourth phase space.
to the collapse of the whole civilization. As history has shown, attempts to limit the birth rate (China) or to switch to restraining technological growth (Brazilian Forum) do not yield results. Therefore, a global systemic crisis awaits humanity in the future.
The analysis of this situation in the system-historical aspect led the author to the version 3 that the main technological crisis - the energy-ecological one - can be overcome in the future by moving the entire energy-producing industry into outer space. However, going into Space is not a trifle, it is a grandiose task that requires enormous efforts and expenditures of the whole mankind.
What about the definition of the meaning of life as the pursuit of happiness? Is there no contradiction here? And what is happiness? It is difficult to give it a new definition, because there are already plenty of old ones. However, it is possible to give a definition of happiness that integrates all the previous ones. To do this, we just need to remember when a person is happiest? Certainly, in childhood. But why? They say there are no worries, but this is not true. They say there are no problems, but that’s not true either. The only reason we are happy as children is because we are constantly growing and evolving. Our body grows, our intellectual and spiritual abilities grow, we develop and we have more and more additional abilities. The same thing is happening to the entire Universe! It too is growing and evolving.
Therefore, thanks to the genetic program, the child is always in the coherent EVOLUTIONARY STREAM OF THE UNIVERSE, and is therefore happy no matter what. Any deviation from this flow, let alone stopping or reversing it, makes us unhappy. The fact that there is no happiness in stopping has been proved, as we know, by Goethe in Faust. It is impossible to stop a beautiful moment precisely because it is beautiful.
The beauty of life and happiness are inseparably connected with continuous evolutionary development. Any stoppage, fixation on what has been achieved is tantamount to a relative movement against the Universal flow.
Hence, happiness is a universal indicator of the correctness of movement through life.
And if in childhood we receive from nature an inner reserve of growth and development that is not excluded from us, then, growing up, most people switch more and more to external sources and spaces, many people strive to grow “outwardly”. There are many options here: to increase property, finances, power, fame, popularity and others. All of these paths are unified by one principle - THE DESIRE TO BECOME “GREATER”.
Indeed, power and money allow us to control social and material space. The more power and money, the more “personality” one feels. The popularity of actors and athletes, politicians and writers allows them to fill concert halls, stadiums, auditoriums and people’s minds with their emotions, thoughts and actions. The more talented a person is, the brighter he is, the more his “light” in the public sky. If a person has problems with self-expression, if he is all alone, then “happiness is when you are understood”. After all, if you are understood by at least one person, you are already “wider” than yourself twice as much.
There are cases when a person is ready to selflessly serve other people: the sick, the elderly, orphans and the disabled. This brings him happiness because his personality has a positive influence on these people. As a result, he becomes socially “bigger”, exactly as much as he helps more people. Such a person gains nothing materially, but he acts in the direction of “growth” rather than “collapse” and is therefore happy.
The author is no exception. I have created my own business - the production of the best diamond tools in the country. The business feeds about twenty families, and this “influence” brings me joy.
In 1997 I published my first book “Russia in the XXI century”. Sometimes people call me and thank me for it. I know that several thousand people have read it and at that moment were thinking the same thing I was. This “growth” in society pleases me. If this book also fascinates other people with the ideas of large-scale symmetry, such a
“expansion” of my ideas will make me even happier. And God forbid that I do anything that alienates even old friends and acquaintances - this social “collapse” will make me unhappy.
All these examples are meant to illustrate a simple idea: the expansion of a person in society (due to power, popularity, money, charity, love, etc.) brings happiness. We do not discuss here the moral and ethical aspect of this growth (we will come to it in the next section of the book). Let us only note that the happiness of a destroyer is never full-fledged. When people are ready to pay for glory not only with their own lives but also with the lives of others (there have been many herostratuses in the history of civilization), this only indicates that their natural desire for expansion has taken ugly and distorted forms as a result.
For the world does not grow and develop at the expense of herostratus, but at the expense of Prometheans and creators. Therefore, the BALANCE is ALWAYS IN WAY OF THE CONSIDERING POWER OF “GROWTH”. Here the personal desire for “growth” is also influenced by the tendency of growth of the external world of man, of society.
Of course, there are a lot of nuances in such a complex issue. Realizing the complexity of the topic, the author would like to emphasize the main emphasis: Happiness is ALWAYS GROWTH AND DEVELOPMENT (growth of complexity). UNHAPPINESS IS COLLAPSE AND DEGRADATION.
So, on the S-axis, happiness has a vector direction - to the right. One of the problems of realizing this movement is the confinement of social space. Striving to expand ourselves outward, we encounter other people stretching their hands to the same “piece of the world”. Therefore, by realizing our “local happiness” we can make others unhappy. The struggle for one’s own “growth” in the cramped space of the material world is one of the main sources of all conflicts and sorrows on Earth.
There are various ways to avoid them. One of the simplest ones is a leapfrog expansion of the space available to man. For example, access to Space and exploration of other planets can, at a certain stage, eliminate the competition for a place under the Sun.
How can conflict be avoided? There are several possibilities to consider. For example, there is a space within us in which we alone are the masters - our inner infinite universe. The limit to this choice of path is self-cultivation in a monastery or in a yoga cave. But life requires the presence of conscious, highly spiritual people within society, not their isolation from it.
A more general solution is to expand the social space around oneself and not to forget that the development of this space is not for the sake of accumulating wealth (one cannot take it to the grave), but for the sake of making this space more harmonious and perfect.
Harmony and happiness at different stages of human life are achieved in different ways.
At the first stage, when the organism is growing and the personality is being established, happiness is achieved most easily due to the natural reserve of intensive growth and development.
At the second stage, when the formation of personality is basically completed, comes the stage of giving, the central stage of human life. At this stage, the state of happiness is achieved only when the personality expands its influence on the external world and, mastering all new spaces, transforms them according to the laws of inner harmony. In this case, such “expansion” does not cause aggression and opposition on the part of others.
At the third stage, when the main task of transforming the surrounding world is accomplished, the period of old age comes. It can bring happiness if there is an opportunity, for example, to bring up grandchildren. After all, by giving his love to the younger generation, passing on his experience and knowledge, a person strives to extend himself in time. The author believes that this is also growth, but growth in time space.
The Creator has envisaged the possibility for a person to find his state of happiness at each stage of life. And it is better not to violate this wise arrangement of life.
The author believes that the external task of man is to help life expand its range of existence beyond the Earth. If mankind realizes this external goal and begins to achieve it, it will become happier than it is today. At present, alas, it is mainly pursuing another goal - material well-being for the sake of well-being itself.
-
Paturi F. Plants Are Ingenious Engineers of Nature. Moscow: Progress, 1979. ↩
-
Tatur V. Yu., Komarov V. M. Anthropic Symphony // The Unknown. Moscow, Issue 1 (In Press). ↩
-
Sukhonos S. I. Russian Renaissance in the XXI Century. Moscow: Planeta (In Press). ↩
The third stage. Evolution of social systems
If we accept the thesis about the completion of evolution on the lower floors of the Biosphere after the transition of its maximum tension to the upper floors, then at a certain stage the Biosphere reached the limit of the possibility of development and growth of protein organisms. For animals, this is the size of 40 meters (no creature has crossed this boundary in the entire history of the Biosphere). Plants were able to reach a much larger boundary: trees - for 100 meters, lianas and algae - for 200 meters.
However, further development in the direction of increasing the size of multicellular protein systems turned out to be inefficient. So, Nature chose another way to continue evolution. Starting from some stage, it went the way of evolution of biocenoses, the minimum stable sizes of which start right after the threshold of maximum possible sizes for multicellular biosystems (hundreds of meters and more).
It can be PROPOSED that this transition from the development of the second large-scale interval of the Biosphere to the development of the third interval began even before the appearance of man. According to some considerations, it can be attributed to the period of 10…15 million years ago, when modern biocenoses began to form from the homogeneous environment of rain forests, which had covered the earth’s surface with a uniform carpet for tens of millions of years. The diversity of biocenoses emerged as a result of cooling, drying of the atmosphere, glaciation, and the appearance of savannahs and other natural-climatic zones.
In this case, we may be observing the last final stage of Biosphere evolution. After the construction of the Noosphere, life will go beyond the Earth, into the Cosmos, and the evolutionary focus will automatically move up the S-axis to the cosmic scale. On Earth, a completely different reality will appear - the Anthroposphere, which will be largely regulated and managed meaningfully by man. If all this is so, then the appearance of man marks the beginning of the realization of the next stage - the stage of creation of the TOTAL system of the Noosphere. The Noosphere should harmoniously include, firstly, all biocenosis systems, and secondly, it should be as internally perfectly organized as the human organism, for example, is perfect. After all, within the organism there are no wars of annihilation between the liver, kidneys, and heart. Inside the organism, if it is healthy, the laws of musical, universal harmony reign 1.
It is well known that within the human community for the last five thousand years no harmony has been achieved. There have been continuous wars and conflicts between societies of all levels, from families to empires.
If we approach all these events purely emotionally, the history of humanity development starts to make us sick. But if you turn on the logical apparatus, then, in the author’s opinion, partly all that happened was the result of the rapid evolution of biosystems on the scale of the third interval. The author is also convinced that when this evolution is over, such forms of social organization of the human community will be found, which will allow the society to function as harmoniously as any healthy organism functions.
EMPHASIS ON THE THIRD LARGE-SCALE FOCUS OF EVOLUTION SIGNIFICANTLY CHANGES OUR WHOLE ATTITUDE TO WHAT IS HAPPENING ON EARTH, IN PARTICULAR, TO WHAT IS HAPPENING IN THE HUMAN COMMUNITY.
First, it becomes clear why, using the organism of the first man as a basis for the realization of plans for the next stage of evolution. Nature sacrificed many of its previous achievements. As a result, man turned out to be biologically much less reliable than many similar organisms.
There is no need to expound this thesis extensively here; it has been done long enough and fully in many works. In particular, the upright position of man leads to many problems with the spine, skeleton, and organs. Physically man is weaker than many of his neighbors on the scale shelf, for example, monkeys.
The reason is simple: after all, in order to create a social stratum of being, it was necessary to prepare special “elements” for this purpose. From the animal base, such “elements” were created, which were intended to fulfill very, very specific functions, far from a simple struggle for survival. However, everything has to be paid for. The fact that human nature was loaded with functions and tasks not peculiar to the animal organism had to be paid for by weakening the purely animal properties of the organism.
So, man was created by Nature to fulfill a new task, which is beyond the power of any other species on Earth - the task to continue the ESTATHETE OF THE DEVELOPMENT OF BIOSYSTEMS, increasing their size by orders of magnitude.
Such “biosystems” are social structures. Throughout the history of civilization, both the number of social structures and their size have been increasing.
At the same time, there was a process of increasing the internal complexity of the structure of social systems. This thesis also, perhaps, does not require proof. Putting these facts among other facts of evolution of systems in the Universe, one can’t help coming to the conclusion that the focus of evolutionary development of the Biosphere is currently concentrated at the social level. The Universe is currently creating the next stage of systems evolution in the field of social space with the help and by means of man. Consequently, it is not man as a separate individual that is important and interesting for Nature at present, but HUMANITY as an increasingly complex structure of much larger scales. Man as a biological system is the OPERATOR OF THE EVOLUTION OF NATURE in this structure. If he violates all the laws of God, he becomes clay, a material to be neglected.
“And do not think to say within yourselves, ‘Our father is Abraham,’ for I tell you that God is able to raise up children to Abraham out of these stones.” New Testament, Matthew 3:9.
It is possible that the first people in the biological sense were even much more perfect than the man of today.
It is true that the average life expectancy of an individual has increased. However, this is most likely a consequence of a more perfect social structure than the biological one.
Therefore, one may not argue with some theories according to which man as an individual not only does not evolve over time, but even loses gradually many very useful properties. Even if this is indeed true, it only supports the conclusion that the evolutionary focus is at the present moment in history in an entirely different area of scale - where the social sphere of life is evolving. Just as many unicellular organisms once entered the more evolved environment of multicellular systems and simplified, specialized, and lost a number of their primary properties, so humans as individuals may lose a number of their primary properties as they become more and more densely integrated into the social organism.
Everything has to be paid for. It is impossible to create a more complex system without tweaking the primary elements, just as it is impossible to build a pyramid without hewing the stones.
Once again, let us return to the worldview significance of the above conclusion. It shows that from the point of view of the Universe, there is no task on the Earth at present more important for all its inhabitants without exception than the development of population forms of life in their PREDICTABLE form - SOCIAL. Therefore, the life of all individuals on Earth, including humans, is subordinated to a task more important than the preservation and development of their individual power and diversity, it is subordinated to the task of development of the metasystemic level for organisms - social. If this process is manageable (or at least has a logic of development), then the task of all mankind is to move to its CONSCIOUS IMPLEMENTATION.
FURTHER REASONING
Herein lies the TRAGIC UNEXPLORED GOAL. Every individual on Earth strives, by virtue of the instinct of preservation and reproduction, for individual well-being and self-preservation. In this, he is certainly right, for it is impossible not to obey the perfect laws, which are laid down by Nature as a result of several billion years of evolution.
But if resources are limited, some people tend to take them away from others. Overlaid on this desire to prolong the lineage leads to a tendency to create endless (individual, family, clan) stocks of resources that could provide security for descendants for many generations to come.
This, by the way, makes man very different from other animals, which do not have the ability to create unlimited reserves. Man often displays the instinct of a social predator - to take everything possible from other people and appropriate it for himself.
Because of this circumstance and the underdeveloped social construction of society, people who were not highly spiritual, but adequately organized, most often found themselves in power. These people were not so perfect from the point of view of absolute harmony, but they were more appropriate to the underdeveloped social organism they ruled than spiritual and intellectual leaders. Hence the phrase, “My kingdom is not of this world.”
However, the goal for man as an element of the Biosphere and the Universe has changed fundamentally, and this former logic is in sharp contradiction with the logic of the next stage of the evolution of life on Earth. Nature has set before man an external goal, which she has never before set before any of her species - to continue evolution on new floors of the large-scale ladder of the Universe, to continue evolution on the social level. This can only be achieved by increasing the size of social systems and complicating their internal organization. In this case, contradictions arise between the old and new ways of human behavior.
First, increasing the size of social systems is impossible without increasing their internal population.
Recall the biblical “Be fruitful and multiply!”
Consequently, if as a bio-individual each person can strive to destroy other people - competitors for resources, then as a socio-individual each person should strive to increase the number of other people on Earth.
Secondly, the task of increasing the complexity of the internal structure of social systems is in diametric contradiction with the aspiration, laid down by the animal prehistory of man, to the personal absolute power of the leader in the pack.
The organismal EGO (commands to it are sent by two instincts: preservation and procreation) of man tends to simplify the system of power to the utmost, unifying its elements to the position of cogs.
The external social goal sets before the individual the opposite task - to achieve maximum perfection of the internal structure of interactions in the society, and this requires an increase in the variety of “elements”, and here with “cogs” nothing complicated can be created.
So, already in these two examples, we see that man is in a very difficult and internally conflicting position. All his genetic experience, all billions of years of previous organismal evolution push him to one model of behavior, and the task set before him by the Biosphere leads him to the opposite model of behavior.
In ego behavior, there is no insidiousness of dark forces, but the inertia of the old, through which - in the struggle with oneself, with one’s animal instinct - a new tendency breaks through, a new man is BORN A HUMAN OF A NEW FORMATION - A MAN 0F CONSCIOUSNESS borN.. Modern man is the arena of this struggle. Yes, man has been very “lucky”: he has fallen on the fracture of two global stages of evolution of life on Earth. If the first stage lasted for billions of years, the second one has just begun. It turned out that everything perfectly suitable for the animal world is often completely unsuitable for the human world.
Nature, considering such a difficult position of man in the evolutionary process, compensated him for this damage:
- has completely subjugated the entire biosphere;
- has made it possible to derive pleasure from entirely intangible sources: spiritual, intellectual, etc.;
- and even reinforced his difficult role with the possibility of sexual pleasure regardless of the need for procreation.
For most animals, sexual intercourse is a rare event that occurs once or twice a year, during the mating season. Even in rabbits, which are known to breed at a tremendous rate, the female does not let the male near her after conception has occurred. Humans, on the other hand, have always had the possibility of almost uninterrupted sexual pleasure. Perhaps this is Nature’s compensation for population (social) stresses, to which humans are subjected to a much greater extent than any other animal species.
So, one of the most important differences between man and animal is that while the animal world was created by the Biosphere for the sake of evolutionary development of individuals, for the sake of biological evolution, the human world (for the first time in the history of the Biosphere) was created for the sake of transferring the center of evolution to the social environment. Thus, evolution with the help of man continues its movement upward in the large-scale structure of the Universe.
Apparently, from the point of view of world culture, there is nothing new in our conclusion. Some (if not all) world religions place the values of the human community much higher than individual values. Since the author is familiar with only one of them - the Christian religion - this statement is not in doubt with regard to this religion.
The kingdom of God is the primary goal of any Christian. Everything else must be subordinated to this primary goal. The whole Gospel is permeated with this basic thought, although the question of the possibility of establishing the Kingdom of God on earth is not simple.
The ministers of the church understand perfectly well that it is almost impossible to make our world perfect. Therefore, from their point of view, attempts to build Paradise on Earth are doomed in advance and only discredit the very idea of the Kingdom of God.
The last example is the attempt to build a communist “paradise” in the USSR. However, system analysis shows that not everything is so hopeless: understanding moral laws on a logical level can lead society to such a state that most people realize that it is much more comfortable and pleasant to LIVE REGULARLY. All the more so because the requirement to obey moral laws is equal to the requirement to obey safety rules in such a complex enterprise as life.
The author is internally convinced that before joining the community of other civilizations, mankind will still have to go through a “quarantine period” (according to my calculations - this is the III millennium), when it is necessary to establish a harmonious order in the socio- and biospheric structure of the Earth.
Earlier we showed that etheric (ideal) and matter (material) parts of the Universe complement each other, without one of them the existence of the other is also impossible - they are just different overtone layers of the integral universal harmonious being.
So, if we ask ourselves what is the value of the conclusions drawn here, the author believes: that they, without contradicting global values, are obtained in a strictly logical way within the framework of the proposed model.
I hope that thanks to this, science gets an additional basis for justifying the ethical principles of existence. After all, science (not to be confused with scientists) has always been fundamentally outside ethics, and outside moral values, because it could not find these principles in the general (not only human) laws of nature. Now there is an opportunity to substantiate ethical and moral principles, based on the model of the Universe, built by natural scientific methods.
The social structure of the Noosphere is being formed at present. It is formed by a network of complex relationships, which is established in the process of society development between people and their associations. The sociosphere is a three-component structure, which includes: society, the technosphere, and the agricultural sphere. The latter appeared in the Neolithic Age, while the technosphere has always accompanied proto-humans, from the first spear, fire, and stone; regulated by laws, habits, traditions, and rules. The structure of interaction between individuals and their associations. It also develops according to certain laws, becoming more and more complex.
If we draw a parallel between the development of the technosphere and society, it is possible that in the field of social laws, too, human creativity only repeats what nature has already invented earlier.
In fact, is not a primitive society like an amoeba that seeks a space with a larger feeding ground? Is it a coincidence that capitalist society in its first stage of development resembles a predatory beast that preys on the weaker members of the animal kingdom?
This topic is so grandiose that we cannot even touch upon it in this paper. Here we will only note that the structure of social relations has evolved from a null-dimensional structure
(primitive communal society) through one-dimensional structure (slave society), two-dimensional structure (feudal society), three-dimensional structure (capitalist society), and came close to four-dimensional structure (new society). This issue was partially discussed in the author’s work “Russia in the XXI century” 2.
These examples once again show that the main task of the human community is not to satisfy the needs of each of its members individually, but to create a new global bio-techno-social system that would occupy higher levels on the scale ladder of nature than man himself. In other words, the task of the human community is the development and improvement of the community itself. The nearest goal is the creation of a new kind of intelligent system on Earth - the Noosphere.
Here the meaning of the fact that in thirty to fifty years the number of people on Earth may reach the order of ten billion (\(10^{10}\)), which corresponds to the value of one of the fundamental dimensionless constants of the Universe, is revealed in a new way. Let us remind again that this is the order of the number of neurons in the human brain. Maybe, when mankind crosses this cherished numerical boundary, it will finally turn from an unconscious amoeba-like system into a reasonable thinking whole, into a kind of Solaris? And will it pass from collective-conscious existence to collective-conscious one?
FURTHER REASONING
If this is true, if humanity has indeed come close for the first time in history to a very important threshold of change beyond which quantitative growth will lead to a NEW QUALITY OF ALL CIVILIZATION, then the difficulties that humanity has encountered on the threshold of this TRANSITION are understandable. Humanity has only a few billion more to grow to reach the magical quantitative threshold that will allow it to transform into a NEW STATE.
When this step was only a few decades away, all the forces of the old, all the inertial tendencies, all the laws of the billion-year animal existence of the biological basis of mankind began to resist. The old always resists the new, sensing its impending secondary nature. Most likely, the new conscious humanity will no longer need many of the laws that the animal world of the Biosphere lives by. These laws will either be discarded into the past, as a spent stage is discarded by a rocket going out into space, or subordinated to higher laws. There is no point in regretting this, just as there is no point in cursing these old laws by which life on Earth evolved for billions of years. They were as justified as they were necessary to maintain equilibrium in the rapid forward movement. Man could not discard all the laws of the animal world at once.
Thus, a child who is just learning to walk cannot immediately stop crawling on all fours. Yes, mankind, like a child, stood up many times, made trial steps, then fell and returned to crawling on all fours, and fell again and again. And who knows whether at the turn of the millennium it has learned to walk firmly on its feet, straightened up in all its HUGE EVOLUTIONAL GROWTH, or whether it still has to stumble and fall several times. It is necessary to understand that in any case, the farewell to childhood, with onesies and diapers is inevitable, the transition to a new state of life in society is inevitable - purely human, therefore, reasonable, because the first thing that distinguishes man from animal is reason.
In recent years, mystical literature has been widely distributed in Russia, and schools of psychism, healing, and other unconventional movements have begun to appear. As a rule, many schools and groups fall out of ordinary social life, creating their closed inner world. Their main distinguishing characteristic is a strict dependence on a teacher (healer, seer, preacher, etc.), i.e. on a single strong personality who possesses extraordinary abilities (knowledge, possibilities…). The demonstration of these superpowers strikes the imagination of students and listeners, and since they are all promised the mastery of the same superpowers, they begin to follow the leader (teacher) in many matters of life almost unquestioningly.
Moreover, literature began to appear, in which it is stated that in ancient times (even before the Egyptian civilization) on the Earth there was a society of Atlanteans (Hyperboreans, etc.), able to fly, move heavy stones with their eyes, travel to other worlds and so on.
As we have written, there is a distinction in terms of scale hierarchy between the psychophysical impact of an individual strong personality and the social impact.
This difference consists, apparently, of the fact that the former operates on a much smaller scale, i.e. the psychophysical “field” is scale-local, while the social field is scale-global. That is why the former can be used only by small groups of priests, and the latter by the whole mankind. Otherwise, all the extraordinary psychophysical possibilities, which from time to time appear brightly in rare representatives of mankind, would be fixed in society as a result of natural selection, and they would be possessed by everyone.
Since this does not happen, there are two explanations. The first of them is religious: God, having given man extraordinary abilities in the beginning, took them away for his sins. The second explanation is scientific: natural selection did not lead to the consolidation of amazing properties in society because there is no human evolution, but only regression of man as a species.
Both explanations do not satisfy me, so I tried to find a third one, based on the discovered regularity of moving the focus of evolution along the S-axis. Its meaning is that potentially every person is a magician and wizard endowed with incredible psychophysical power, but since the main task is to build a harmonious population, social scale level, this power of people turns out to be excessive. Perhaps, after reaching a certain level of social development, these reserves will be revealed, but they will be subordinated to the HARMONIC SOCIAL CONSCIOUSNESS.
In any case, the author wants to believe it. So far the Lord allows only isolated examples of such power, giving it only to a very limited number of people on Earth. By doing so, He shows that mankind has a reserve that has not yet been opened. But by showing, He does not allow its mass utilization. Just as children are shown a fire from afar, but are not allowed to use matches, so we are shown “miracles” from afar, but are not given matches, so that “children” do not turn individual beacons of fires into the glow of an all-consuming social fire.
Hence a very important CONCLUSION: the level of power of mankind (as well as of each individual person) is REGULATED first of all by the LEVEL OF HIS SOCIAL MILLENNESS.
By the way, this concerns not only the regulation of psychophysical forces, but also the forces of nature, which mankind manages to master. The author, for example, is deeply convinced that as soon as it is possible to create a harmonious noospheric community, immediately scientists will be able to discover and master the inexhaustible source of etheric energy.
Another theme that takes on a new connotation in connection with the hypothesis of moving the focus of evolution from the point \(10^{2}\) cm to the point \(10^{7}\) cm is the relation of the thinking and moral individual to the “always imperfect” society.
God created man in His image perfect and put in his soul all the laws of harmony of the Universe, deviation from which any man can sense by the alarming signal of conscience. He set a similar task before man: to create an equally perfect social organism on Earth - “SOCIUM”. Man had to start from scratch. He had to build social systems, starting with the simplest and most primitive examples, although he was not left without a clue and without a plan. The idea of the Temple is within each of us, the way to it is in religious teachings. Is the preaching of love enough? What about justice? With natural selection (competition) and with the exhaustion of resources?
Therefore, even though the vast majority of people on the planet belong to one or another world religion, the social structure of society is far from the ideal system, far from harmony and perfection. Hence wars, prisons, mafia, and other troubles. The man himself pays for this imperfection and has to live inside this imperfect structure and obey it in many respects because it is a CONTROLLING METASYSTEM for him. Thus a paradoxical situation is created: the most perfect creation of Nature - man builds for himself a social “dwelling” much less perfect than himself. Moreover, he builds a “dwelling” that constantly deforms his inner harmonious world.
Naturally, the simpler a social construct is, the simpler its managers - people in power - should be. Since the social system has never achieved harmonious perfection in the history of mankind, so the people who are more adapted to this imperfection have always been in power. Therefore, spiritual and intellectual leaders of all times and peoples have always been in opposition to power, often in conflict with it, always criticizing it, always dissatisfied with it.
Thus, at one of the social poles, there is a system of power always adapted to a particular stage of development and therefore imperfect from the point of view of ethical norms, and at the other pole of the social system there is spiritual power. The latter is far removed from the material power, because it should carry in itself the chamber tone of pure harmonic perfection, which is inherent in every human being from birth and which must be preserved under any system of power.
We see that the tasks of temporal power and spiritual power are very different. The former serves actual time, the latter serves eternity. Intellectuals flounder between these two poles, trying to improve worldly power, trying to build a system of relationships in society that would be closer to the spiritual Temple.
So, the PARADOX of the SITUATION is that the less perfect social system dominates over the more perfect individual structure of each person. It would be like if fences were made of the latest computers. And although the inner world of man is more harmonious and perfect than the outer, social world, the social world is the first on the list of priorities of Nature’s construction, because it is the next floor, the next level of creation. Therefore, the social world is potentially stronger than the inner world, the world of the individual, but at present it is less perfect simply because it is in the process of construction.
There is the ONLY GLOBAL EXIT from this fundamental contradiction - the creation of a social world as perfect as the spiritual world. If this succeeds, there will be a great resonance of the two large-scale levels of humanity’s development, which will lead to its unprecedented flourishing. After all, at present the lion’s share of the internal energy of all people and the lion’s share of the external energy of all mankind is spent on overcoming social contradictions. The entire history of civilization testifies to this very fact.
There is no need to prove this thesis. Let us recall at least that in the entire history of civilization there were only a few days when there were no wars somewhere.
Note it is unrealistic to solve the problems of social structure only by methods and techniques peculiar to the inner world of man because the principle of large-scale discrepancy between the two levels comes into force. It is useless to simply call: “Guys, let’s live friendly!” Such appeals do not affect the social world precisely because they are taken from a more perfect but lower level of interactions. Social problems can only be cured by social methods.
Once in an imperfect social system, each person’s harmonious world becomes distorted as he or she interacts with it. For many people, the only salvation in this case is religion, which allows a person to remember - i.e. to remember his or her divine essence. Then man begins to behave in some situations contrary to animal instincts, contrary to social rules, for example, sacrificing to his neighbor.
Religion, understood as a reciprocal connection with the Creator, is indispensable for every person, no matter how educated he or she is, because it keeps him or her in touch with the Eternal, with that which cannot be understood by reason and logic. An attempt to build a perfect world without constant connection with God is doomed to failure. In any case, such an experiment in the twentieth century in Russia was put very seriously and with extremely high costs.
The negative result is obvious. But it is naive to trust in the solution of all problems only with the help of religion. The two-thousand-year experience of Christianity has shown this more than clearly.
CHRIST in his sermons gave an IDEAL ETHALON OF RELATIONSHIPS among men, but from that time to the present day there has not been a single nation or state that has faithfully and strictly followed all of his commandments. Does this prove the “unreality” and “detachment” from reality of the doctrine he left behind? Certainly not, just as a trough dug on the site of a future building does not prove the unreality of the architect’s plan. Certainly, if this trough has to be dug by hundreds of generations of people, then, dying in it, many people ask in anxiety: “Will this building promised by our architect ever be built?”
What can you do if the construction project requires time several orders of magnitude longer than the life expectancy of a single person. There is no time machine to fly to the future and make sure that everything is not in vain. But there is a way of faith and a way of scientific comprehension of regularities of society development. Both ways allow us to see a distant goal and, having rolled up our sleeves, to take up the shovel and pickaxe again.
Yes, society at all times has been far from the ideals of the inner world of man. However, ideals are a plan, a project of the future world of people, and the history of society is a construction site with all its problems. As long as we live in these social “intermediate” constructions, we have to put up with their shortcomings. Immediately introducing all the ideal laws of existence is like bringing expensive furniture into a building that is not even covered with a roof yet.
Terrible, for example, is the role of the executioner in society, who is obliged to execute criminals according to the verdict of the court, terrible is the role of the wardens in prisons, who lock living people in cage-chambers.
What would happen if tomorrow all the executioners, wardens, and tax collectors gave up their jobs? Would the world become a better place? Obviously, anarchy will come, the fruits of which the Russian people have already experienced many times and have seen that bad order is still better than any disorder. Therefore, the teachings of Christ should be accepted as the Way, as the Goal, as a Beacon in the world of social imperfection.
Since every human being, created perfectly in the image and likeness of God, as he grows up and immerses in the imperfect social world becomes distorted in its original basis, and goes further and further away from the ideal harmony of the Universe, the connection with God is necessary all the time, it is this connection that allows us to feel the harmony of this world. This feeling can be realized in the social reality only by walking the thorny path of step-by-step IMPROVEMENT of the social world, its difficult REVOLUTION.
If we look at this problem from the point of view of the ideas developed above about moving the evolutionary focus along the S-axis, then the PERFORMANCE OF HUMAN NATURE GIVEN FROM GOD, IT IS NECESSARY TO TRANSFER IT TO A HIGHER RUNG OF THE LADDER OF NATURE, IT IS NECESSARY TO BUILD AN EQUALLY PERFECT SOCIAL SYSTEM - “THE KINGDOM OF GOD ON EARTH”.
This is not a utopia, but the main task facing humanity as a whole and each of us individually. Try to evade it, and you will be sent for melting down as a useless element for the great universal process, as construction waste.
Let us repeat: this construction cannot be completed in one human lifetime. This construction has its own higher plan, which we are hardly even well aware of. There are many stages in this plan, and at each stage, as in ordinary construction, adequate materials, techniques and mechanisms must be used. We cannot, however, transfer the methods of laying a foundation to the stage of building a roof or finishing work. This construction requires from each of us very concrete and specific work at each of the stages - precise actualization in time of each site. It does not allow treading on the ground, and does not allow inertia in methods and techniques. What was good yesterday, when laying the foundation, is no longer needed today, when erecting the walls.
If some of the human builders do not understand this and try to keep everything unchanged, they are removed from the construction site. People who try to impose finishing works on everyone at the moment when the building frame itself is not yet built are also removed from the construction site.
These analogies are good in that they allow us to understand why even the most perfect social systems created in the past have deteriorated and disappeared. They have fulfilled their role in a work that has been going on for thousands of years and will end, at least not tomorrow, but at best in 1,000 years.
-
Tatur V. Yu., Komarov V. M. Anthropic Symphony // The Unknown. Moscow, Issue 1 (In Press). ↩
-
Paturi F. Plants Are Ingenious Engineers of Nature. Moscow: Progress, 1979. ↩
Community of extraterrestrial civilizations
So, in the previous section, we determined that the focus of evolutionary processes for humanity and for the Earth is currently located at the S-axis point with a coordinate close to \(10^{7}\) cm. Of course, this point is only the median of the region that occupies the interval from \(10^{4.5}\) to \(10^{9.5}\) cm (see Fig. 3.1). Since it is the center of the area on the S-axis that has the most stable position (such sizes have national states like England, Germany, etc.), the question arises: is it possible to create a similarly stable WHOLE community of the planet — NOOSPHERE?
The Noosphere has the dimensions of the Biosphere, i.e. the dimensions of the Earth, \(\sim10^{9}\) cm. If the Biosphere exists as some dynamically interacting community of more stable biocenosis (their average sizes should be in the range of 100…1000 km according to modeling considerations), then the NOOSPHERE IS THOUGHT OF AS A WHOLE SYSTEM, ALMOST A LIVING INDIVIDUAL ORGANISM. However, in the SWS model, the Noosphere as an integral system is located in a very unstable zone of the intersection of the SWS and the S-axis. The nearest more stable size is the \(10^{12}\) cm size.
However, it is possible that the stability of the Noosphere will be ensured by “flying in the wind of change”, i.e. by continuous evolutionary development. Here we have a model image of a tennis ball hanging steadily over the hatch, from which the air blows.
An even more stable size is \(10^{17}\) cm. The next stable size is \(10^{22}\) cm. What might these milestones mean for the further development of life?
The first boundary is a size close to the Earth’s orbit around the Sun (\(\sim10^{12}\) cm). Consequently, we can talk about the creation of some space civilization of the first level within the asteroid belt*.* It is such a civilization that should have more internal and external systemic stability than purely “terrestrial Noosphere.” This may be one of the Earth’s goals of going into the Cosmos.
The second boundary. Even more stable may become a civilization that will occupy the entire space of the Solar System, up to its outskirts — \(10^{17}\) cm. Moreover, it may unite several space civilizations closest to Earth’s civilization into some very stable space community.
Third Frontier boundary. And finally, one more stable level — the community of galactic civilizations, which will unite all civilizations of the Galaxy — \(10^{22}\) cm. However, all these boundaries of stability are purely mechanical extrapolations. Perhaps, the true path of further development of mankind will lie in completely different spaces, which modern science today does not even suspect.
Conclusion
So, we have considered a unique phenomenon of the Universe - its LARGE-SCALE HARMONY. We have seen it in the statics of symmetry of the distribution of objects on scale levels, in the similarity of three giant areas of scale space to each other, in the dynamics of movement along the scale axis of various processes and systems, in evolutionary regularities. And we are convinced that the LARGE-SCALE HARMONY OF THE UNIVERSE IS AN EXCLUSIVELY GENERAL, UNIVERSAL, AND IMPORTANT LAW OF NATURE.
It was both very interesting and very difficult for the author to investigate the laws of the scale symmetry of the Universe. It was interesting because I almost all the time felt myself a pioneer, and the joy of discovering new very beautiful laws of nature quite compensated for all the difficulties of writing the book; difficult because I had to move step by step from known concepts and phenomena to new ideas about the Universe, had to enter new areas of natural phenomena practically by feel.
In the second part of the book, I tried to give at least some theoretical model of the found classification and systemic regularities. Here I had to enter the realm of fantasies and speculative constructions. It was shown that scale symmetry is the result of the law of scale harmony. I hope, the reader will not judge these constructions too strictly, because these are only the first steps in the direction of creation of the UNITED THEORY OF THE SCALE FIELD OF THE UNIVERSE.
I leave that task for future theorists.
In the third part of the book, I tried to look at the history of the Biosphere and human development through the prism of large-scale regularities. It seemed to me that this opens up new facets of old problems and concepts.
In general, I understood my task in writing this book very simply - to open as wide as possible the door to a perfect new world of laws of large-scale dimension for as many people as possible.
Therefore, by giving many interesting examples, I have endeavored to arouse the same burning interest in this subject that has possessed me for the fourth decade. If I have succeeded in this, at least to some extent, I can consider myself a very happy man.
Conclusion by translator
Dear reader, your journey through this remarkable book has come to an end. A quarter of a century has passed since its first publication. During this time, the book has gone through four reprints in Russian, and now, at last, it is available in English.
The English edition differs significantly from the Russian versions. It is the result of years of reflection and the ongoing development of ideas presented in previous editions. Some of these ideas have served as the foundation for new publications. Tragically, Sergey Sukhonos’s life was cut short in a car accident on January 30, 2025, bringing his scientific work to an untimely end and leaving several of his conceptual developments unfinished.
While preparing this English edition, he and I worked closely to refine and systematize the book’s terminology, striving for greater precision and logical coherence. During this process, we introduced the concept of the S-Dimension, aimed at broadening the understanding of multidimensional reality. I proposed renaming the S-Dimension to the “Primordial Dimension,” believing that this term more accurately reflected its essence and aligned better with the logic of scientific description. Sergey Sukhonos supported this idea, and we began adapting the terminology accordingly. However, his sudden passing prevented us from completing this stage of our work.
In the absence of his final approval, I felt it necessary to retain the original term—“Fourth Dimension”—in the text to avoid any unauthorized reinterpretations that might diverge from his original concept.
Thus, this English edition not only represents the last published work of Sergey Sukhonos but also serves as his first introduction to an international audience. Over the past twenty-five years, he developed several original theories in the fields of the philosophy of history, futurology, and the concept of civilizational development. However, his work remains unknown outside the Russian-speaking academic community.
In the preface, I highlighted his significant contribution to the tradition of Russian cosmism. However, a deeper analysis of his writings suggests that he evolved into a cosmistic thinker focused on developing a universal theory of Earth’s civilizational progress and humanity’s role in the universe. Within this framework, he explored historical cycles, the patterns of scientific and technological advancement, global future scenarios, and sustainable development strategies.
One of the key aspects of his scientific and organizational work was the creation of an interdisciplinary intellectual community dedicated to studying macrohistorical trends and formulating conceptual models for global development. His research on historical cyclicity and the evolution of sociocultural systems represents a substantial contribution to modern futurology and civilizational theory.
Sergey Sukhonos’s legacy extends beyond his scientific works—it includes the community of researchers, philosophers, and inventors he brought together, who are committed to continuing his work. Translating and adapting his ideas for the English-speaking academic discourse is an important task that can help broaden the discussion of his theories.
This edition includes a list of his key works in Russian, which can be translated should there be interest from international researchers. We welcome open dialogue with readers who wish to explore the legacy of Sergey Sukhonos and his followers.
Alexander Astafiev MD, Ph.D, MBA.
Another books of Sergei Sukhonos available in Russian
- The Eternal Soul: Five Questions for World Religions
Publisher: Moscow New Center, 2007 - The Universal Power of Morality
Publisher: Moscow New Center, 2005 - Gravitational “Donuts”, or “Ethereal Whirlwinds Hover Over Us”
Publisher: Moscow New Center, 2007 - The Boiling Vacuum of the Universe, or The Hypothesis on the Nature of Gravity
Publisher: Moscow New Center, 2000 - The Logic of Human Evolution
Publisher: Economy, Moscow, 2008 - The Scale Effect: An Unsolved Threat
Publisher: Moscow New Center, 2001 - Metacivilization
Publisher: Moscow: Books on Demand, 2011 - Theory of Evolution of Hierarchical Systems: The Proportional Universe
Publisher: Delphis, Moscow, 2015 - The Relay of Civilizations
Publisher: Economy, Moscow, 2011 - Theory of Time Relativity: What Is Time? The Hierarchy of Temporal Processes
Published in digital format, 2022 - Ten Forms of Life in the Universe
Publisher: Tion, 2022 - Where Is Humanity Heading?
Publisher: National Education, Moscow, 2024