S-wave of stability
Thus, we have established that with sufficient accuracy (in some cases - with incredibly high accuracy) the main objects of the Universe are located on its scale hierarchical axis not chaotically, but strictly ordered, in 5 orders. If we take a closer look at the revealed series (see Fig. 1.4), another regularity draws attention: in some cases the core of systems and their structural superstructures alternate through five orders. It is PROPOSED that there is another periodicity with a step of ten orders, and we are actually dealing with two series: nuclear and structural, which are shifted relative to each other by five orders.
Since the nuclei of objects are much more stable (in the most general sense of the term) than their structural superstructure, the identified two rows can be placed on the diagram one above the other. By this arrangement we strengthen the intuitive certainty that the nucleus (of an atom, star, galaxy, etc.) is more stable to external influence, exists longer and is less subject to transformations than the structural superstructure itself. Let us once again draw a diagram of the location of the selected main objects of the Universe on the S-axis (in the future, the validity of this construction will be confirmed by empirical data).
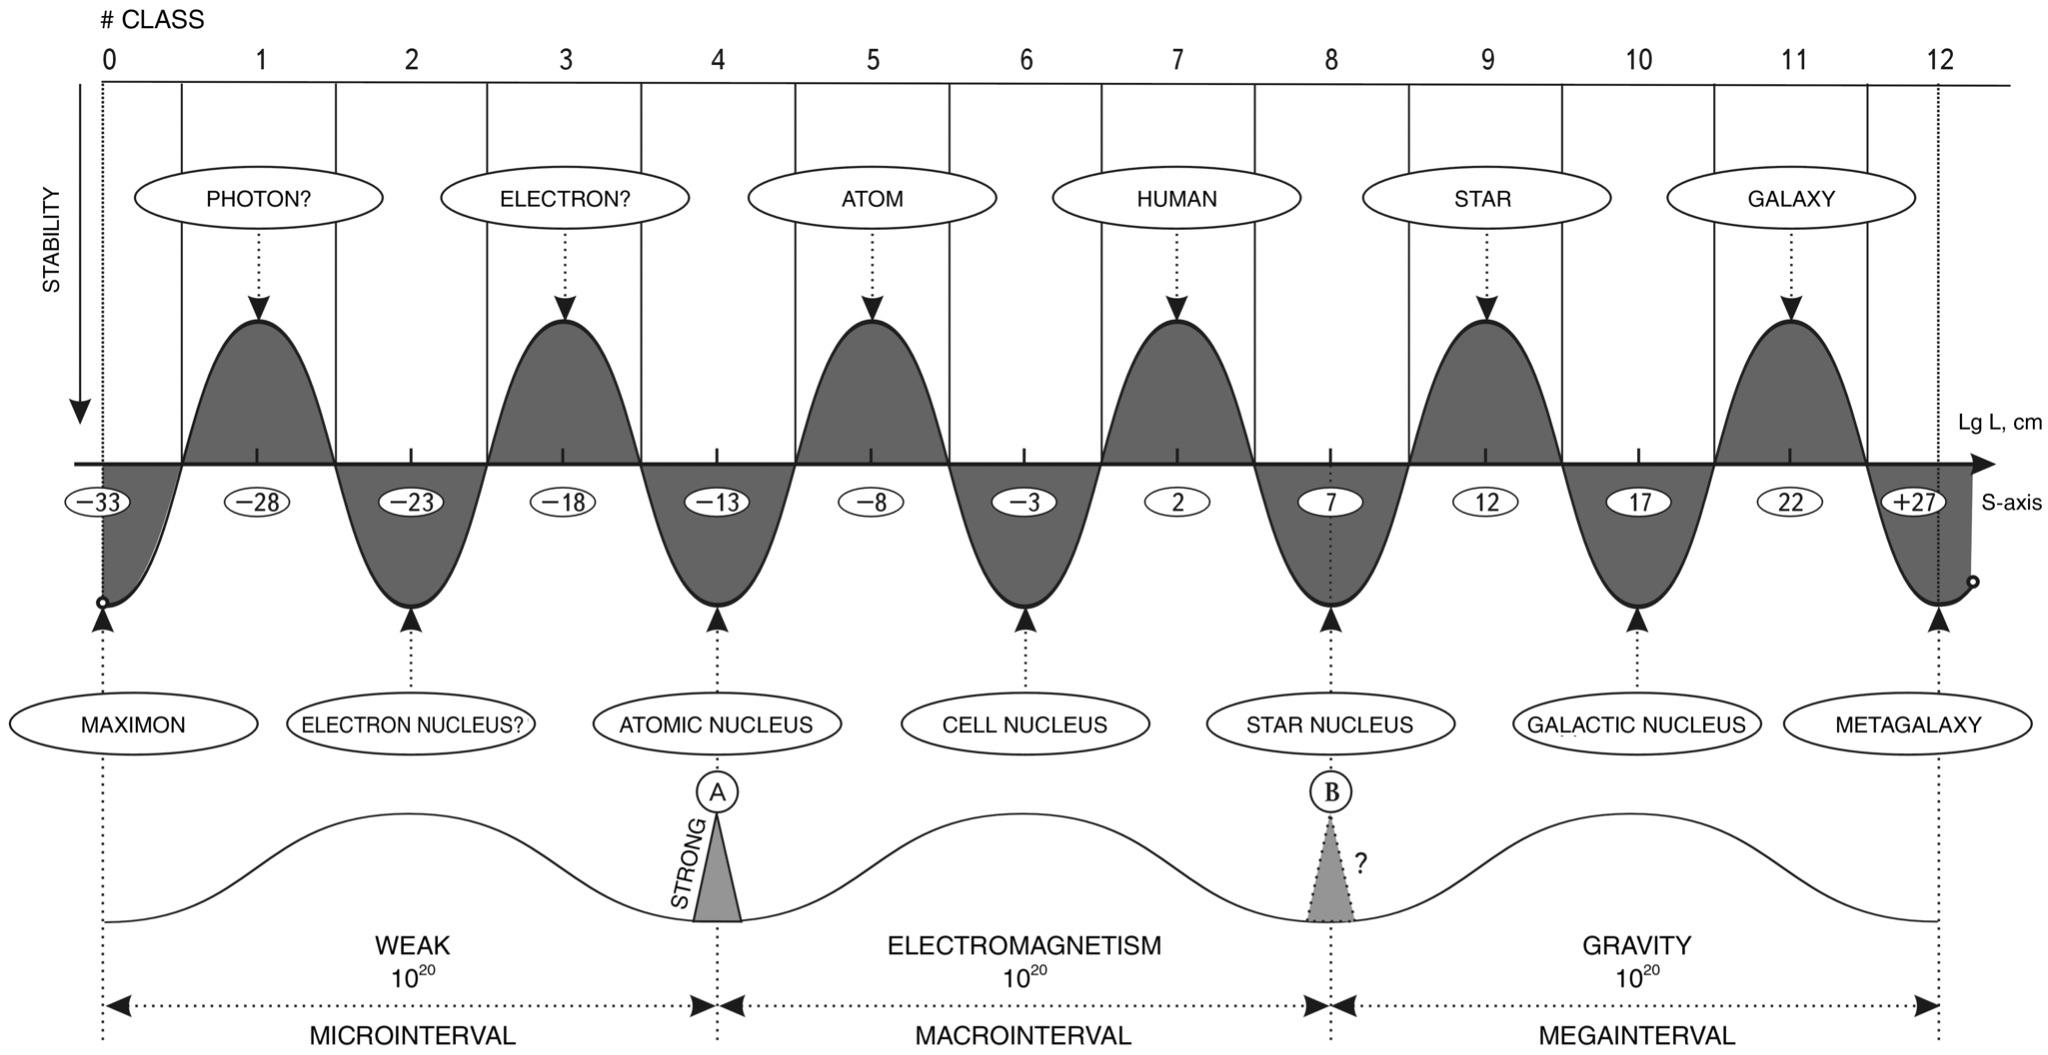
Fig. 1.7. Quantitative-qualitative scale-stability diagram, named S-Wave of stability (SWS) in 1979
Let us note in advance that the scale classes introduced by us are common for all kinds of systems of the Universe. One and the same scale class is filled with objects with different properties. For example, class No. 8 is occupied by planets, star cores and biocenosis. At the same time, the scale boundaries of these objects are invariant with respect to their material filling
In the diagram, purely conventionally for reasons of convenience, it is assumed that stability increases downward along the Y-axis. In this case, the entire nuclear series is located below the S-axis (see Fig. 1.7), and the structural series is located above the S-axis.
The upper and lower points will be connected by a sinusoid, which, as it will be shown further, turns out to be a very convenient model reflecting many system properties of the Universe objects. Due to the fact that in the troughs of the sinusoid the stability of objects in general is higher than at the crests, we will give the obtained MODEL the name “Stability Wave” (SW).
This model carries, among other things, the following semantic load: the main objects of the Universe are not only located along the S-axis in a strictly ordered, periodic manner, but also the periodicity of their location has a VOLUME HARMONIC CHARACTER.
However, along with the obvious distinction between nuclear and “supranuclear” or structural objects, we see two systems that seem to fall out of this pattern. We are talking about humans and cells
At first glance, their placement in the general alternation of nuclei - structures is incorrect. On the other hand, a cell corresponds quite well to the “nuclear” status in relation to a human being, because it contains the main structural information about him. True, the concept of “nucleus” is more habitually considered as one single nucleus, which is located, moreover, in the geometrical center of the system. Here we are rather talking about a polynuclear structure. Let us leave for now the legitimacy of such placement without explanation and see what conclusions we will come to as a result of the whole study. However, before moving on, an additional METHODOLOGICAL EXPLANATION is necessary.
The resulting diagram (see Fig. 1.7) is just a semi-metric classification scheme, in which the SIZE OF SYSTEMS (horizontal axis) is defined with the highest possible accuracy, and the stability OF SYSTEMS (vertical axis) is a conditional qualitative measure.
Recall that in classification works such qualitative parametric spaces are often used quite successfully. Take, for example, the well-known classification of galaxies - the Hubble diagram (see Fig. 1.8). In it, galaxies are ordered by type, and the types are connected in a highly conventional qualitative sequence in which metrics and justification for the arrangement are missing both horizontally and vertically. This simple scheme, despite numerous attempts to modify it17 , has survived for decades and is still used in almost all survey works on galaxies.
The quantitative-qualitative diagram we have constructed (see Fig. 1.7) at this stage of the analysis of scale symmetry is no more than a conventional scheme. We need it in order to begin to distinguish the objects of the Universe not only by their sizes, but also by other criteria. At the same time, it is necessary to warn in advance that the main goal of this work is still the study of regularities of distribution, “motion” and change of objects along the S-axis (along the logarithmic axis of sizes). It is in this direction that the author has made the greatest efforts and obtained the most accurate and stable scientific results.
However, in order to compare objects with each other, often one dimensional parameter is not enough. Then there is a need for additional attributes and properties that are not directly derived from dimensions. Therefore, this paper is woven as if from two very different methodological lines.
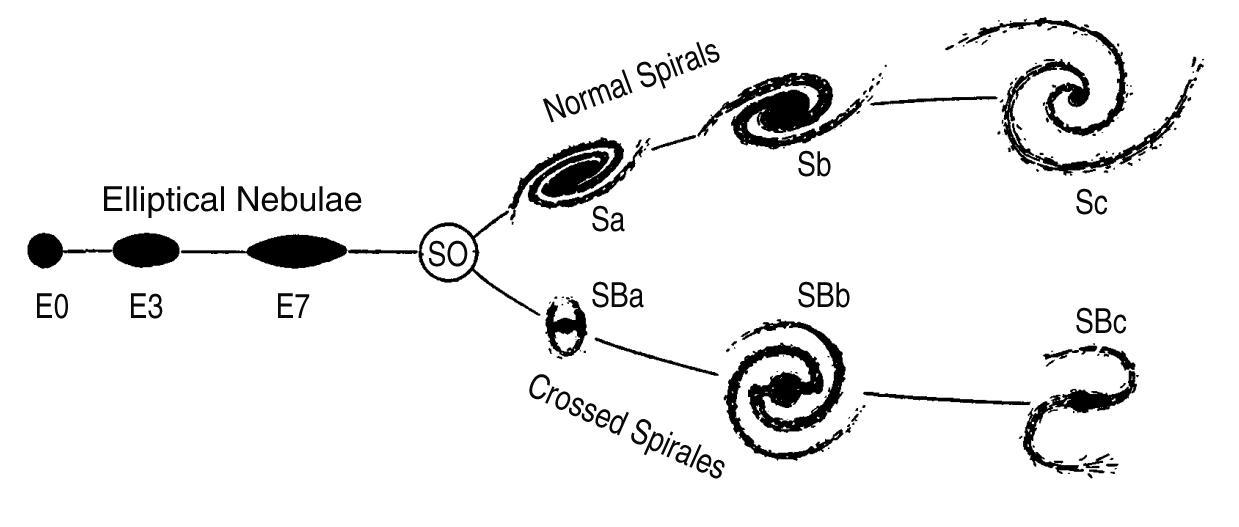
Fig. 1.8. The first and most widespread chamberton classification of galaxies by E. Hubble
On the one hand - very precise determination of coordinates on the S-axis and creation of a MODEL PERIODIC grid, in the nodes of which important properties of matter change, the most widespread systems are located, etc. On the other hand - non-metric intuitive division of objects by their properties.
Let us return to our wave model (see Fig. 1.7). The construction of the S-WAVE of stability (SWS) was a very long, painstaking process, which can be compared to the reconstruction of the appearance of an unknown ancient animal based on several fragments of its skeleton. And only the complexity of the comparison of facts, their multifactor check for consistency allowed us to confidently assert that the S-WAVE of stability is not a figment of imagination, but ONE OF THE PHYSICAL REALITIES OF OUR WORLD. In further sections of the book this will be shown with all possible completeness.
The S-WAVE of stability (SWS) makes it possible to place nuclear and structural forms of matter on different scale levels. It allows us to give a qualitative comparison of their relative stability. In addition, the points of intersection of the SWS with the S-axis, as revealed by the analysis, are dimensional boundaries for the main classes of the systems we have chosen.
The S-WAVE of stability has a number of other additional informational properties, which, as will be shown below, lead us to the regularities of large-scale dynamics in the Universe. It should be said that many successful properties of the wave model make it simply an indispensable tool for preliminary analysis of large-scale regularities in the Universe.
That said, it should be noted that it does have some very unprocessed areas.
First, it is the interval from -33 to -13, the so-called Dirac basement. By placing there the electron and the photon, the author has obviously gone to arbitrariness, because there are no serious arguments in favor of such a step.
Secondly, in fact the nodal sizes -3, +2 to and +7 are very weakly supported by statistical basis from physics. Yes, -3 is the most important size for the biosphere, the average size of cells, yes +2 is the most important size for humans - their own growth. But how do you compare a cell to a human being and the rest of the physical world? This is partly answered in the book “Man on the scale of the Universe,” but questions remain.
Thirdly, astrophysicists do not know the true size of stellar nuclei. Their theoretical size of +7…+8 orders of magnitude on the S-axis does not agree with astrophysical calculations, which give orders of magnitude larger sizes. Thus, we do not know what the true ratio between the average size of a star and its nucleus is. Is it the same as that of an atom, i.e., 1 to \(10^{5}\), or is it significantly different, e.g., 1 to 100? Thus, there are many questions about the structure of the S-WAVE of stability . But, on the other hand, there is not a single observational fact that violates it. There are unclear, unexplored places, but there are still no contradictions with the factual material.