Peculiarities of global distribution of geological and social structures by their size
The ideal object for such a study is blocks of the Earth's crust and all the structures associated with them. The blocks were most likely formed at the time of the Earth's crust's origin, about 5 billion years ago.
During this period, the size of the Metagalaxy could have been about \(10^{28}\) cm (15 - 5 = 10 billion years). Calculation by the Double Wave Stability model using formulas 1.16 and 1.17 gives the following predictions regarding the statistics of the size distribution of these blocks (CLASS #8):
\[ L_B = l \cdot 10^{5K} = 1.6 \times 10^{-33}\text{ cm} \times 10^{5 \times 8} = 1.6 \times 10^7\text{ cm} = 10^{7.2}\text{ cm}\] or 160 kilometers.
\[ L_E = l \cdot \left(\frac{R}{L}\right)^{\frac{K}{12}} = 1.6 \times 10^{-33}\text{ cm} \times \left(\frac{10^{28}}{10^{32.8}}\right)^{\frac{8}{12}} = 5.4 \times 10^7\text{ cm}\] or 540 kilometers.
The issue of identifying statistically significant selected sizes of crustal blocks was addressed in the 1980s by a team led by the director of the Institute of Earth Physics, M.A. Sadovsky. In this size range, the scientists found1 that blocks with sizes of 120 and 500 km are the most common. Taking into account all probable errors, the coincidence of our model values with statistical data is very high. Let us further consider the following chain of logical reasoning. If the crustal blocks gravitate to bimodal distribution, and since they determine the boundaries of geographic regions, they, in turn, should reveal the predicted bimodality when processing the statistical array. Geographical boundaries, in turn, are determined by climatic, soil, and vegetation differentiation of the Earth's surface. As established2, socio-economic territories are also tied to landscape-geographic arrays. Consequently, the distribution of countries and their internal structures (states, provinces, etc.) by size should show the same bimodality.
Let us make a logical PROPOSITION that in the process of formation of social territories, the block structure of the Earth's crust plays a significant role at all scales, both in the static formation of ethnic groups through landscape specifics (soils, vegetation, etc.) and in the dynamics of settlement of peoples to natural barriers (mountain ranges, rivers, deserts, etc.). In other words, lithospheric fragments, as a matrix, give rise to the geographical structure, and the latter, in turn, gives rise to the socio-economic one.
The data on the distribution of countries and their regions by size were statistically processed by the author in his time and obtained quite remarkable results3.
To simplify the calculations, the notional size of any region was defined as the square root of its area.
They confirmed the predictive power of the law of bimodality in the distribution of all scaled systems.
Let us consider how social structures are distributed on the S-axis (see Fig. 1.60 and Table 1.3).
Curve No. 1 shows the statistical distribution of all countries of the world by size.
The distribution is clearly multimodal, with a step of 0.5 orders of magnitude on the S-axis. By the way, in M.A. Sadovsky's data, one can also detect an average step of 0.5 order for the crustal blocks.
Calculations of conditional sizes from areas showed the following. The most representative modes are 130 km (30 countries) and 450 km (58 countries) (see Table 1.3). Another significant mode, 15 km (24 countries) is represented by dwarf and island states. We see that most of the countries of the world gravitate in one way or another to the sizes of the crustal blocks, or the two most stable sizes on the S-axis in the CLASS #8 we have chosen for consideration. Incidentally, the closest to the exact cosmological size (162 km) is the notional size of the UK. Curve #2 shows the statistical distribution of the regions of the former USSR. In fact, all internal regional distribution in the USSR has a bimodal character.
The first mode is 180 km (65 areas) and the second mode is 420 km (37 areas).
Curve No. 3 shows the generalized distribution by size of internal regions of large countries of the world: USA, Brazil, India - states, China - provinces.
Table 1.3 shows that the same two modes are distinguished in each country, with the second mode - about 450 km - being the most significant. The total number of regions in the first mode - 150 km is equal to 17, and the second mode - 450 km is represented by 73 regions.
So, all countries of the world and their hinterland regions are characterized by a bimodal size distribution.
The first mode: 120-180 km coincides with the calculated value of the SWS stability size FOR CLASS #8-160 km.
The second mode: 420-450 km is close to the calculated value of EVOLUTIONAL WAVE of stability -EWS - 540 km.
Both modes are related to the sizes of the Earth crust blocks and their natural boundaries. But it is not so much important for us as the fact that the model calculation of stable sizes, which was based on the factors of the integral scale symmetry of the Universe, seemingly far from geological and social processes, leads to surprisingly accurate (for such an interval of scales) predictions.
One more conclusion cannot be passed by. For all countries of the world and for their internal regional areas, the second evolutionary mode - 450 km - clearly dominates in the statistical distribution by size.
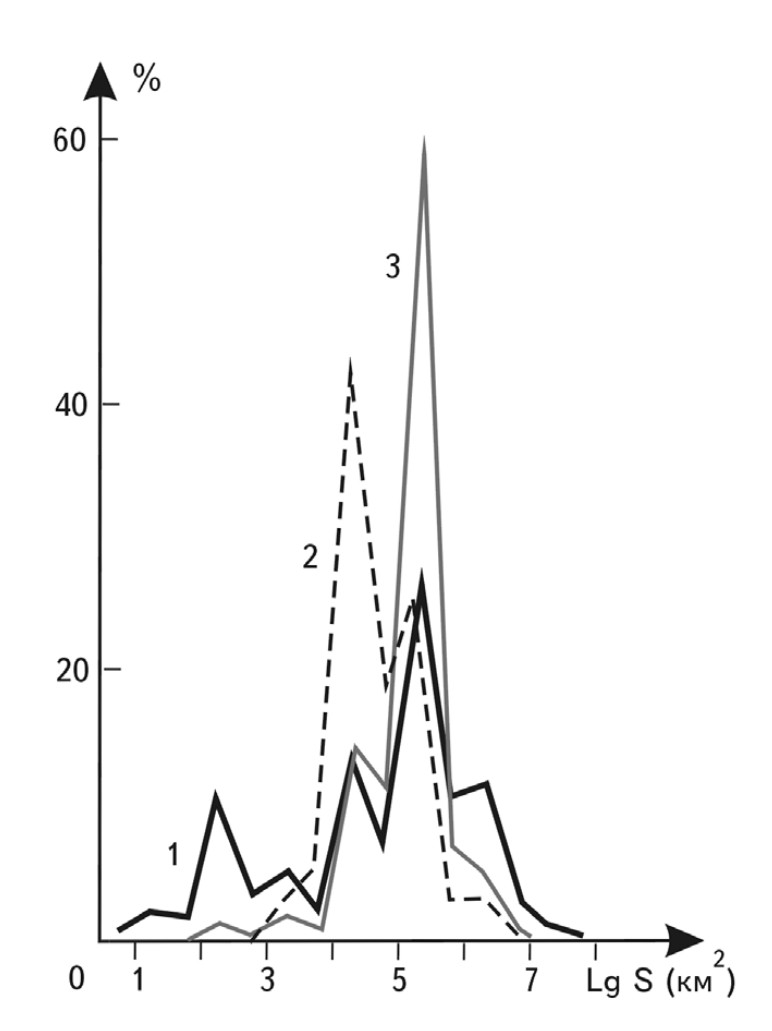 Fig. 1.60. Distribution of social territories by size (S - area). 1. - countries of the world; 2. - regions of the Russia; 3. - states of the USA, regions of China, India, Brazil
For all... except Russia. The only country in which the regional distribution has as dominant the first basic mode - 180 km, was the USSR (now - Russia). What does this undoubted statistical fact of our socio-cultural reality testify to?
First, Russia (USSR) is fundamentally different from the rest of the world in its internal geographical and socio-territorial structure.
TABLE 1.3.
| № | Region | \(1_l\) | \(1_d\) | \(2_l\) | \(2_d\) | \(3_l\) | \(3_d\) | \(4_l\) | \(4_d\) | \(5_l\) | \(5_d\) | \(6_l\) | \(6_d\) | \(7_l\) | \(\bar{X}\) | \(M_0\) | \(\sigma\) | \(V,\%\) | \(\gamma_1\) | \(\gamma_2\) |
|---|---|---|---|---|---|---|---|---|---|---|---|---|---|---|---|---|---|---|---|---|
| 1 | Europe | - | 1 | 4 | - | 2 | - | 5 | 5 | 16 | 1 | - | - | - | ||||||
| 2 | Asia | 1 | - | 1 | 1 | - | 3 | 6 | 4 | 15 | 7 | 5 | 1 | 1* | ||||||
| 3 | America | - | 1 | 11 | 3 | 3 | 1 | 7 | 3 | 9 | 1 | 6 | 3 | - | ||||||
| 4 | Africa | - | - | 2 | - | 3 | - | 8 | 3 | 16 | 11 | 12 | - | - | ||||||
| 5 | Australia and Oceania | 4 | - | 6 | 3 | 3 | - | 4 | - | 2 | - | - | 1 | - | ||||||
| 6 | General Nos. 1-5 | 5 | 2 | 24 | 7 | 11 | 4 | 30 | 15 | 58 | 20 | 23 | 5 | 1 | 4.52 | 5.30 | 1.50 | 33 | 0.80 | -0.16 |
| 7 | Regions of the Russia | - | - | - | - | 5 | 6 | 41 | 2 | 2 | - | - | - | - | ||||||
| 8 | "Oblast" units. | - | - | - | - | 5 | 7 | 65 | 28 | 37 | 3 | 5 | - | - | 4.76 | 4.64 | 0.57 | 12 | -0.45 | 0.49 |
| 9 | United States (states) | - | - | 1 | - | 2 | - | 6 | 5 | 33 | 1 | 1 | - | - | 4.88 | 5.24 | 0.63 | 13 | 1.88 | 5.10 |
| 10 | China | - | - | - | - | - | 1 | 1 | 2 | 19 | 4 | 2 | - | - | 5.34 | 5.28 | 0.47 | 9 | 0.99 | 2.60 |
| 11 | India | - | - | - | - | - | - | 6 | 2 | 11 | - | - | - | - | 4.42 | 5.23 | 1.13 | 26 | 1.10 | 0.14 |
| 12 | Brazil | - | - | - | - | 1 | 1 | 4 | 4 | 10 | 3 | 3 | - | - | 4.99 | 5.23 | 1.00 | 20 | 1.80 | 3.90 |
| 13 | General No. 9-12 | - | - | 1 | - | 3 | 2 | 17 | 13 | 73 | 8 | 6 | - | - | 4.95 | 5.24 | 0.86 | 17 | 1.92 | 4.47 |
| 14 | General #8-12 | - | - | 1 | - | 8 | 9 | 82 | 41 | 110 | 11 | 11 | - | - | 4.90 | - | 0.75 | 15 | 0.98 | 3.49 |
| 15 | General No. 6, 14 | 5 | 2 | 25 | 7 | 19 | 13 | 112 | 56 | 168 | 31 | 34 | 5 | 1 | 4.76 | - | 0.75 | 24 | 1.23 | 2.02 |
Notes:
\[S_{N_i} = \begin{cases}(1 - 5) \cdot 10^n, & i = l; \ (5 - 10) \cdot 10^n, & i = d\end{cases}\]
The asterisk marks the value for the territory of the USSR
Secondly, since the first fashion is connected with all ancient and most simple, but fundamental structures of the Universe, we can PROPOSE that the scale-resonance space of Russia is tuned to a different frequency than the space of the rest of the world. It is tuned to the frequency of preservation of the basic properties of the social space, or to the frequency of Yin.
We see that the comparison of a simple analysis of the statistical distribution of world regions by their size gives very deep grounds for thinking about the connection between geopolitics and the processes of structure formation in the Universe. Here only the edge of this large and fruitful topic is touched upon.
-
Sadovsky M. A., Bolkhovitinov L. G., Pisarenko V. F. Deformation of geophysical medium and seismic process. Moscow: Nauka, 1986. С. 100. ↩
-
Razumovsky V. M. In Vn.: Socio-economic and ecological aspects of geography. L.: LSU, 1983. С. 17-28. ↩
-
Sukhonos S. I. On the possibility of the influence of the Earth's crust blockiness on the peculiarities of the size distribution of social territories // DAN. -1988. 303. № 5. С. 1093-1096. ↩