Division-synthesis
Consider the Nuclei of Atoms (CLASS #4). The twentieth century was marked in the energy industry by two tremendous events:
- by successfully mastering the decay (division) energy of atomic nuclei;
- the failure of attempts to master the energy of thermonuclear synthesis (synthesis) of atomic nuclei.
Moreover, the number of scientists involved in the work on the second direction and the sums allocated by the states to master thermonuclear energy were by no means less than the indicators of the first direction. Consequently, the failure of thermonuclear synthesis is due to some deep and fundamental defect of knowledge in this area of modern science. It is important for us to emphasize here that, despite the closeness of these processes on the S-axis, synthesis proceeds on smaller scales than division (see Fig. 2.2)1. And we can assume that the boundary of the ~ \(10^{-12}\) cm scale zones of synthesis and division is simultaneously some invisible but very fundamental physical barrier (see Fig. 2.2).
It may be noted in passing that this barrier, figuratively speaking, divides the scale interval for atomic nuclei into "the right part of knowledge" and "the left part of ignorance".
Let us consider this physical barrier between synthesis and division in more detail, using data from nuclear physics.
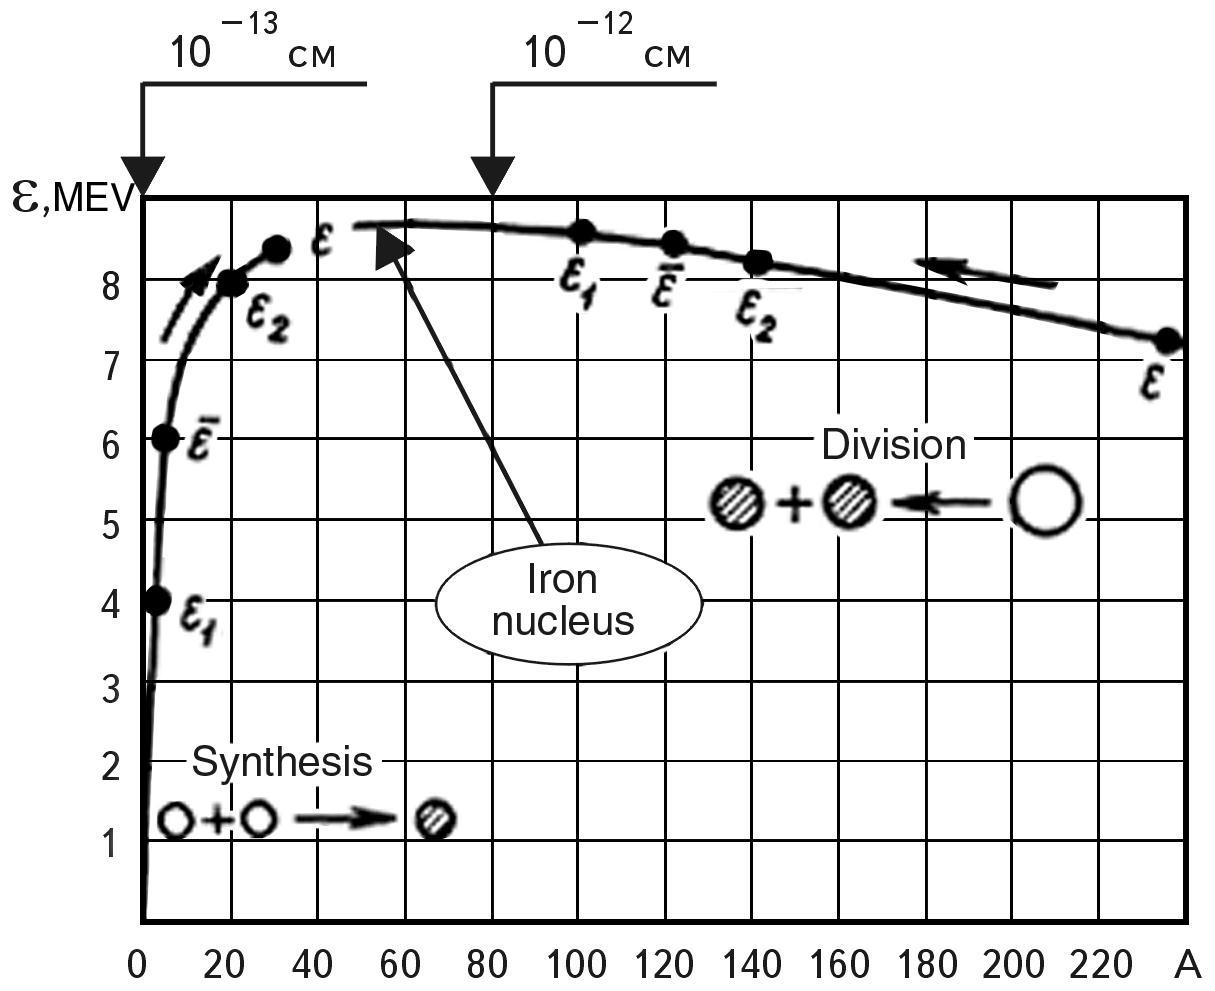 Fig. 2.2 Experimental dependence of the specific binding energy of a nucleon in the nucleus ε on the mass number A, or, obviously, on the size of the nucleus.
We know the experimentally established dependence (see Fig. 2.2) of the specific binding energy of nucleons in the atomic nucleus on the number of nucleons (A). The higher the binding energy, the stronger the nucleus.
The nuclei of elements in the middle part of the periodic system (28 < A < 138), i.e., from Si (28) to Ba (138) , are the strongest. Nuclei with the number of nucleons less than 28 have lower stability, which increases as A increases. For nuclei with the number of nucleons greater than 138, the binding energy and strength decrease with increasing A. The trend reversal occurs somewhere in the region of nuclei of the iron group. It is the nature of this dependence that determines the difference between the two types of nuclear energy production.
To better visualize this difference in the model logic of SWS, let us display the dependence in Fig. 2.2 mirror wise with respect to the X (A) axis. For this purpose, let us introduce a concept: the relative instability of the nucleus 1/ε, which characterizes the excess specific binding energy of nucleons in the atomic nucleus (Fig. 2.3). The larger it is, the more energy can be "taken" from the nucleus during its synthesis with another nucleus or during its division.
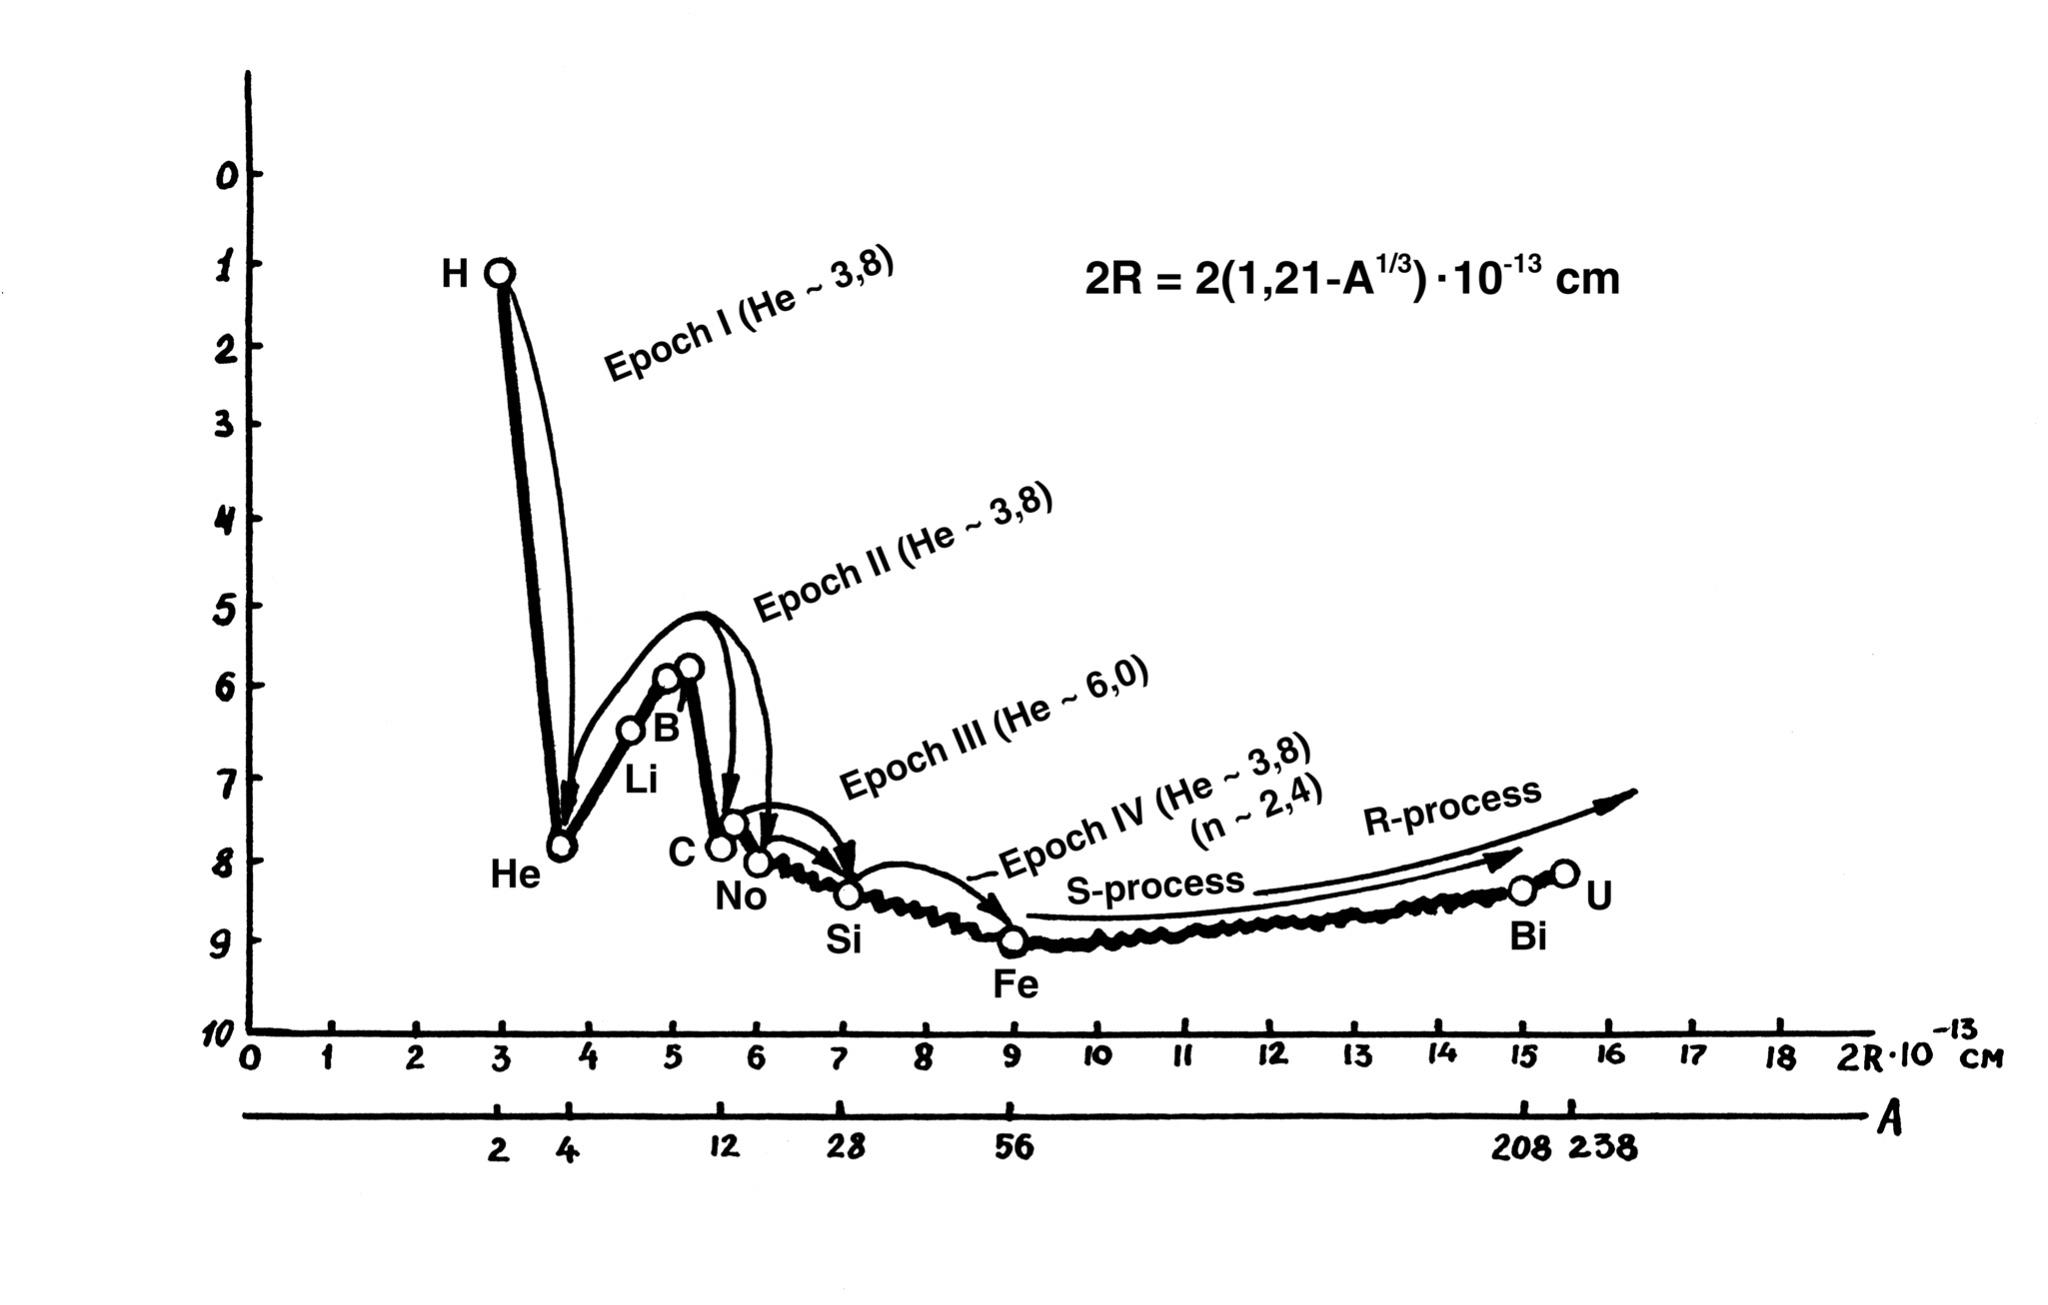 Fig. 2.3. Image of the potential "stability trough" for atomic nuclei. On the left slope of the diagram there is one type of synthesis, and on the right slope (to the right of the Fe point) - another type. This diagram is constructed by the author in a somewhat unconventional form. Its form is essentially mirrored to the dependence in Fig. 2.2, but due to the fact that the bonding energy in the atomic nuclei - ε - decreases as we move upward along the Y axis.
This construction technique allows us to better create a mnemonic image of the nuclei rolling down to the lower stability point (ε ~ 9 MeV).
The diagram shows that the first four epochs of nuclear synthesis in stars reflect the cascade "flow" of the growing nucleus over the fractal surface of the "stability trough" depending on its size to the zone of increased stability - to the group of iron nuclei.
It can also be seen that the synthesis of nuclei heavier than iron (S-process and R-process) on the right slope of the trough proceeds energetically differently: the atomic nuclei seem to roll from the lower point of maximum stability up the right slope of the trough.
* A is the number of nucleons in the nucleus
At the same time, we see that we have obtained, in fact, a potential stability trough for atomic nuclei. All nuclei of elements on the left slope (1< A < 56) of this trough, when moving to the lower stability point, increase in size, which is possible only due to synthesis, the addition of additional nucleons to them. Increasing in size, they naturally move along the S-axis to the right.
All nuclei of elements (56 < A < 238) on the right slope of the stability trough "tend" to roll down and move to the left along the S-axis. This process is possible only at their division, i.e. reduction in size of the final division products.
Both processes - synthesis and division - go with energy release and are directed along the S-axis towards each other, and they converge in some zone of the highest stability dimensions. We see that in this trough of the highest stability, where the nuclei of the elements of the iron group are located, there is no excess energy. In the future we will precisely determine the size of this zone, but already now it should be noted that if the graph in Fig. 2.3 is converted to a logarithmic scale and superimposed by its S-axis coordinates on the SW, it will coincide with the lower bend of the corresponding part of the SW (see Fig. 1.7). It can be seen that the transition from synthesis to division occurs in the lower zone of the SWS of CLASS No. 4.
The kink of the model SWS in this zone is similar to the kink of the experimental stability curve of atomic nuclei (see Fig. 2.3). The image of the "stability fossa" (one order of magnitude long) as the lower fragment of the SWS for CLASS #4 prompted me at one time to an unusual HYPOTHESIS: the experimental curve (see Fig. 2.3) is just a fragment of a more general natural dependence of the stability of objects of scale \(10^{-13}\)... \(10^{-11}\) cm on their size. Before getting into this, let us introduce some methodological schemes and images.
MODEL OF THE S-Trough of Potential stability - (STPS) WITH A synthesis-division BARRIER (CDB)
Let us imagine that we are trying to move an imaginary object placed in the lower point of the potential trough of atomic nuclei to the right or to the left. This is equivalent to raising it to a greater height, which requires additional energy expenditure. Figuratively speaking, it is like rolling a stone up a mountain. If we place our imaginary stone on the left slope, a small push is enough, and it will roll to the right, to the lowest point of the trough. If we place it on the right slope, it may, after a little push, roll down to the left.
Since the left slope is much steeper than the right slope (see Fig. 2.3), there is an allegory here: it is much more difficult to keep the "sled" of synthesis on the left very steep slope than the "sled" of division on the right, more gentle slope. Perhaps, that is why the control of the left descent has not yet been mastered, while the control of the right one has already been worked out to the last detail.
Let's forget about atomic nuclei for a moment. Let's abstracts to a conditional model of a potential stability trough. Since the whole process takes place in parametric space, where any motion along the S-axis leads to a significant change of the system's dimensions, we should consider how these phenomena occur with some conditional objects endowed with conditional density and dimensions.
Suppose that on the right slope of a potential trough there is a certain object, which under the influence of some factors tends to take a more stable position and go down. For this purpose, it needs to change its dimensions, specifically, to reduce them.
The first simple option is that the object decreases in size due to compression, which leads to its compaction (see Fig. 2.4). But what if this is impossible, as, for example, with nucleons, which are not compressed? In this case, there is another option - the object decreases in size due to fragmentation into smaller independent parts, each of which by its size occupies on the S-axis a position to the left of the primary object (see Fig. 2.5).
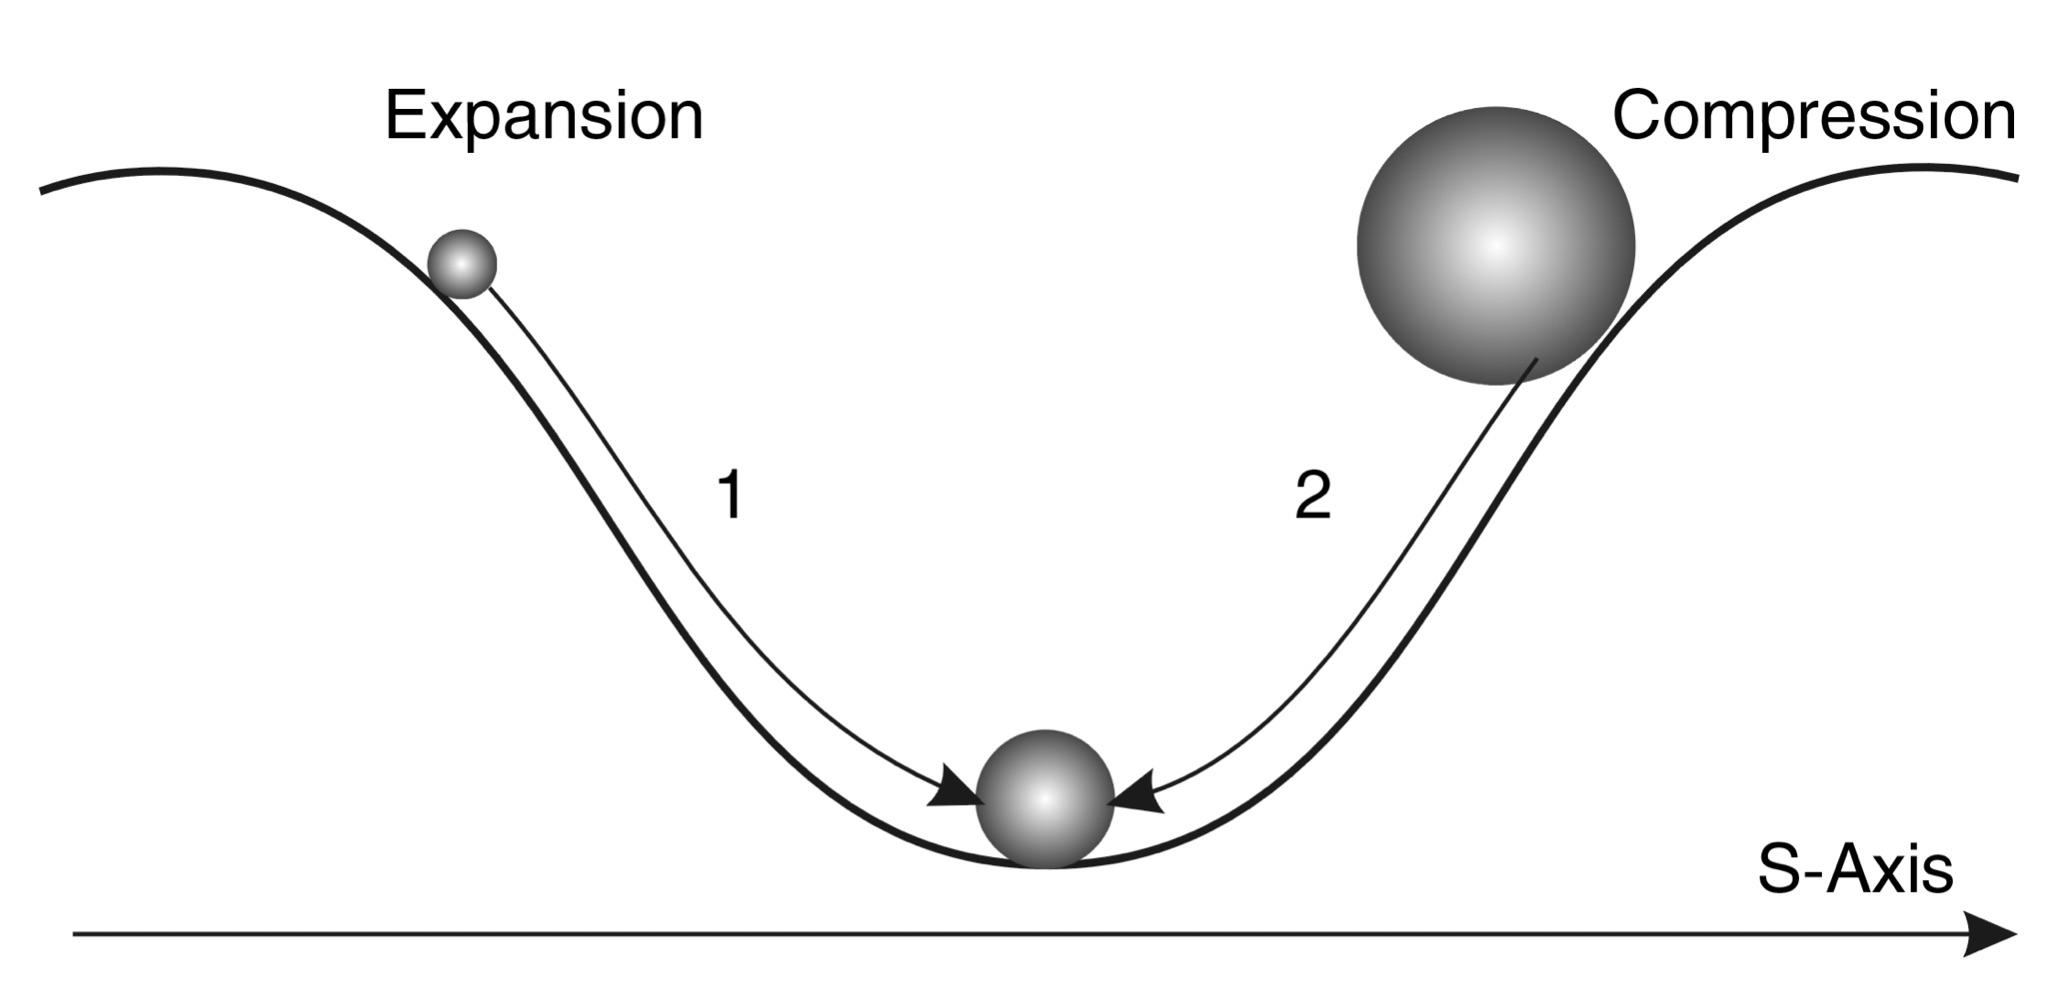 Fig. 2.4. S-through model and scheme of motion in the potential field of stability with preservation of system integrity: 1 - expansion of the system, 2 - compression of the system
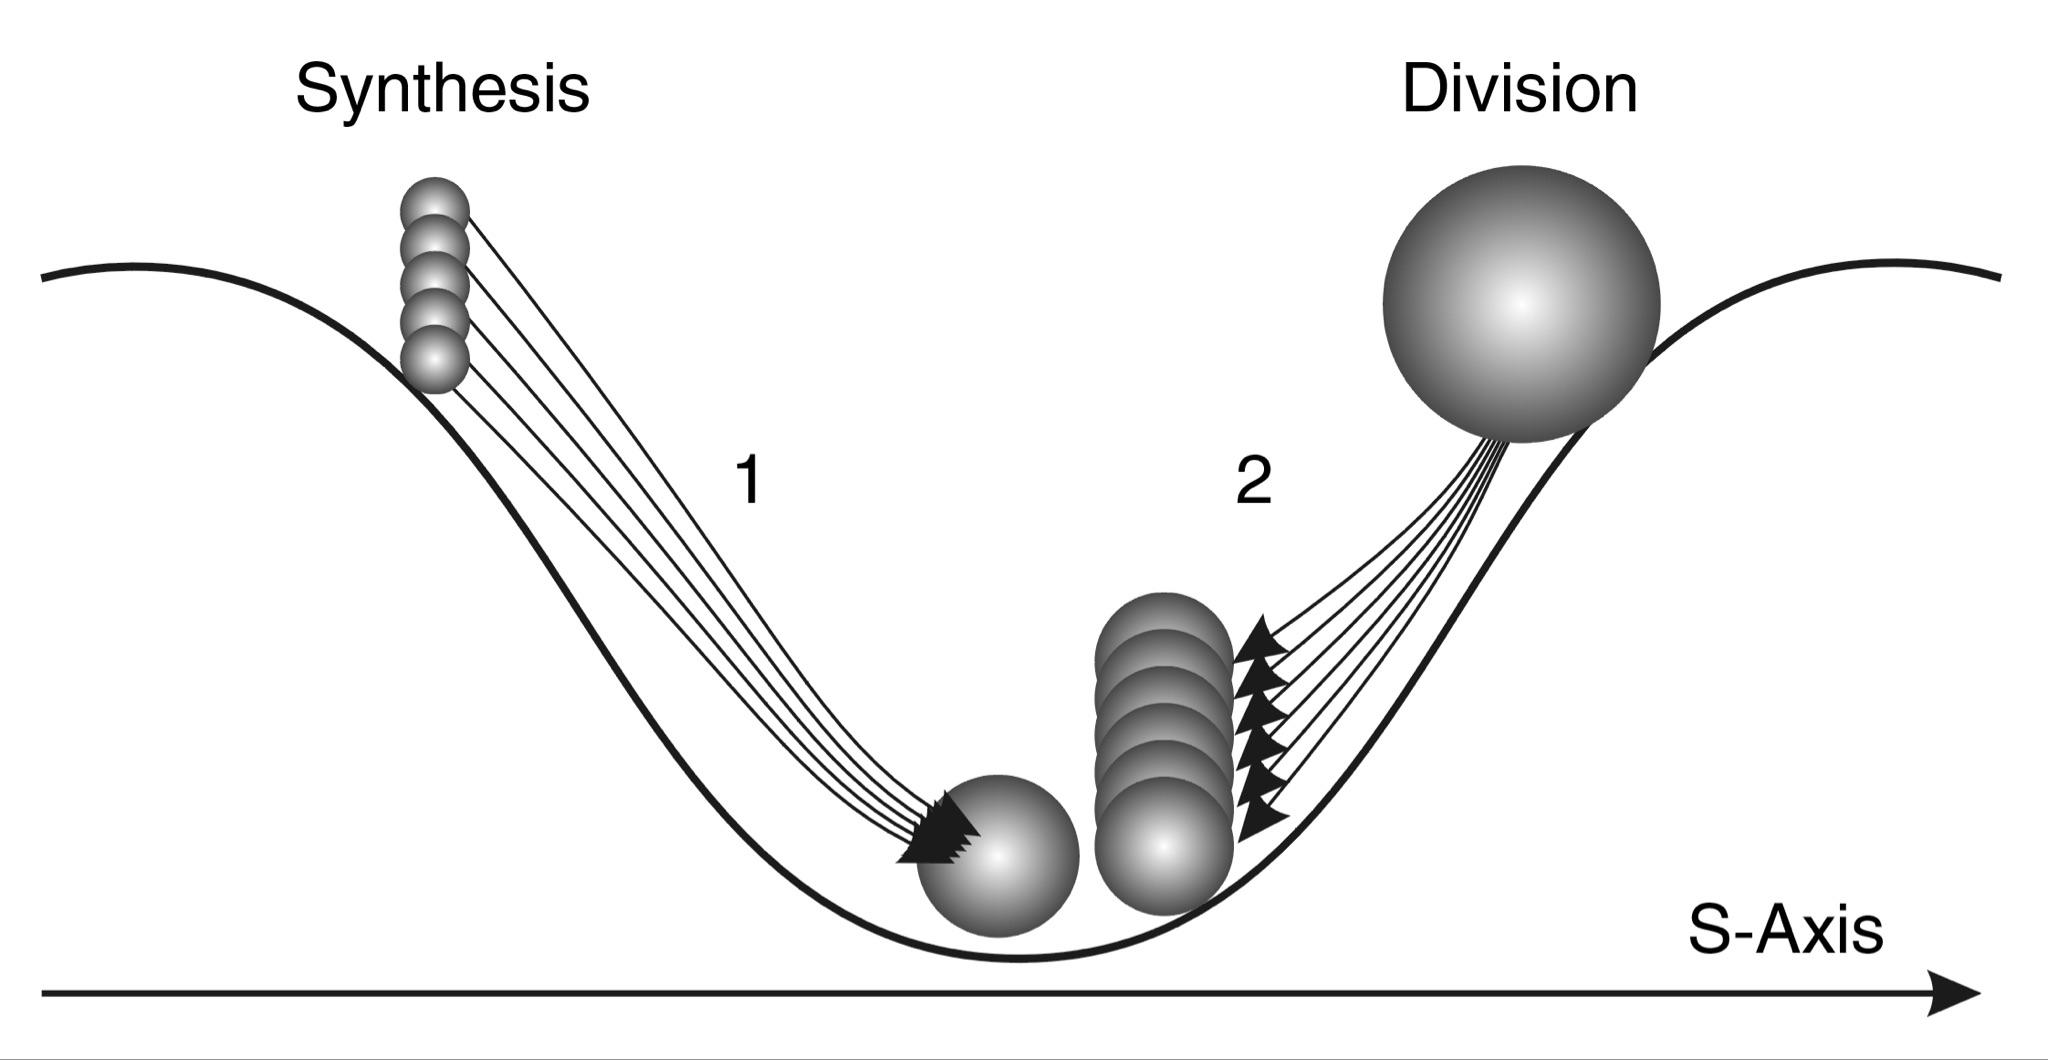
Fig. 2.5. S-trough model and scheme of motion in the potential field of stability without preserving the integrity of the system: 1 - system synthesis, 2 - system division
Let us now consider the system variants of moving the object on the left slope. Two variants are also possible here (see Figs. 2.4 and 2.5). The object increases in size and moves to an energetically more favorable position:
- through expansion;
- by combining different objects into a new holistic object - a variant of synthesis.
Further we will show that two variants of behavior on the right slope and two variants of behavior of systems on the left slope are universal schemes for many processes in the Universe. For now, let us introduce here a new notion - the synthesis-division barrier (S-D). This notion denotes the scale dimension corresponding to the lowest most stable point of the M-trough. It separates energetically favorable synthesis scale zones (left) from M division scale zones (right).
Now let us return to the Nuclei of atoms (see Figure 2.3).
What does the graph of the dependence of the stability of atomic nuclei on their size look like? First, its "bottom" has several local "depressions" in which the stability of nuclei increases. Secondly, if we move to the left from the lower stability point, the curve goes steeper and steeper upwards. We see a bend of the curve line, but less steep, to the right of the stability center. Let's consider those data of physics of nuclear reactions, which illustrate this dependence. All atoms of the left part of the trough are obtained in the process of constant thermonuclear synthesis in the depths of stars, where nuclei of heavier elements are constantly created from hydrogen nuclei. Astrophysics distinguishes 2 several synthesis cycles: hydrogen combustion, helium combustion, carbon and silicon combustion. The maximum that is obtained in space as a result of this process is the nuclei of atoms of the iron group, since "iron and nuclei close to it are characterized by the maximum binding energy per nucleon" 3. "These reactions are called e-processes, and they finally lead to the formation of iron (Fe, 56) and close to elements under conditions of thermodynamic equilibrium and in stellar explosions... For the transformation of the nucleus
$$ ^{56}_{26}\text{Fe}^{30} $$
into the nucleus
$$ ^{238}_{92}\text{U}^{46} $$
it is necessary 182-fold neutron capture alternating with acts of β-decay " 4. In this case, heavy nuclei are obtained, according to modern astrophysical ideas, as a result of catastrophic shock processes occurring during the explosion of supernovae. The point is that the synthesis of nuclei of atoms heavier than iron is an energy-consuming process, so it occurs only due to the shock feeding by the energy of the explosion of a star.
All attempts to create artificially atomic nuclei with the number of protons greater than \(10^{6}\) have failed due to the sharp increase in the energy expenditure required for this and the low stability of artificial nuclei. If we turn to the stability trough model and visualize the experimental curve in Fig. 2.3. as a model like Fig. 2.5, then, figuratively speaking, nuclear physics becomes like SisypSWs, rolling his stone up the mountain on the right slope, but unable to get it to the top, where it could rest stably.
Consequently, if the "sled" of nuclear synthesis rolls down the left slope under its own weight, it can climb the right slope only by the inertia of a strong push.
In addition to this difference, there is a fundamental structural difference between the synthesis of nuclei on the left slope and on the right slope of the S-Trough. It consists in the fact that both nuclei of the same size and different nuclei can participate in synthesis on the left slope. In the latter case, even the smaller of them is a complex nucleus. At the same time, synthesis on the left slope is always a ONE-ACT process. Two nuclei fuse together and form a new nucleus, resulting in the release of free energy.
On the right slope - synthesis is realized only by attaching to heavy nuclei individual neutrons - the smallest possible elements of nuclear synthesis. Moreover, the process becomes MULTI ACT, synthesis, in fact, passes into the process of absorption of small particles by a large nucleus, and energy is not released, but on the contrary - expended.
Here, it is quite correct to use the concept introduced earlier - "SYNTHESIS-DELIVISION BARRIER" (see Fig. 2.6). This barrier divides the M-NMU into two sections: the left one, where nuclear synthesis is energetically advantageous, and the right one, where nuclear division is energetically advantageous. A general rule can also be introduced: SYNTHESIS DOMINISES ON THE LEFT SLope of the S-trough, and division DOMINISES ON THE RIGHT SLope.
However, if we introduce the notion of synthesis prohibition for the right slope of the nuclear S-Trough, the question arises: how can we explain the known fact that in nature there is still synthesis of nuclei heavier than iron? After all, these nuclei are in the scale zone corresponding to the right slope of the S-Trough.
We will show that the agreement with the model is not violated in this case.
First, as already mentioned, the synthesis of these heavy nuclei (on the right slope) proceeds in very rapid explosive processes, and the source of energy of these explosions are nuclear reactions of synthesis of light nuclei of the left slope of the S-Trough. Just a part of the energy released in this process is absorbed by energy-costly synthesis on the right slope. Figuratively speaking, the synthesis of the right slope "parasitizes" the synthesis of the left slope.
Second, on the right slope we see a fundamentally different type of process. It is no longer the synthesis of two identical (or close in mass) nuclei, as on the left slope, but the addition of neutrons. AND THE MODEL DOESN'T FORBID synthesis FOR NEUTRONS! It forbids it for heavy nuclei on the right slope.
So, for one participant of synthesis, which is located on the right slope (heavy nucleus), the model "forbids" synthesis, and for another participant of synthesis (neutron), which is located on the left slope, it does not "forbid". And this partial prohibition, figuratively speaking, nature overcomes due to the explosive character of the process (the explosive character of the process is due to the absorption of energy from the left slope, where light elements are explosively synthesized (see Fig. 2.6)).
TSWs, we see that when moving from left to right along the S-axis while passing the C-D BARRIER, the type of synthesis reaction changes significantly - in fact, the transition from synthesis proper to multiple neutron capture takes place.
The maximum core size that is involved in SYMMETRIC SYNTHESIS on the left slope is about 7 \(\cdot 10^{-13}\) cm.
It is a synthesis in which the parts joining are equal or close in size.
On the right slope, synthesis of two almost identical components becomes impossible and gives way to ASYMMETRIC SYNTHESIS, i.e., absorption of small neutrons by one large component. As will be shown later, this distinction is of system-wide significance.
Let us now consider the MASSIVE FEATURES of nucleus division.
All nuclei on the right slope division with the release of excess energy, shifting along the S-axis to the left ("sliding" down into the S-Trough of Potential Stability - STPS). It is known that active spontaneous division is inherent only to very large nuclei (they are located on the rightmost edge of the S-Trough of Potential stability - STPS of the SWS model). Smaller nuclei do not spontaneously division, but they can gradually transform into the most stable nuclei of the iron group 5.
On the left-hand slope, nuclear division is an energetically extremely disadvantageous process, since the resulting fragments will collectively have more energy than the original nucleus.
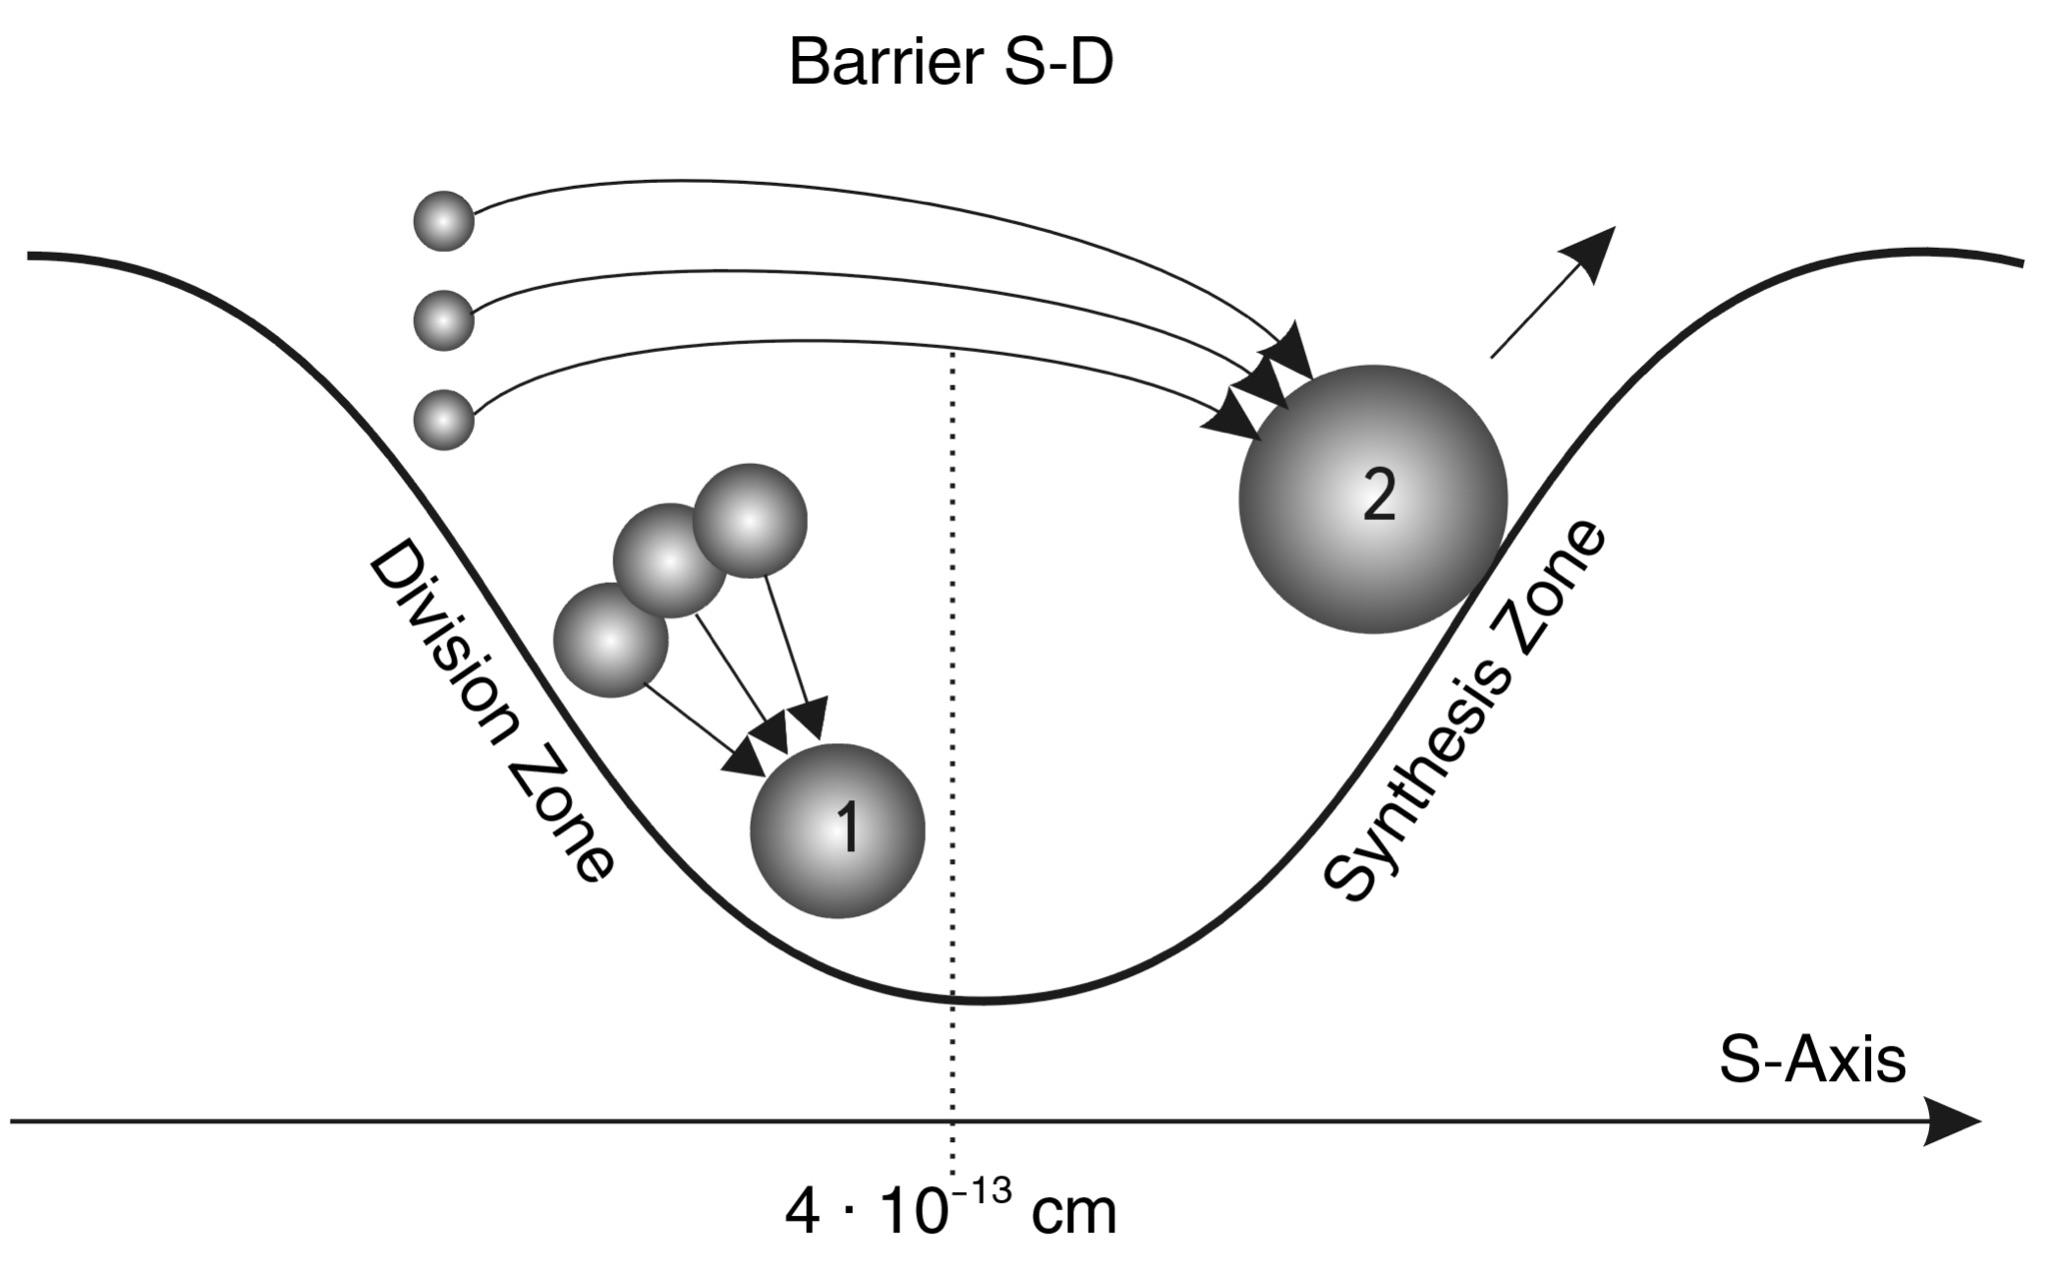 Fig. 2.6. SYNTHESIS PROCESS (1) in the synthesis zone (on the left slope of the S-Trough of Potential stability - STPS).
The SYNTHESIS PROCESS (2) in the division zone (on the right slope of the trough) proceeds due to the participation of elements inclined to synthesis. Their sizes are smaller than synthesis-division BARRIER (CDB), so synthesis in the forbidden zone of the model occurs as if by overcoming CDB by small elements
Therefore, the division of nuclei, which are lighter than iron group nuclei, cannot spontaneously proceed.
So, synthesis-division BARRIER (CDB) divides the S-Trough for the process of nuclear division also clearly into two parts. To the left of the barrier, division is "forbidden", to the right - "allowed". The steepness of the slopes of the S-Trough of Potential stability - STPS here (see Fig. 2.2) gradually increases, as evidenced by the fact that the heaviest nuclei (the right edge of the S-Trough) roll to the left very easily, and to split nucleons (the left edge of the STPS) into quarks experimental physicists have not yet succeeded, despite titanic efforts. One can continue the above allegory and say that rolling a stone down the left slope is even more difficult for Sisyphus than rolling down the right slope.
The question arises: how far do the slopes of the model S-trough go to the left and right and do they flatten or kink?
The analysis of regularities of the most diverse dynamical processes of nature at different scale levels of the Universe led the author to the following HYPOTHESIS.
THE stability WAVE IS AT THE SAME TIME A MODEL FOR DISTINGUISHING THE PREVAILING PROCESSES OF division OR synthesis ON DIFFERENT SCALES OF THE UNIVERSE.
Therefore, we can consider the energetic S-Trough of Potential stability in the region of atomic nuclei as a small fragment of the whole SWS, figuratively speaking, as a small bone of a dinosaur, by which we will try to reconstruct its whole skeleton (see Fig. 2.7). Then the left slopes of all SWS SW are large-scale zones of energetically advantageous synthesis of systems, and all right slopes are large-scale zones of energetically advantageous division of systems. The tops of SWS are the zones of saddle stability, and the troughs are the zones of stable equilibrium of systems.
We call the S-Trough of Potential stability - STPS the segments of the model sinusoid from crest to crest. The central part of the S-Troughs coincides in location on the S-axis with the even scale classes. Therefore, the numbering of the troughs will preserve the numbering of even classes (see Fig. 2.7).
To test this hypothesis, let us consider sequentially, starting from the proton (S-trough No. 4) and up to the Metagalaxy, what types of processes dominate at different scale levels of the Universe.
S-Trough #4 [-18; -13; -8]
In the most general terms, as already mentioned, the potential stability hole for atomic nuclei can be modeled by a fragment of the lower part of the S-N SWS (CLASS #4).
Moreover, the center of stability for the nuclei is the iron group nuclei, the size of which is close to \(10^{-12}\) cm*. However, the model trough is smooth, while the real one (see Fig. 2.3) is serrated and uneven. In addition, in the model STPS there is one lower stability point - 1.6 \(\cdot 10^{-13}\) cm, while in the real trough there are at least two of them: 1.6 \(\cdot 10^{-13}\) cm (hydrogen nucleus) and 9 \(\cdot 10^{-13}\) cm (iron nucleus).
In the previous part we considered bimodality in the distribution of objects by size and in this interval (\(10^{-13}\)... \(10^{-12}\) cm) we identified only two highest stability points: 1.6 \(\cdot 10^{-13}\) cm and 3.4 \(\cdot 10^{-13}\) cm. Both of them are clearly visible in Figure 2.3. But the third point identified on the S-axis, equal to 9 fermi (9 \(\cdot 10^{-13}\) cm), is a surprise for the SW model built here. This indicates the incompleteness of the model and the need for its further more detailed development.
However, the two stability points on the S-axis (1.6 \(\cdot 10^{-13}\) cm and 9 \(\cdot 10^{-13}\) cm) are within one order of magnitude of each other. For the whole S-trough, the scaling length of which is 10 orders of magnitude, this gives a spread of 1/10 (10% error). This deviation can be neglected.
At the end of this part of the book, we will touch upon this problem again, but at a higher level of generality. Here we only note that the experimental stability curve of atomic nuclei (see Fig. 2.3) testifies to the fractal form of the SWS. It is also important to note that while the first stability point (1.6 х \(10^{-13}\) cm) belongs to a proton particle, the second (9 х \(10^{-13}\) cm) belongs to an ensemble of particles (56 nucleons). Therefore, the character of their stability is fundamentally different.
* As we see, the stability center for the STPS is shifted by one order of magnitude to the right. This phenomenon, in the author's opinion, is related to the bimodality of the SWS, so all the STPS have the highest stability zone slightly shifted from the lower model point of the STPS.
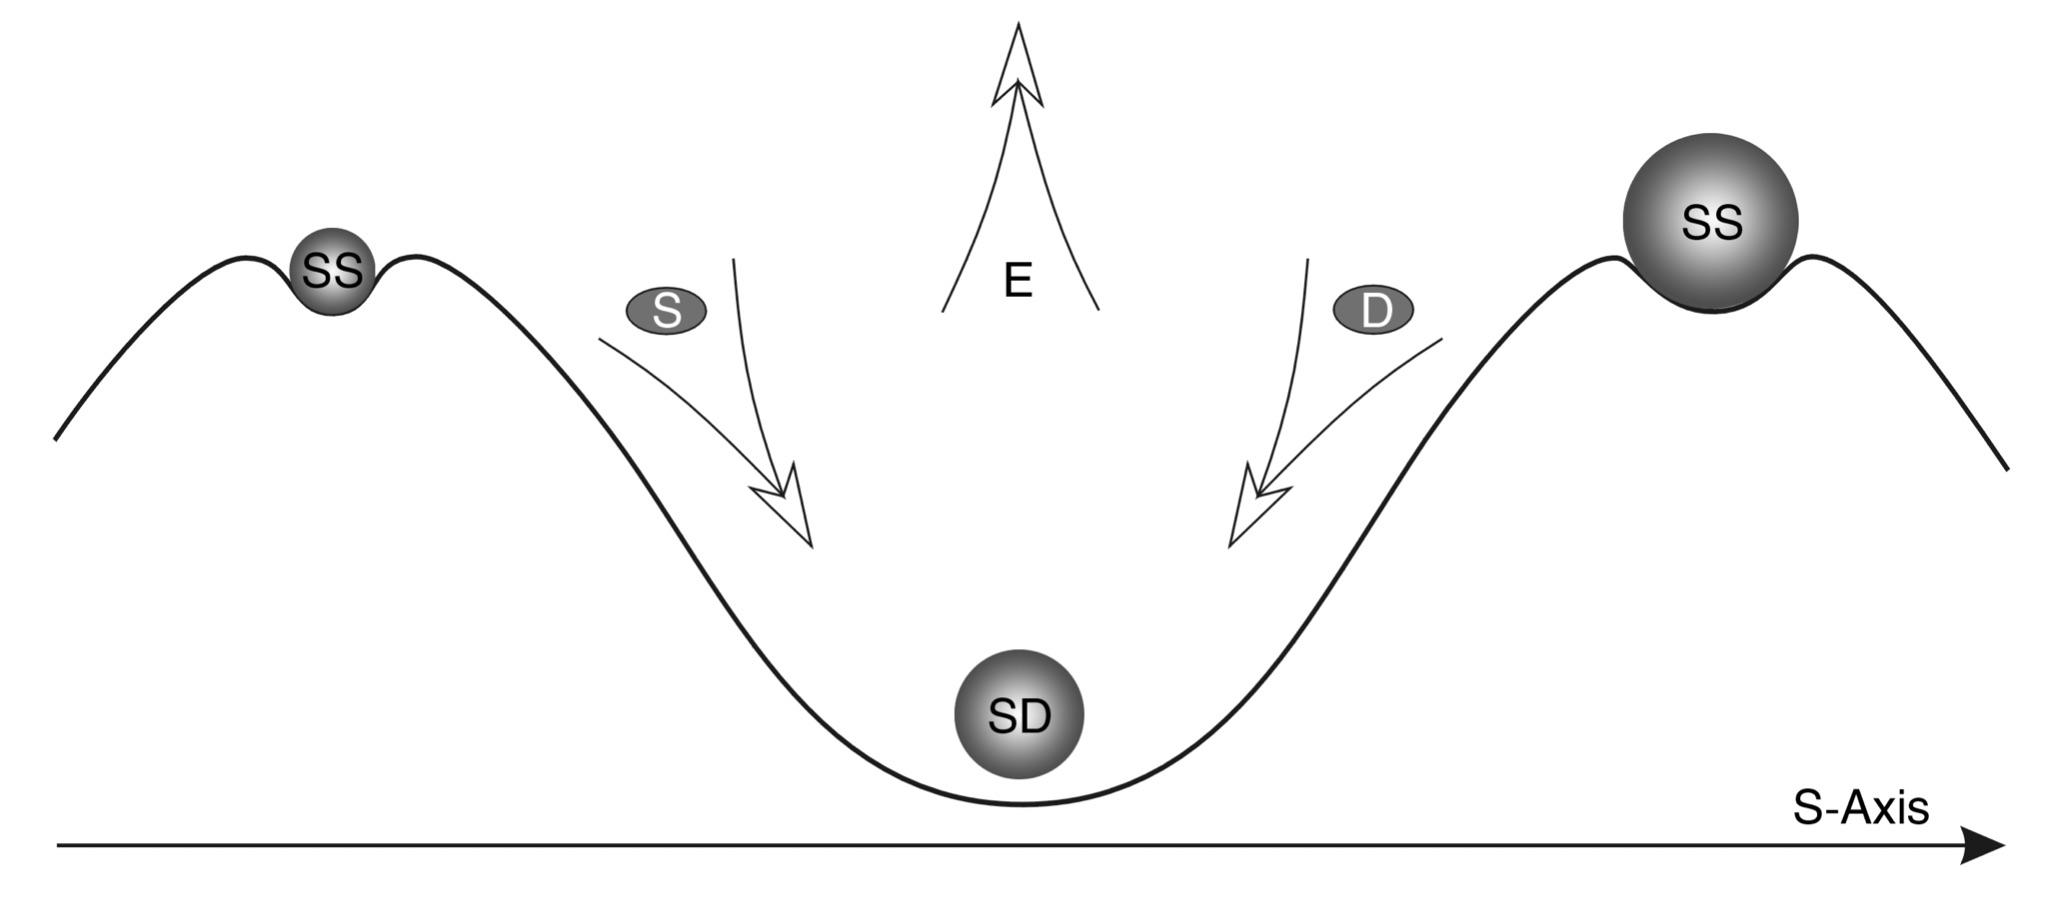
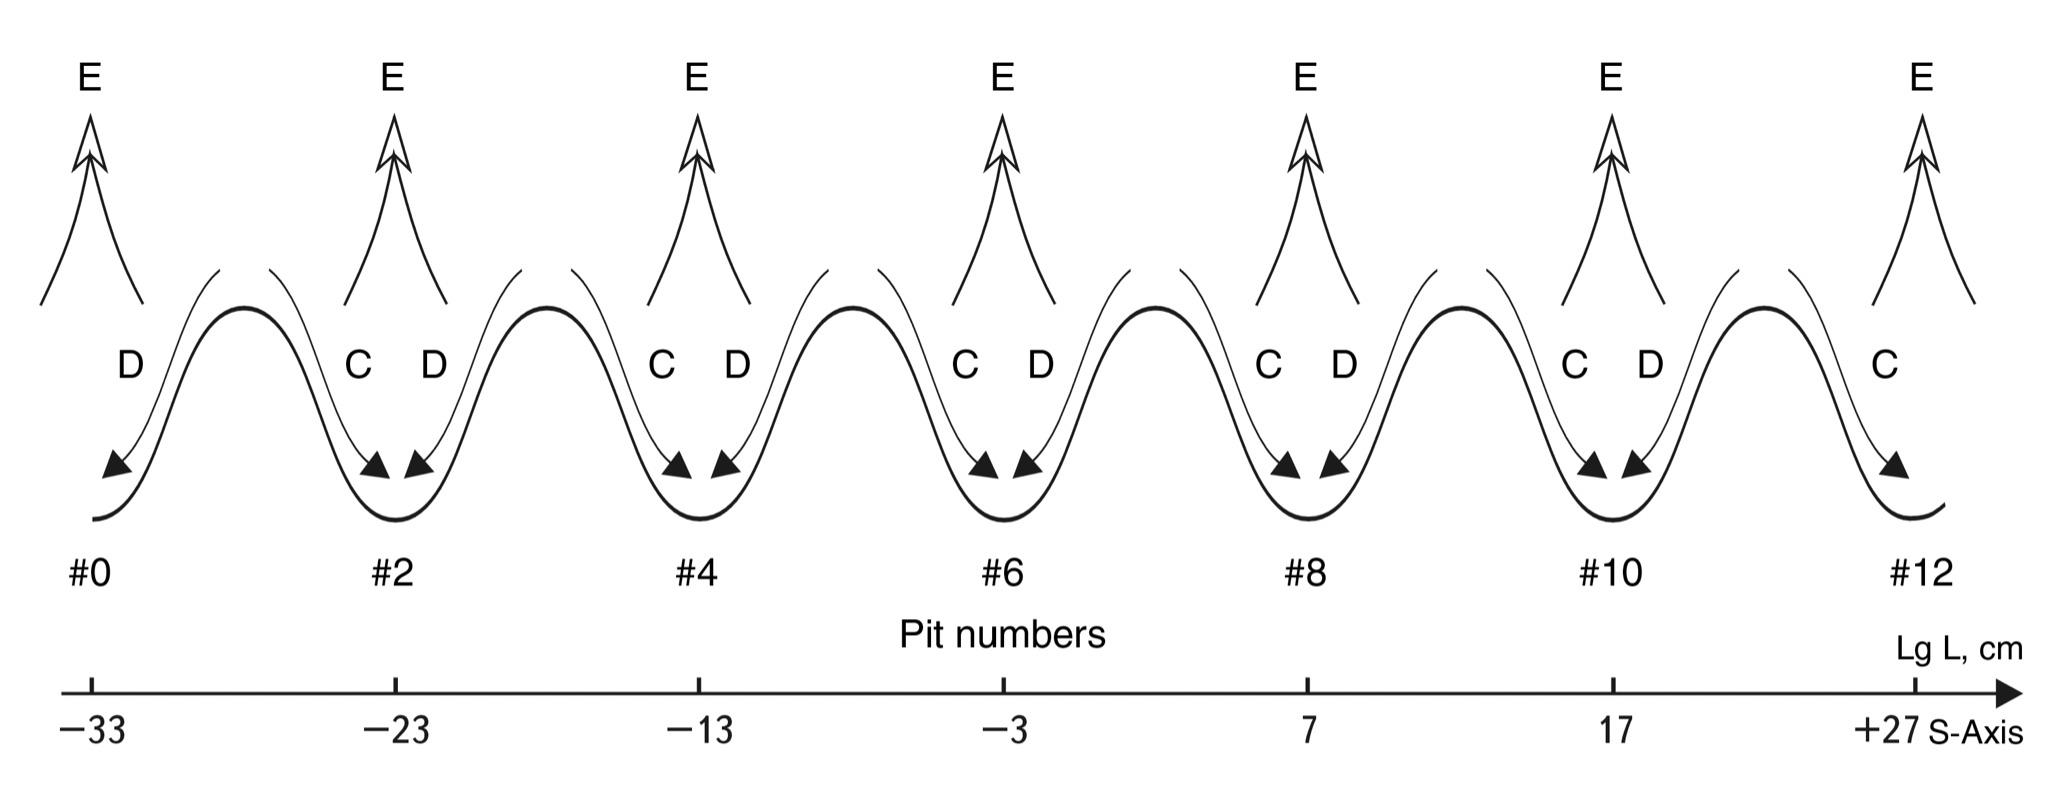 Fig. 2.7. Dynamic model of SWS
However, we'll leave that problem for now.
Let us now go beyond the range of \(10^{-13}\) cm - \(10^{-12}\) cm. Let us start with the left slope of S-Trough No. 4. According to the SW model, it goes all the way to the saddle region of stability, which has a coordinate on the S-axis (-18). According to our PROPOSITION, this is exactly the size of the electron. Physicists managed in experiments to get only to the size of about \(10^{-17}\) cm. Let's think about what is the essence of these experiments.
The essence of these experiments is that elementary particles were accelerated in gas pedals to gigantic speeds to break them into small fragments. Since for the destruction of particles of \(10^{-15}\) cm in size it was necessary to build gas pedals with a diameter of more than 2 km (\(10^{5}\) cm), we can say that the "strength" of particles is very high.
Let us imagine that we need to break down an alarm clock into its component parts, and for this purpose we build a machine whose dimensions are 20 orders of magnitude larger. Such a rig would have a diameter a million times larger than the orbit of Jupiter.
At the same time, not all particles can be separated into their constituent parts. For example, quarks could not be separated from nucleons. What does that tell us? On the left slope of S-Trough No. 4 the separation of elementary particles into their constituent parts is an energetically very costly procedure.
On the right slope of S-Trough No. 4, as already noted, there is spontaneous decay of larger nuclei into fragments. Here the picture is mirror-opposite. It costs nothing to break large nuclei into their constituent parts. But it is still not possible to synthesize, to put together from parts nuclei, the sizes of which would exceed \(10^{-12}\) cm, although it uses gigantic energies.
According to the dynamic model of SWS (see Fig. 2.7), the stability saddle for CLASS No. 5 (the coordinate of the S-Trough of Potential stability - STPS (-8)) should be 5 orders of magnitude to the right of the lower point of STPS No. 4. The whole Periodic Table of Elements really "sits" there, as atoms have diameters from \(10^{-8}\) to 6 \(\cdot 10^{-8}\) cm. Unfortunately, the author has no information about the processes going on with systems whose sizes would be in the range from \(10^{-12}\) to \(10^{-8}\) cm. Therefore, it remains to assume that here, too, the decay of systems is energetically more favorable than their synthesis.
S-Trough #6 [-8; -3; +2]
Let us leave the microcosm for the time being and move to the next in order potential S-Trough of Potential stability. The central range of sizes in this S-trough is 10...100 μm. Theoretical points of increased stability are 1.6 \(\cdot 10^{-3}\) cm (SWS) and 5 \(\cdot 10^{-3}\) cm (EWS).
According to the hypothesis on the similarity of stability troughs (see Fig. 2.7), on the left of the central range up to the top of the SW (\(10^{-8}\) cm), synthesis should be energetically more advantageous, while on the right, up to the size of \(10^{2}\) cm, division should be more advantageous.
Let us consider the factual data on the nature of scale-dynamic processes in this scale region. The most dynamic systems with such dimensions are living cells.
CELLS. As already mentioned, almost all eukaryotic cell types have an average size in the range from 10 to 100 microns. Just in the scale region of interest, which, according to the SW model, is the zone of highest stability. It is known that all cells reproduce by division and thus increase the number and complexity of living systems in the Biosphere.
METHODOLOGICAL APPROACH
Before we proceed to a systematic analysis of the cell division process, let us agree on some concepts and semantic constraints.
First, it is extremely difficult to determine the energy parameters of processes in the living world by analogy with nuclear division and synthesis. Therefore, we will determine the advantage of one or another type of process by its dominance in the evolutionary movement of systems: reproduction, complication, etc. For example, it is known that proteins complicate their structure by synthesis, but cells reproduce by division.
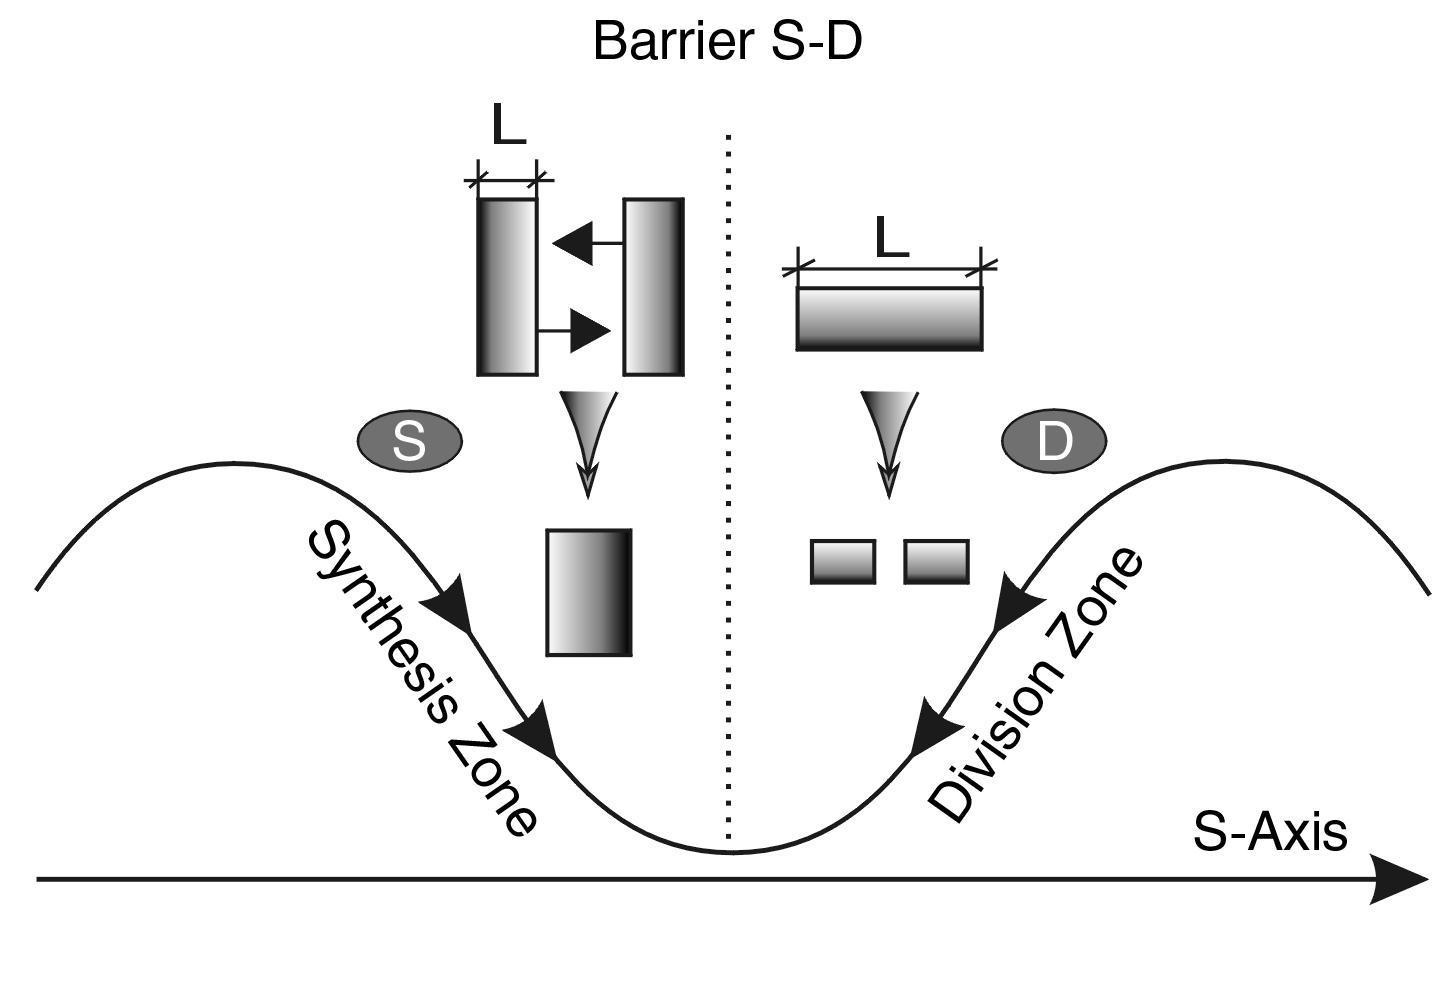 Fig. 2.8. EXTREME SIZE RULE (L). To determine the synthesis size (S), the smallest system size should be taken. To determine the division size (D), the largest system size should be taken
Secondly, the latter does not mean that synthesis processes are not involved. Therefore, when speaking about the predominance of one or another process, we will mean the following.
-
It will be exclusively about the upper scale level of the system. To put it simply - about the processes going on with it as an integral system and not about the processes going on at the scale of its form. So, for example, for a cell we will speak about its external dimensions at the moment of division. We do not take into account all the synthesis processes going on inside the cell during its vital activity at the moment of division, as they are going on other, lower scale levels.
-
We will emphasize the final act of the process. After all, before dividing, the cell grows (due to synthesis on the left slope). The final act, after which a new qualitative state appears (either the birth of a pair of cells or the next stage of development of a multicellular system), is division.
Let's consider an example - the absorption of food. Chewing pieces of food, we absorb them, but they will not be able to combine with the body until they are divided into elements with sizes so small that they can participate in the natural process of synthesis. Useful assimilation does not occur even at the large-scale cellular level; the food cells must be broken down to a molecular state.
Of course, biology has all the explanations for why food must be digested, i.e., broken down to its molecular state, before it can be absorbed. We do not intend to substitute our own for these explanations. Here we are only generalizing various well-known facts to the level of a single scheme.
If "assimilation" of cellular systems does occur, it is a parasite infestation of the organism, i.e. clearly an anti-evolutionary process.
Consequently, a multicellular organism is able to synthesize into itself usefully only those objects that are smaller than cells (starting from useful bacteria and smaller). Since the average cell size is 10...100 µm, we are talking about synthesis of elements to the left of the S-D barrier.
It is true that science has recently succeeded in overcoming this barrier and has begun to implant alien organs, which is a typical synthesis on the right slope. But what a price to pay for this overcoming! How much labor and money such operations cost!
Again, we note that we should not be confused by the parallelism in time of the processes of synthesis and division in one cell. It should be said that such a strict fixation of one of the scale slices is a necessary condition for primary analysis in all cases of work with the S-axis.
-
In the zone of transition from synthesis to division, it is sometimes difficult to establish which size is the critical "synthesis size". So, for example, a dividing bacterium may be several times longer than its diameter. Or another example: two sex cells at the moment of their synthesis may differ in size by more than 10 times. To avoid discrepancies, we will adopt here a GENERAL RULE. ***If the system has a significant difference in width, height, and length, the size of synthesis (division) should be determined along the direction of the process (***see Fig. 2.8).
For example, if a bacterium has a diameter 10 times smaller than its length and is divided into two parts across, the coordinates of the process on the S-axis will be determined by the length of the bacterium, not by its diameter. Similarly, if the synthesis of two elongated systems goes sideways (see Figs. 2.8 and 2.9), then the diameter should be considered the critical size.
A more complicated situation for consideration arises when two systems of different sizes are involved in the act of synthesis (division). In this case, two sizes should be distinguished for synthesis: critical (minimum) and secondary. Thus, we have already considered an example when a heavy nucleus (secondary size) absorbs neutrons (critical size). Here too, if at least one of the participants in the act of synthesis is to the left of the C-D barrier, synthesis is possible.
-
Obviously, both division and synthesis can have positive and negative consequences for biosystems. If, for example, any vertebrate animal is divided into two equal parts, it will lead to its death, but this does not mean that division at this scale level leads only to degradation, because the birth of vertebrates is from the systemic point of view also an act of division. On the other hand, if you surgically fuse two vertebrates together (synthesis), it is obviously a negative act, but this does not mean that synthesis at this level always leads to bad consequences, for example any sexual act is a temporary synthesis of two bodies with further consequences.
Therefore, in order to avoid ambiguous interpretations of the conclusions to be drawn later on, we shall at once stipulate that for the consideration of tendency we select only the most natural, stable, frequently repeated and final acts leading to the complication or reproduction of a biosystem. In this respect, the sexual act as a synthesis does not fit the latter criterion; it is not the final act of the emergence of a new system. Such an act is the birth of a new being, i.e. the separation of the fetus from the mother.
-
When analyzing empirical data and introducing some dimensional restrictions, barriers to this or that process, we will have in mind tendencies and rules that can manifest themselves both in a rigidly deterministic and statistical way. In the latter case, it will always be possible to find a few exotic examples that violate the proposed restriction. We assume that the reader in this case will always have in his memory the curve of the statistical distribution with its sufficiently wide dispersion, while we will be guided by the curve's mode. This will allow us not to drown in details at the first step, to reveal, albeit approximated, but main tendency.
After all these reservations, let us proceed to the ANALYSIS OF FACTUAL MATERIAL FOR BIOSYSTEMS LOCATED IN S-Trough #6.
PROTOZOA (UNICELLULAR PROTOZOA). For them, the main method of sexless reproduction is division. During division, the body of the parent splits into two more or less independent parts. Some protozoa are inherent and sexual reproduction, "characterized by the fact that the actual reproduction ... preceded by the sexual process, the characteristic feature of which is the synthesis of two sex cells (gametes) or two ... nuclei, leading to the formation of a single cell - zygote, giving rise to a new generation."6
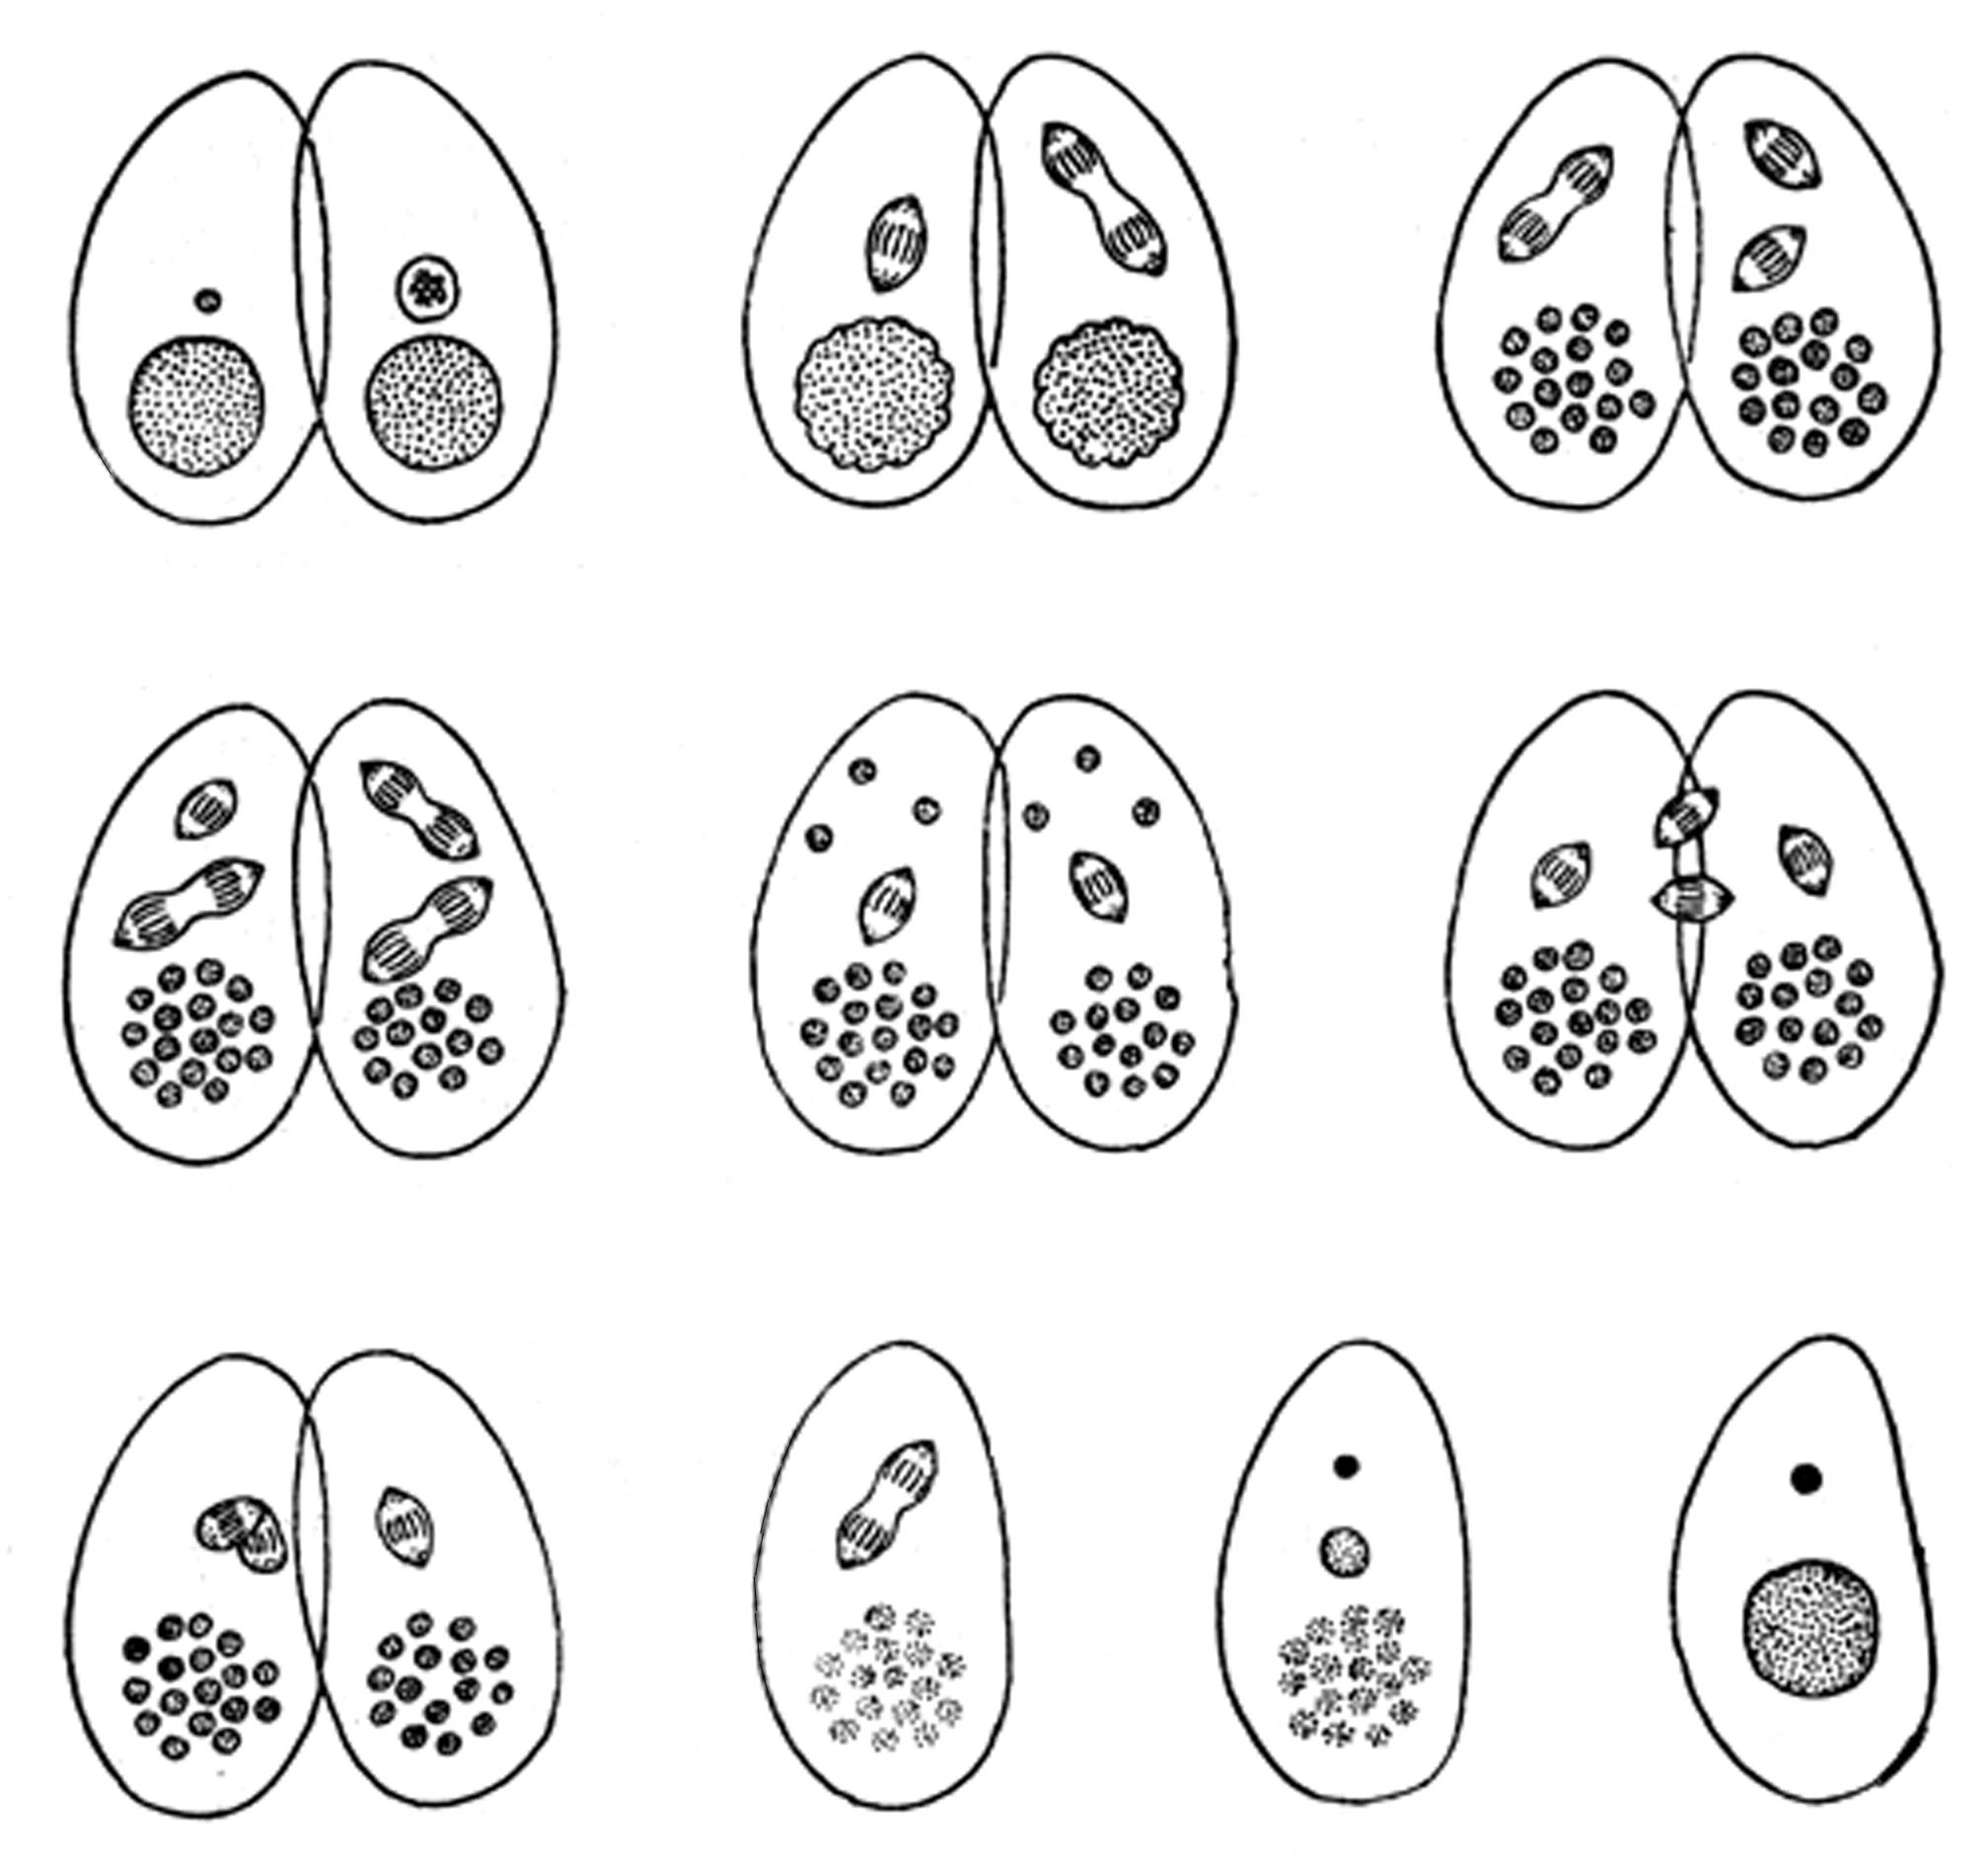
Fig. 2.9. Conjugation of infusoria (schematized). From time to time infusoria have a special and extremely peculiar form of sexual reproduction - conjugation. Since infusoria have sizes that belong to the right slope of division, the process of exchange of genetic material occurs according to a very complex and tense scheme, which requires infusoria to temporarily "stick together", i.e. synthesize.
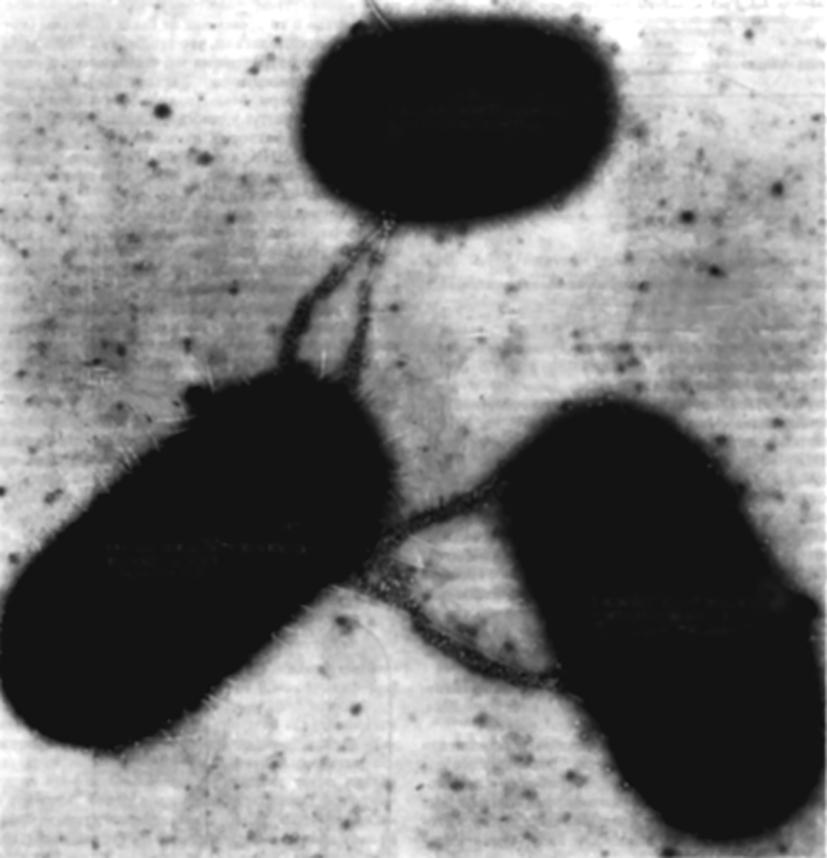
Fig. 2.10. Microphotograph of conjugating bacteria (one "male" and two "female" individuals) obtained with a transmission electron microscope. The scale of the entire field of the process (about 10 µm) is such that it takes place at the lowest point of the stability trough, where synthesis occurs virtually without any structural changes. This is what allows bacteria, unlike infusoria, to "calmly" exchange genetic material. This process resembles the draining of oil from tankers
This same barrier is also a SYNTHESIS BARRIER, as basically only organisms smaller than the barrier are capable of synthesis and subsequent reproduction.
Already for the majority of organisms with the size more than \(10^{-2}\) cm synthesis is not peculiar, and if it occurs, it is in the form of a peculiar sexual act for protozoa, called conjugation - temporary synthesis for exchange of hereditary information from parts of their nuclear apparatuses (see Fig. 2.9).
"The two infusoria come close together, are closely attached to each other, and in this form swim together for quite a long time... Then the conjugates separate " 7.
Conjugation cannot be attributed to a full synthesis according to item #2 (see page 256), it is like a quasi-synthesis, which is manifested as mating on the right slope of S-Trough #6.
Indeed, for infusoria, conjugation is restricted to individuals larger than 1.6 \(\cdot 10^{-2}\) cm, i.e., on the right slope of the S-Trough.
It is noteworthy that for bacteria, conjugation occurs according to a different scheme 8, reminiscent of oil draining from tankers (see Fig. 2.10). Thus, while infusoria "embrace" in a passionate impulse (otherwise, the synthesis process cannot be held on the right slope), bacteria calmly exchange hereditary material, because on the left slope synthesis proceeds simply and without tension. Let us give some concrete examples of the existence of division-Synthesis BARRIERS among protozoa.
-
Ichthyophthirius infusoria grows and, only after reaching a size of about 0.1 cm, begin successive divisions 9.
-
Sporozoites of the coccidia, with average lengths of less than \(10^{-3}\) cm, grow and divide into several spores when they reach a size of 3 \(\cdot 10^{-3}\) cm. The development of blood sporozoites is approximately the same 10.
-
In gregarines of various kinds, a macrogamete with a maximum size of (0.35 - 0.7) \(\cdot 10^{-3}\) cm fuses with a microgamete (0.35 \(\cdot 10^{-3}\) cm), the newly formed body grows to the oocyte stage (more than 3 \(\cdot 10^{-3}\) cm) and only then experiences repeated division.
Analyzing the process of reproduction of unicellular cells, we come to the following CONCLUSION.Unicellular cells, which have sizes larger than the synthesis-division BARRIER (CDB) (average value - 3 \(\cdot 10^{-3}\) cm), do not increase in size before division, they seem to already have the potential to divide. In this variant, daughter cells grow after division to the size of the original mother cell.
Unicellular cells, which are less than \(10^{-3}\) cm in size, usually grow to sizes greater than 3 \(\cdot 10^{-3}\) cm before the act of division itself. The products of their division are immediately formed of the "right" size for subsequent life activity (see Fig. 2.11).
So, those of the protozoa whose size is less than the division threshold grow before division, those of the protozoa whose size is greater than the division threshold grow after division. However, in both cases, the size of the fissile system at the moment of division is greater than the SYNTHESIS- division BARRIER.
No protozoan cells BETWEEN the assembled form any complex systems.
There is no joining together of individual adult and independent cells in nature. Figuratively speaking, individual cells are "individualists."
Colonies of protozoa, which sometimes reach a very respectable size (for example, the colonies of Volvox gloobator includes up to 20 thousand individual cells, their size reaches 2 mm), are always formed as a result of "sexless reproduction by division, in which the products of division remain associated with each other " 11.
Here we should note the terminological inconsistency of the concept of colony for protozoa and for social systems. In the latter case, colonies are most often formed through colonization - the process of settling, assembling, joining different individuals into one geographical space. Nothing of the sort is observed in the world of protozoa. There is no assembly and connection, cells create colonies by dividing mother individuals without detaching "children" from them.
MULTICELLULAR CELLS. The growth process inherent in cells always has its limit - it is either death or division with the formation of new cells.
The process of cell reproduction occurs only by dividing cells into two or more parts. There are several types of division: amitosis, mitosis and meiosis (listed in order of complexity). Each type of division carries a specific burden in the life of an organism.
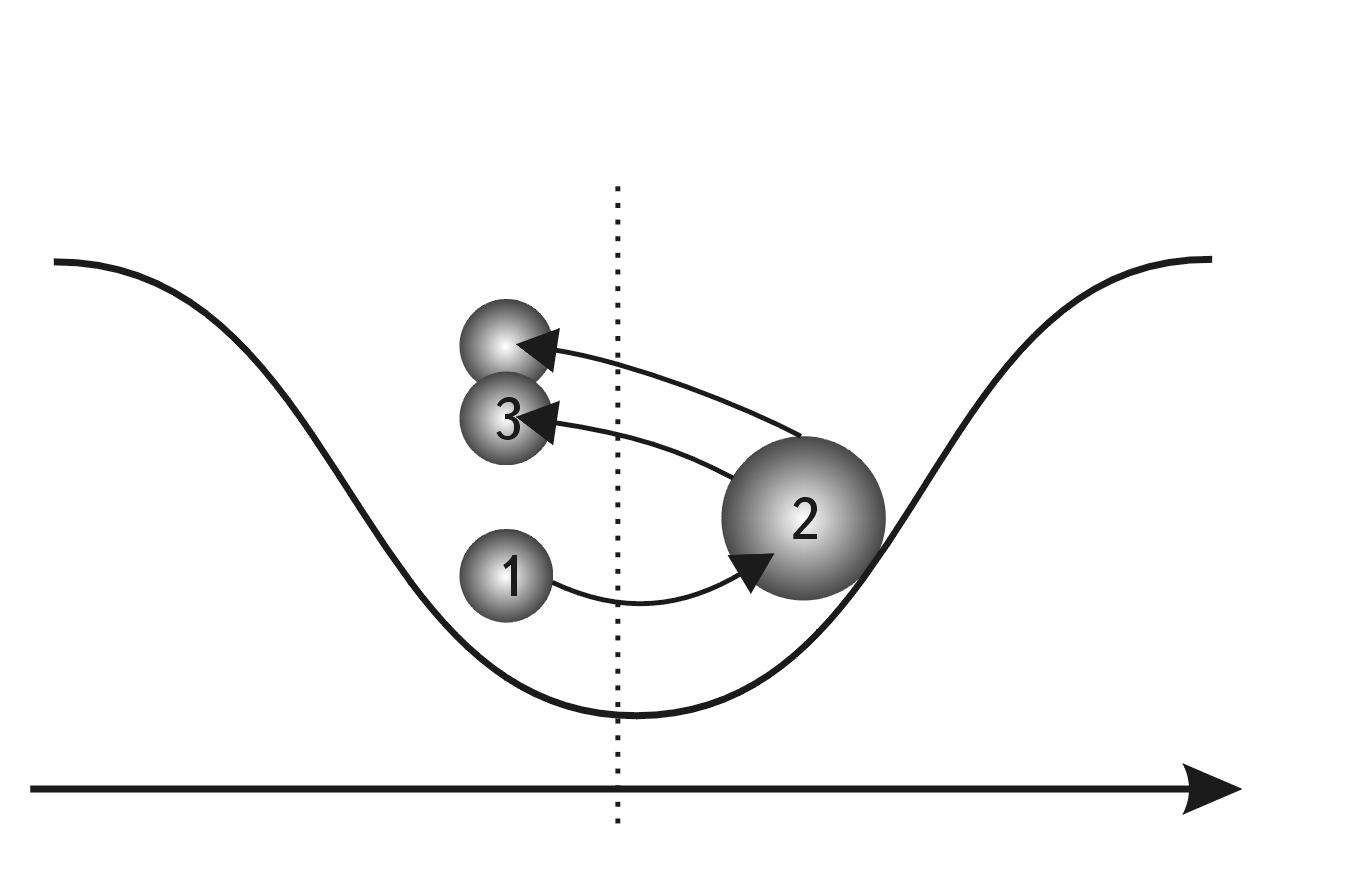
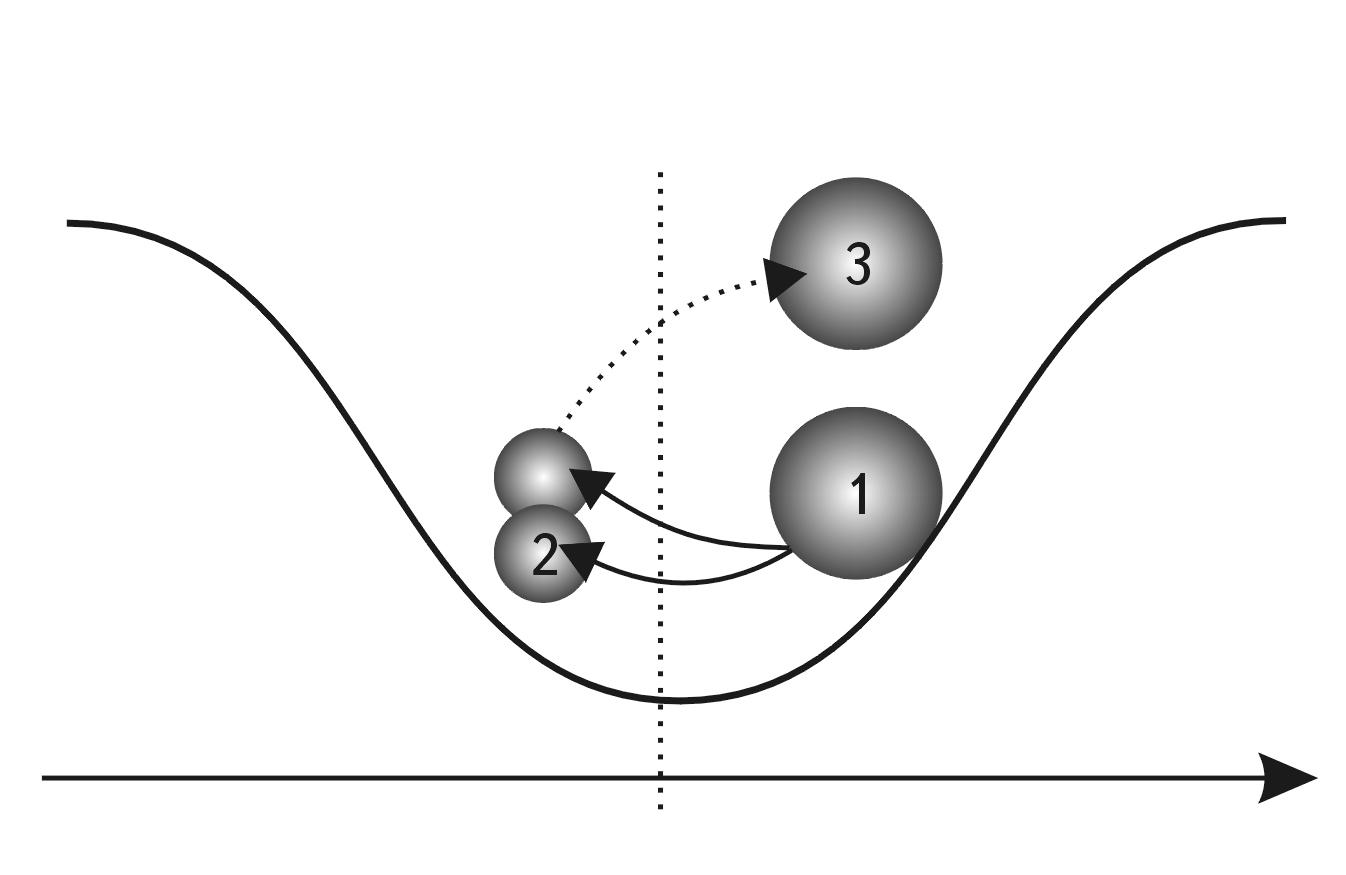
Fig. 2.11. Two types of cell division process. А. If a cell is smaller than the SD barrier, it first grows (1-2) to a size that exceeds the SD barrier before dividing, then divides (2-3) to its original size and continues to function at that size thereafter (3). B. If a cell is larger than the SD barrier in its normal state, it does not grow before division. The process of division occurs (1-2), and then the resulting "fragments" grow back to the original normal state (2-3).
Despite the fact that all types of division are characterized by their morphological and functional peculiarities, they have similar features, so we are able to make some generalizing conclusions.
The most studied and most common type of division in multicellular organisms is mitosis. It occupies approximately 4% of the life cycle time of cells capable of division 12. Mitosis is preceded by growth in the size of the nucleus and the cell itself. This growth is, according to most scientists, the main cause of division.
Thus, for example, "on bone marrow smears of healthy people and people with various disorders of hematopoiesis... in the norm, the division of maternal cells occurs only after the cell reaches the optimal size (diameter 18-19 microns)... (emphasis mine - S. S.) Sometimes... at hyperfunction of hematopoietic organs the cells do not reach the optimal size, and their division completely stops." 13.
Analysis of the work of the famous American cytologist D. Mezia 14 has shown that the characteristic size of cells during division is (3...6) \(\cdot 10^{-3}\) cm, and the divergence of chromosomes occurs at distances of (1...5) × \(10^{-3}\) cm. Consequently, for cells of multicellular organisms, the minimum threshold of division is the size of 10 μm, but, most likely, normal division always begins at 30 μm and above.
D. Mezia himself summarizes the data considered in the following way: "All these experiments seem to indicate that a cell must reach a certain critical mass before it can divide... Cells are incapable of further division and die when their size exceeds the critical minimum." 15
However, D. Mezia is very uncertain about the specific value of this minimum. This once again indicates that the question of the threshold of division (synthesis) in cytology, judging by the data available to the author, has not been studied to the end. We see that it is of fundamental importance, especially since for S-TroughNo. 6 this barrier is closely related to the scale center of the Universe.
But the most striking thing is that in cytology the true cause of division has not yet been determined. For at first sight the cell has no reason to enter into such a complex and unnatural process for its whole life as division into two parts. Purely speculatively, it could grow to a substantially larger size, perfecting its internal structure and increasing its mass. So why did evolution put a barrier to this process of cell growth by synthesis at a threshold of about 30 microns? Why didn't nature create meter-sized living systems in the form of a giant cell with developed external and internal structures? It is impossible to say that the cell lacks a reserve of informational complexity, because the processes going on in the cell amaze the imagination with the virtuosity of nature, and they are by no means simpler than the processes going on in multicellular systems. Why did Nature put a BARRIER for these systems at the lowest point of S-Trough of Potential stability #6?
The complexity of the answer to this question in modern biology is quite understandable. Biologists cannot imagine, around what important barrier to the Universe all this "purely biological" controversy takes place. It is impossible to guess that a growing cell reaches the size of the MASSIVE CENTER OF THE UNIVERSE and then passes from the large-scale zone of dominant ALLENSE SYNTHESIS to the large-scale zone of dominant ALLENSE division, if we rely solely on biological data. Here only the PRINCIPLE OF MASSIVE SUBJECT helps, which allows to transfer the regularities of synthesis-division of atomic nuclei through 10 orders to the zone of synthesis-division of biological systems. Let's return to the synthesis-division BARRIER. Consideration of the totality of cytological data leads to the impression that cell division (under all changing external conditions) occurs almost always at the boundary of the transition from synthesis to division, at the lowest point of SWS #6. If the initial cell has very large dimensions and, as a consequence, is removed along the S-axis from the BARRIER C-D zone very far to the right, it divides according to a different scheme. Here the fragmentation of the fertilized cell is very indicative. When the size of the ovum is close to \(10^{-2}\) cm, it divides into two, four, eight, etc. parts each. During the process of fragmentation, the egg does not increase in size, but divides into increasingly smaller cells. The number of cells reaches several hundred or thousands during the period of crushing 16. Synchronous fragmentation with size reduction apparently ends when the cells reach the lower division-synthesis threshold of 10...16 µm. Figuratively speaking, the oocyte rolls down the right slope to the lowest point of stability of the S-trough, after which the process of development through division becomes impossible.
For even smaller systems, development is only possible by synthesis. The pattern of fragmentation of very large oocytes is even more different. They mostly do not divide into large halves, but their body is literally fragmented (Fig. 2.12 17), the emerging new cells having sizes close to 100 µm. For the largest oocytes (Fig. 2.13 18), division essentially becomes a separation of small cells from the egg; it does not follow the pattern of two, four, eight. The appearance of small cells in this case is a vivid example of the fact that the most active natural division zone is very close to the division-synthesis threshold on the SW model.
Consequently, regardless of the initial size of the oocyte, the very process of division takes place in the same size zone: 10...100 microns, i.e. in the range of ICV and in the lowest part of the potential stability trough #6.
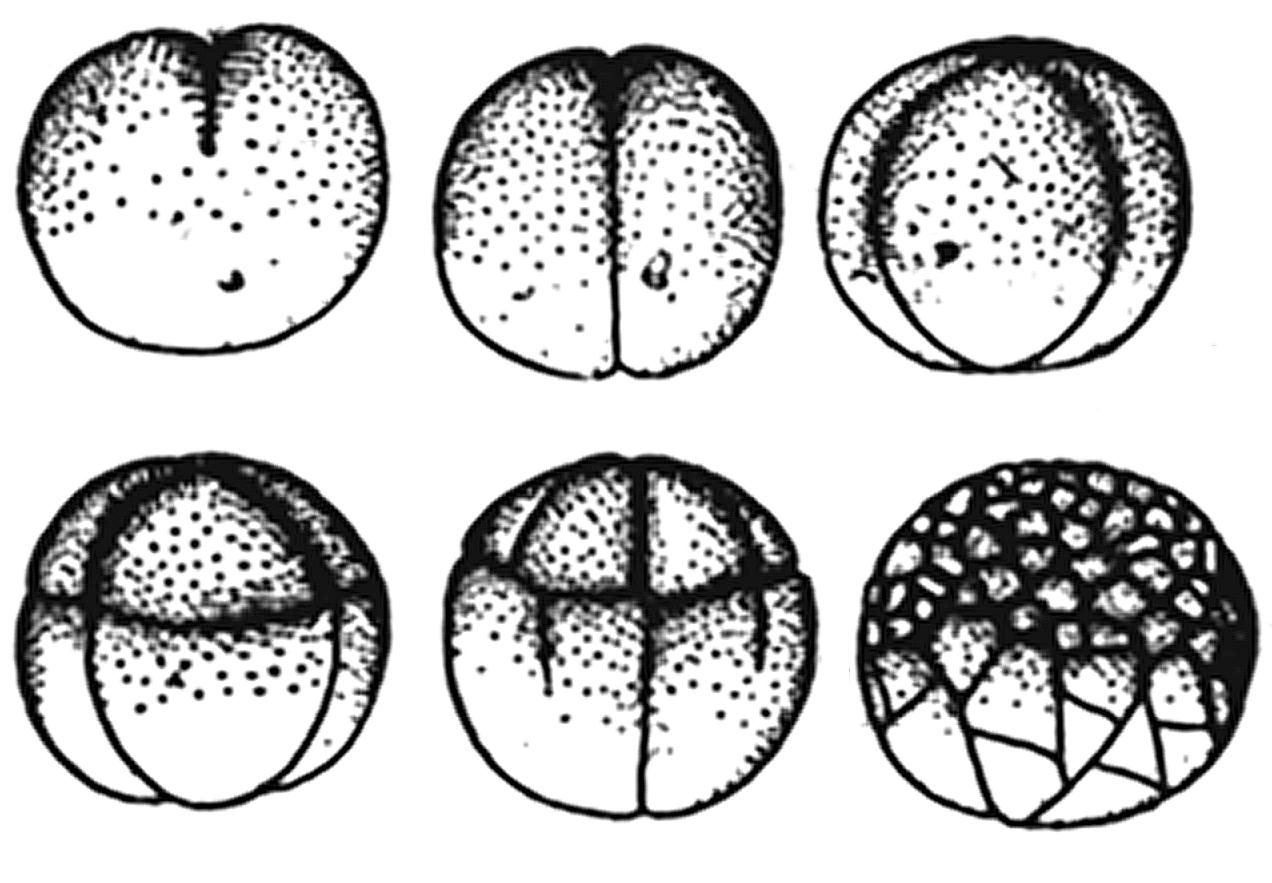 Fig. 2.12. Uneven (starting from the third crushing) crushing of a frog egg. Unevenness crushing is explained in the model by the fact that the egg is much larger than the average cell size
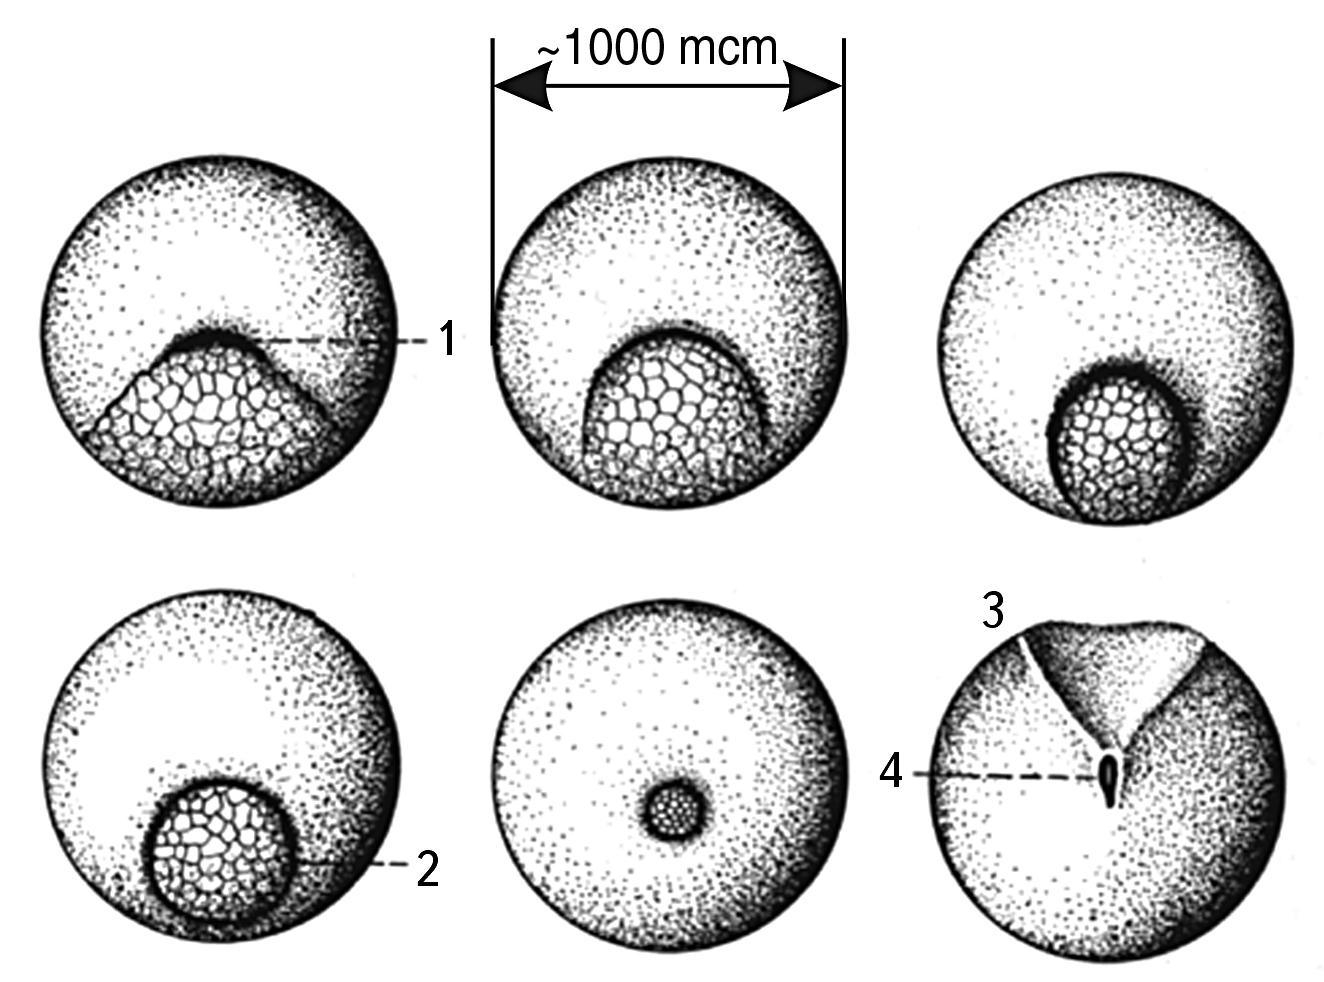 Fig. 2.13. Sequential stages of amphibian gastrulation 19.
The figure shows that the emerging cells have sizes much smaller than the primary germ cell. This indicates that the division occurs in the size zone close to 10-100 µm
Thus, we have shown that cell division of multicellular organisms occurs only on the right slope of S-trough No. 6 and mainly in the lower part of this slope.
Let us now consider some peculiarities of the division and synthesis of sex cells.
To start the process of division of different types it is necessary to gain different "height" in M-NAME. This takes different time. At the same time, nature does not need to include any special stimulants for simple division: the cell grows naturally and having "climbed" just above the division threshold, divides into two parts. This is not the case with the division of a sex cell. Here nature needs to "roll" the cell to a higher potential level so that before fertilization it does not start dividing, and after fertilization it can experience division up to several thousand times until the size of all cells "descends" to the minimum possible threshold.
"A small somatic cell 10-20 µm in diameter would normally take about a day to double in mass in preparation for division. The same cell, at the same rates of macromolecule synthesis, would take a very long time to reach a thousand times the mass characteristic of a mammalian egg (100 µm diameter) or a million times the mass of an insect egg (1000 µm diameter). It is clear that their oocytes must have special mechanisms to achieve such large sizes " 20. We can add: and special mechanisms that inhibit division until the right moment.
The male germ cell has the exact opposite task. It needs to fuse with a female germ cell. As already mentioned, cells in general are not characterized by the process of synthesis. The only exception is the case of sexual reproduction, when the sperm literally pierces the shell of the ovum and its nucleus fuses with its nucleus (see Fig. 1.6). Let us verify our PROPOSITION that synthesis takes place only when the size of objects is smaller than the C-D threshold.
If nature "knows" about the S-Trough of Potential stability and the synthesis-separation barrier, then in order for the synthesis process to proceed actively and surely, the male sex cell must "roll up" to the opposite left slope of the M-trough before fertilization. This does occur during the process of spermatogenesis. The initial male and female sex cells have the same size. Then nature triggers different preparation processes: female cells grow in size, while male cells, on the contrary, shrink. "Haploid cells that fuse at fertilization are called gametes. In a typical case, two types of gametes are formed: large, immobile oocytes (or eggs) and small, mobile sperm (or spermatozoa.) "21
Figuratively speaking, nature takes initial cells of approximately the same size, then spreads them out from the synthesis-division barrier to the left and right by a distance of several orders of magnitude** and only then lets them go, after which they roll up to the center of highest stability in M-NAME #6.
As a result, the synthesis of two germ cells always proceeds in such a way that one of them (male) is on the left slope of the S-Trough, in the size zone of allowed synthesis. Example: a human spermatozoon, its main part is very small (see Fig. 1.6) (the length of the spermatozoon is not a characteristic size, since the tail performs the function of a transport agent and is discarded at the moment of synthesis like a spent stage in a rocket). Despite the enormous variation in the size of the animals themselves, the length of their spermatozoa differs very little and is practically unrelated to body size. For example, the length of spermatozoa22:
- sperm whale - 4.1 \(\cdot 10^{-3}\) cm;
- foxes - 5.3 \(\cdot 10^{-3}\) cm;
- elephant - 5 \(\cdot 10^{-3}\) centimeters;
- of a human being is 5.3 \(\cdot 10^{-3}\) cm;
- mice - 8 \(\cdot 10^{-3}\) cm;
The size of the head, the main body of the spermatozoon, is much smaller. For humans, they are 4-6 microns, or ~5 \(\cdot 10^{-4}\) cm. While the egg is the largest cell in the body, the sperm (or spermatozoon) is usually smaller than all other cells. Its head is practically the smallest in the body. Here, nature has not spared on reliability: sizes of 4-8 μm belong, in full accordance with the requirement of the dynamic SW model, to very stable synthesis sizes.
So, as we assumed, based on the similarity with S-trough No. 4, the SYNTHESIS-DIVISION THRESHOLD is clearly manifested in the 10-100 MCM size range.
This barrier is likely to have a double or even triple structure: 16-18 μm, 30-35 μm, 45-50 μm; it is possible that these three barriers relate to mitosis, amitosis, and meiosis, respectively.
Systems with sizes up to this barrier can evolve and grow only through synthesis, with sizes after it - only through division. Proceeding from this assumption, going to the right from this barrier up the right slope of S-Trough, we should theoretically encounter only evolution through division. Going to the left - evolution through synthesis. The author has no opportunity to analyze in depth and in detail the subtleties of this process in biology. We will give here only a cursory and fragmentary analysis of some indicative facts.
RIGHT SLOPE OF S-Trough of Potential stability #6. If we analyze the process of reproduction and growth of multicellular organisms, the whole right slope of S-trough No. 6 provides us with examples of division only. Passing mentally to the right of the synthesis-division barrier, one can find an example of budding of new individuals from a hydra, even to the right - scale coordinates for egg and larvae laying in insects, genera - in viviparous animals, etc. It is obvious that in all cases the final stage in the process of emergence of a new creature is division (for unicellular) or separation from the mother body (for multicellular). It is already quite obvious that on the right slope of the S-Trough there is no synthesis of two individuals into a new whole. Nature has left all evolutionary processes of synthesis behind the barrier (on the left). synthesis on the right slope is possible only as a temporary act (e.g., sexual).
LEFT SLOPE OF S-Trough of Potential stability #6. Here, the formation of new systems mainly proceeds by synthesis.
Although the division mechanism is also often used as a preliminary preparation for it. But, most likely, the division always takes place in the dimensional zone of the stability saddle: from 1 to 10 angstroms (see Fig. 2.7).
Biosystems in this range include such biomolecules as DNA, proteins, as well as viruses, bacteria, and intracellular organelles.
Proteins and nucleic acids. Proteins make up about 50% of the dry body weight of all organisms, and they are organized in a very hierarchical way: they have secondary, tertiary and quaternary structures23. The primary polypeptide chains of proteins are synthesized on a "conveyor belt" in ribosomes (which are about 200 angstroms in size) by assembly.
"Protein biosynthesis is a multistep process, it is carried out with the participation of many organoids of the cell: nucleus, ribosomes, mitochondria, various types of nucleic acids, ATP and other compounds.
The protein synthesizing machinery of the cell works in an extremely coherent manner in both space and time. It is controlled and regulated by a highly sophisticated biological cybernetic system... "24
Synthesis is so natural on the left-hand slope that even proteins artificially fragmented into several levels are reassembled into a whole without losing their original properties after certain conditions are created. "It has been found that a large molecule of protein of one species of snail with a molecular weight of 574,000 breaks up when the solution is alkalized, first into halves, then into eighths, and then into sixteenths of a fraction, i.e. into its constituent subunits ('blocks'). If such a solution is acidified, the subunits which have been broken up are reassembled and associated into a whole."25
It is impossible to imagine such a process with a multicellular system. If we divide any organism into cells, a spontaneous return to the initial state is unbelievable. This once again demonstrates that SYNTHESIS DOMINISES ON THE LEFT SLOPE, and DEVISON ON THE RIGHT SLOPE.
"It is important to note that each of the previous structures of a protein predetermines the subsequent one: primary to secondary, secondary to tertiary, and so on. And what comes next? And further protein molecules with tertiary structure can unite by so-called self-assembly into associations of quaternary structure (italics mine - S. S.) of even higher level of organization. It should be said that simple molecules, the so-called protomers, i.e. amino acids of proteins or nucleotides of nucleic acids, acquire new physical and chemical properties and new biological functions in the process of their transition to higher levels of organization."26
The above quotation best shows the role of assembly in the formation of macromolecules; the term "self-assembly" itself indicates the energetic benefit of such a process on the left slope. Moreover, this property of self-assembly is characteristic not only for multicellular proteins, but also for virus proteins: "Protein subunits of viruses have an amazing ability to self-assemble and create thus the most diverse protein ensembles of the fourth order with elegant architecture."27 For the tobacco mosaic virus, such self-assembly results in a shell 180 angstroms in diameter and about 3,000 angstroms long, indicating that the size range from 10 to 3,000 angstroms, or \(10^{-7}\) cm to \(10^{-5}\) cm, is dominated by synthesis as a way of increasing the complexity of structures and building new systems. Synthesis is a key process for the formation of DNA (RNA) as well. However, there are some nuances here. The fact is that before synthesis of a new copy of DNA, the process of division of primary DNA into two strands takes place. Consequently, division and synthesis go side by side here. We remember the rule that the main thing is the final step of the process. Here division is a preparation for the final act - synthesis.
VIRUSES. Viruses have no sex, so they cannot reproduce sexually like higher organisms, nor do they reproduce by division like bacteria or protozoa.
"Nevertheless, viruses reproduce themselves in great numbers... and in such peculiar ways that at one time this phenomenon was called reproduction... During the reproduction of viruses, nucleic acid molecules are copied by biosynthesis, and according to the information contained in them, viral proteins are synthesized "28.
"...The sequence of events leading to the formation of a viral particle is as follows: 1) synthesis of viral protein; 2) 'protein maturation'; 3) binding of protein to newly formed viral RNA; 4) formation of complete viral particles "29.
So, a virus, unlike a normal cell, does not reproduce by division. It penetrates into another cell, or rather, it injects its genetic material into the cell, then the cell replaces its own DNA with the virus' DNA, and the cell dies, releasing new viruses that are alien to it. This gruesome scene is very vividly portrayed in some modern sci-fi movies like Aliens. Only there the scale of entities penetrating into a human being is increased a million times, and the principle is similar to the principle of virus reproduction. Hence the horror. In nature, such "synthesis" can not be. It is forbidden. There is a strictly defined scale interval for this kind of process: from \(10^{-6}\) cm to \(10^{-5}\) cm.
All stages of virus reproduction, starting with penetration into the cell, which is somewhat akin to the penetration of the sperm head into the egg cell, is synthesis. However, while in the case of fertilization a rapid process of growth of a multicellular system begins, in the case of virus infection, cell death and a rapid process of growth of single-cell viruses begin.
BACTERIA. Bacteria reproduce by division30, in addition, they have been found to have the simplest sexual reproduction of the conjugation type31. "Under favorable conditions, bacteria grow very rapidly... After reaching a certain size, bacteria switch to sexless reproduction (binary division)... "32
There are plenty of bacterial species that divide at about 1 micron in size, which is at least one order of magnitude left of the division barrier on the S-axis.
Thus, bacteria violate the beautiful regularity of our model - they divide to the left of BARRIER C-D***, in the synthesis zone***. However, this violation only shifts the division barrier to the left of the one order (out of ten) set for all other cells. And this violation is peculiar only to bacteria; the author did not find such exceptions in cells.
It would be possible to accept this deviation (10%) as a model error and write it off as statistical dispersion. But let us not simplify nature and consider the problem of bacterial division more carefully.
First, all autotrophic (independently living) bacteria have a size greater than 10 µm, so their division does not violate the BARRIER rule. Only heterotrophic bacteria violate this rule, i.e. those that do not live in nature independently, but exclusively at the expense of other organisms.
It is these bacteria, which are between \(10^{-4}\) cm and \(10^{-3}\) cm in size (i.e., in the synthesis zone), that violate the general rule.
In the Atlas of the Anatomy of Bacteria Pathogenic to Man and Animals33 one can find examples of division in a great many known bacteria. Almost all of them divide at sizes between 1 and 5 µm, and all of them are smaller than 10 µm.
It is extremely important for us that the multiplication of pathogenic bacteria can not be recognized as an evolutionary process, the process of complication of living systems, because if their multiplication is not stopped, the multicellular organism will die and decompose.
From this we can make a preliminary PREPARATION. Only division to the right of the synthesis-division barrier is an EVOLUTIONAL process for the biosphere; if division occurs to the left of the barrier, in the synthesis zone, it is a pathological, destructive and regressive process.
In addition, the division of pathogenic bacteria takes place inside the organism, on a foreign nutrient medium, so it is most likely a parasitic process. It is energized by the processes occurring in a multicellular organism. Consequently, the division of pathogenic bacteria in the forbidden zone of synthesis can proceed only artificially, due to "exploitation" of processes that do not violate the established regularity.
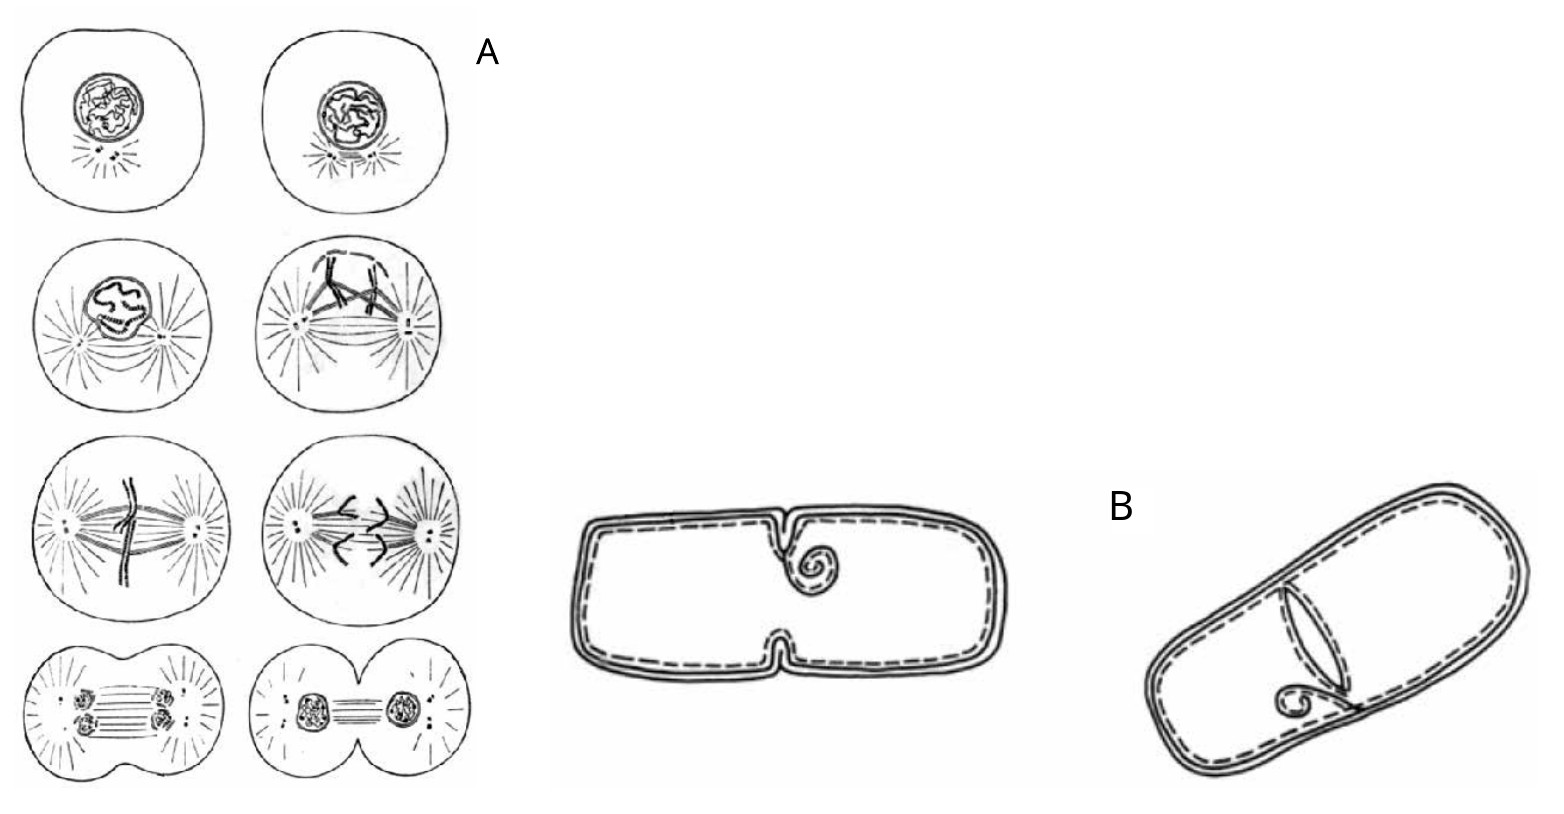 Fig. 2.14. A. Schematic of the successive stages of mitosis. Here we see the gradual formation within the cell of two symmetrical centers, each of which gradually forms into an almost independent cell. And these two cells seem to stretch and tear the mother cell into two parts. B. Scheme of bacterial division. It can be seen that in contrast to mitosis, in which there is a holistic division of the cell into two duplicate halves, in bacteria there is a kind of internal cutting of the cell, due to germination of the "slide" (from stage "a" to stage "b")
Second, the process of bacteria dividing into two daughter parts is different from the process of cell division (Fig. 2.14 34 35).
Cell mitosis is a process of dividing into two parts of two independent cells prepared for this in advance. We see something different in bacterial division. Inside the mother bacterium, a septum appears on the membrane, which grows and gradually divides the bacterium into two parts. This is similar to the inward movement of a flap inside the bacterium that cuts it in half. It is noteworthy that after such a "cut" the daughter bacteria do not move apart, but stay together, forming long chains. Thus, the process of bacterial division takes place in the FORBIDDEN FOR DEFECTION zone of the S-Trough of Potential stability model.
The easiest thing to do is to recognize that bacteria are an exception to the general rule, especially since they violate it by only 10%. But we can try to find in this exception a logic that only reinforces the rule. This logic consists in recognizing the possibility of cell division in the synthesis zone only as a pathological process, as a parasitic and destructive process.
In addition to the factors listed above, one can PROPOSE that division of micron-sized organisms, such as non-pathogenic bacteria and blue-green algae, occurs only if they are within a metasystem of a large order of size, such as colonies that are larger than 10 microns. Could it be that the energetics of colonies is such that it is the reason why bacteria division occurs on the left slope?
Taking into account the specificity of bacterial division, let us put forward a new HYPOTHESIS.
In addition to the CENTRAL SYNTHESIS-DIVISION THRESHOLD, which lies in the size range of 10-30 µm (rather closer to 16 µm), there are at least TWO other BARRIERS - RIGHT AND LEFT FROM THE MAIN ON S-AXIS.
The left barrier is likely shifted by an order of magnitude, this is close to 1.6 µm. The right barrier is also shifted by an order of magnitude, about 160 µm.
The left barrier is characteristic only for prokaryotic cells. The division in it is clearly degenerate, resembling the snapping of a camera aperture or the entrance of a slide gate.
The right barrier (160 microns, or \(10^{-1.8}\) cm) is characteristic only for the division of sexual oocytes of multicellular cells, which has a cascade, multistage character and ends at the central barrier. The oocytes, as mentioned above, grow for an abnormally long time before division; they seem to climb to a great height of the right slope in order to rush to the lower point of stability by an avalanche of fragmentation after staying for a short time at the right barrier.
The central barrier (16 μm, or \(10^{-2.8}\) cm) is the main barrier; it is characteristic of mitotic division of all eukaryotic cells, which is usually binary. At the same time, the central barrier apparently plays an important functional role in the life of all cell types.
A very important difference in the mechanisms and fundamental patterns of division near these three different barriers should be emphasized: diaphragmatic division near the left barrier, binary division near the central barrier (mitosis), and complex cascade division of the oocyte near the right barrier*.
However, it cannot be excluded that for blue-green algae the central barrier is analogous to the right barrier for oocytes, since they, having climbed beyond it, divide cascade into several parts.
Of course, it is too early to draw final conclusions, since a more thorough study of the scale features of division of all kinds of cells is necessary. It is not excluded that the value of the size from which division exactly begins is not rigidly fixed on the S-axis, but floats along it in the range of a small tolerance. In this case, each barrier represents a statistical distribution curve with a mode on the dimensions noted above. It is possible that each of the main barriers has an "understudy" on the right side, which is defined by the HEV. In this case, the central barrier, located at 16 µm, may have a "neighbor to the right" at 50 µm. It is possible that different cell types (even within the same barrier type) have their own submodal characteristics of large-scale thresholds of synthesis-separation.
The author is convinced that the study of the problem of the synthesis-separation barrier for cells is a separate very extensive area of the laws of nature, which for all fields of science is of great importance, since all these processes take place in the very center of the S-axis of the Universe.
So, on the left slope of S-Trough #6, the complication and development of biosystems proceeds mainly by synthesis**.**
Only the reproduction of pathogenic bacteria and some unicellular species of the same size group remains a big problem for the model.
BONE SYSTEMS. Let us consider what regularities in the synthesis-separation process exist for cosmic systems of nature. Thus, for example, from the practice of grinding mineral materials in order to obtain fine powders it is well known that crushing mineral particles to a threshold of about 10 microns is one energy process, and finer than 10 microns, and especially finer than 1 micron, is already another process. "If it is necessary to have an average size of grinding products larger than 10-15 microns, it is necessary to use dry grinding... In the case of ultrafine grinding, the average size of grinding products 1-0.1 microns can be obtained by using only liquid disperse media... because in dry grinding can occur a significant aggregation (emphasis mine - S. S.) of small particles "36.
Discussion of this problem with G. P. Zaitsev, one of the authors of the mentioned book, convinced me that specialists in the field of mineral materials grinding are well aware of the peculiarity of the transition zone around 10 microns, but never suspected its universal cause. I asked G. P. Zaitsev to write about this phenomenon. I give here his text without changes.
"As shown by the experience of using plasma-chemical titanium nitride powders up to 0.1 microns in size, in the synthesis of oxide-nitride cutting ceramics high degree of tendency to aggregation of such powders in the final product leads to large (up to 20-30 microns) grains of titanium nitride, which in turn reduces the mechanical and operational properties of ceramics. The same effect, although to a lesser extent, is observed with prolonged dry grinding of corundum powders, when the specific surface, despite the increase in grinding time, from a certain time begins to decrease, indicating an increase in the proportion of aggregates in the total mass of the powder".
So, if up to 10 microns the step-by-step crushing of fractions occurs according to the standard scheme: each unit of newly formed surface requires approximately the same amount of energy and time, then at the transition to the size zone of less than 10 microns the time and energy costs for the formation of a new surface (further crushing) grow nonlinearly. Moreover, in this size zone particles in the process of grinding begin to stick together into conglomerates, which, of course, prevents their further crushing. It is also very indicative that micron and submicron powders obtained by plasma-chemical synthesis clump into rather symmetric conglomerates of 20-30 microns in size, which are located exactly at the bottom of S-Trough #6.
The process of aggregation, adhesion and assembly of material particles on the left slope of S-trough No. 6 is a phenomenon universal to nature, not specifically technical. Many examples can be given here, but we will limit ourselves to two.
Particles in outer space often form aggregates as small as 40 microns. "...Lunar dust particles are charged and have stable internal electric polarization. As a consequence, grains in lunar samples are attracted to each other...forming stable groups. This phenomenon is probably characteristic of all solids exposed to radiation in outer space "37 (see Figure 2.15).
Second example. On the surface of the Earth in natural conditions there is a continuous process of rock destruction. Due to temperature variations and the effects of moisture and water, rocks crumble and turn gradually into sand. If you look at old mountains, it becomes obvious that pieces of rock are gradually breaking down, decreasing in size and "rolling" from the right slope of S-Trough to the left until they reach the size of grains of sand. The sand grains are of various sizes, but are mostly tens of microns.
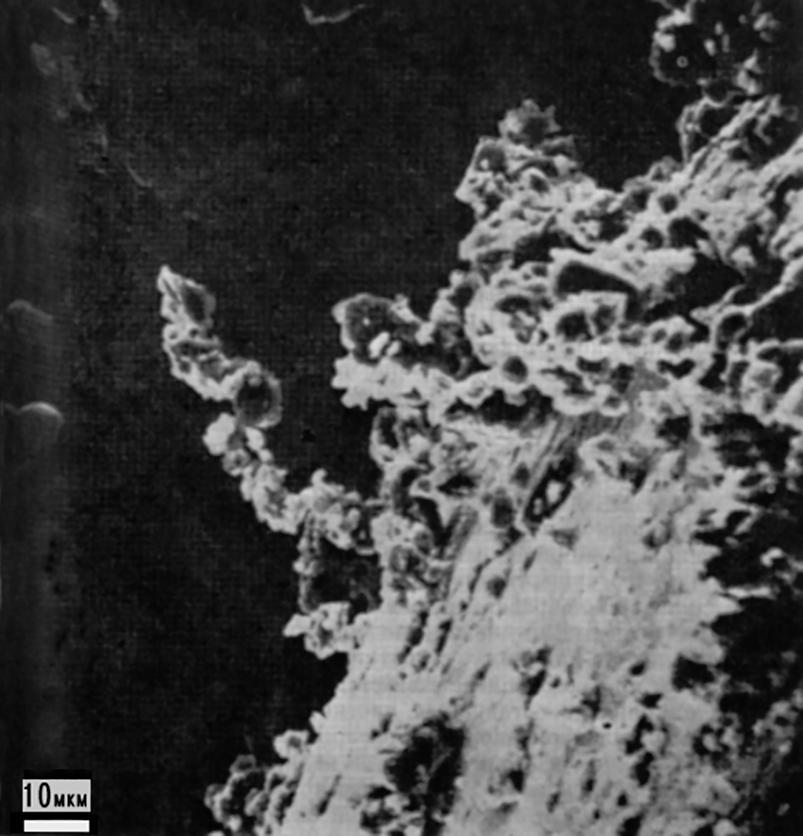 Fig. 2.15. A cluster of cosmic particles in the form of a flexible chain extending about 40 µm from the base of the aggregate. The chain-like structure illustrates the electric dipole nature of individual microparticles. This photo shows an example of natural sticking (synthesis) of particles smaller than 10 microns in outer space
If there were no kink in this scale region and the right slope of S-Trough had an extension into a region of much smaller dimensions, all grains of sand would gradually continue their way to the left and would turn first into the smallest dust, then into powder, then into molecules and, finally, would disintegrate into atoms (see Fig. 2.16). Then all the old mountains would have "vaporized" long ago. Obviously, some fundamental principle of nature prevents this from happening. We BELIEVE that the reason preventing the "mountains from evaporating" is the presence of a barrier for the division process in the 10 MCM zone, to the left of which the decay process is reversed and the directly opposite process of synthesis comes into play.
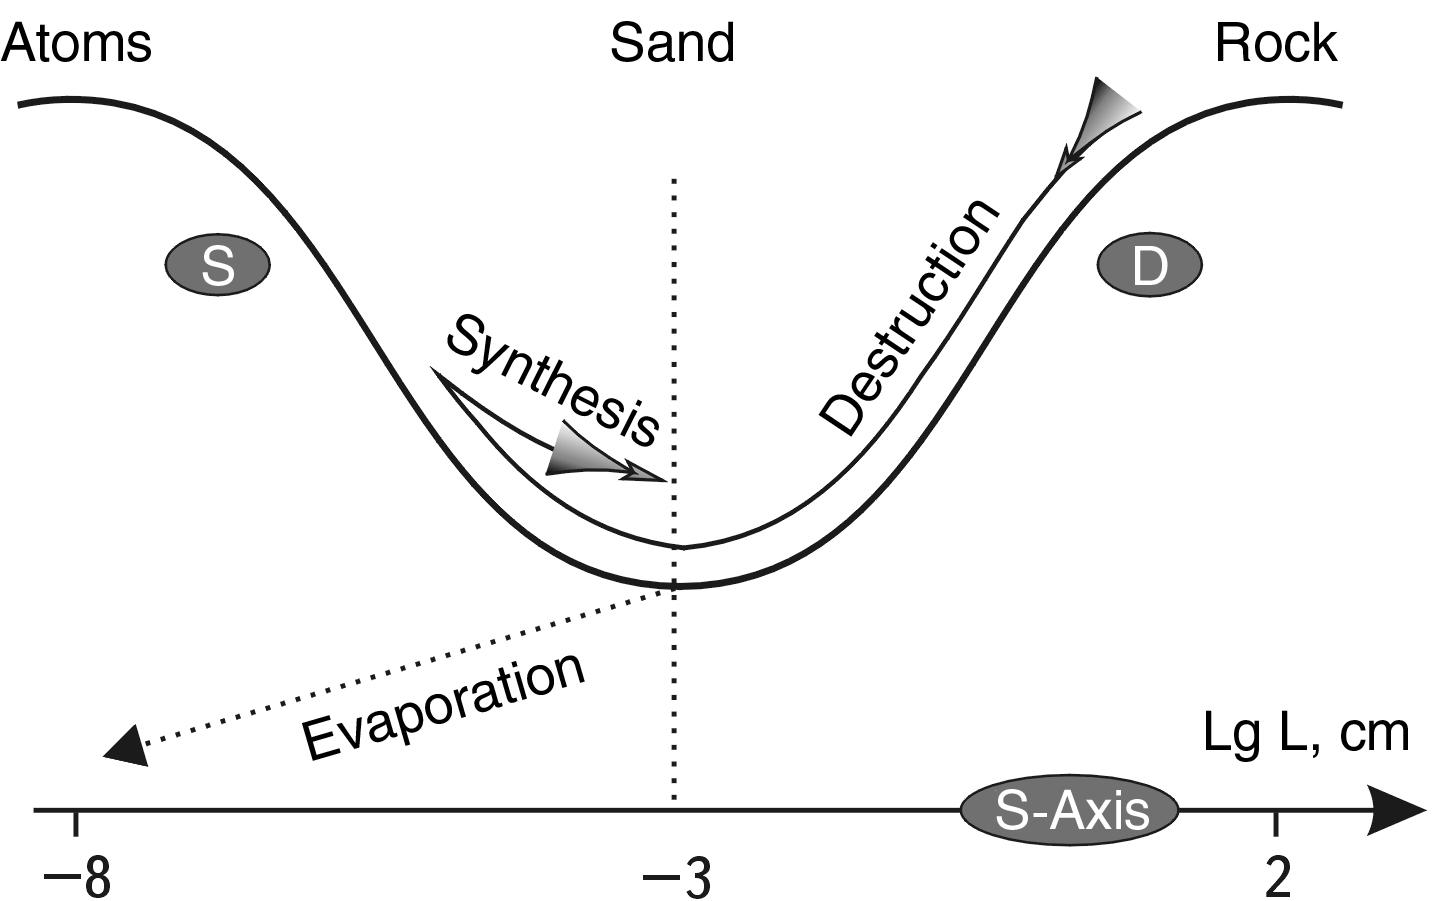 Fig. 2.16. The rock is destroyed under the influence of natural factors, gradually turning into stones, gravel, sand, dust. The dotted line shows its further hypothetical path - destruction down to atoms (evaporation), which does not occur due to the presence of a kink in the potential stability trough in the size region of about 10 µm. Dust particles that have reached the left slope of the trough begin a reverse movement in phase space, clumping together into sedimentary rocks
Thus, the entire geological history of the Earth gives us an example confirming the adequacy of the M-NAME MODEL #6 to the real processes occurring in Nature. So, it is clear that for both living and cosmic systems the potential M-NAME of stability No. 6 is a good model showing how the natural tendencies of synthesis and division processes differ on the S-axis. The left slope of natural synthesis of systems and the right slope of natural division of systems are clearly distinguished. The lower part of the S-Troughis the zone of transition from synthesis to division and the zone of greatest stability for all systems of this size range.
*S-Trough of Potential stability # 8 [2; 7; 12].
This S-Trough has the lower most stable part in the region of sizes \(10^{7}\)-\(10^{8}\) cm (100-1000 km). It is along these dimensions that BARRIER C-D should pass. The left slope starts at \(10^{2}\) cm, the right slope ends in the size region of \(10^{12}\) cm (see Fig. 1.7). Such dimensions are characteristic of space bodies of the Solar System, blocks of the Earth's crust, biocenoses and social systems.
As we enter the region of macroscales transitioning to megascales, we find ourselves in a less informed position than in the previous STS regions. The processes going on with objects of this size tend to be much more protracted, and therefore their analysis is less reliable. Many views of synthesis or division in a world of this size are speculative or theoretical, and there are often views in direct opposition as to whether synthesis or division results in any new systems. The energetics of the processes here are even more difficult to define. All of this leads the author to caution that the analysis of this and subsequent STSs are merely preliminary sketches, not even intended as definitive generalizations, let alone any statements.
SPACE SYSTEMS. There are still discussions and new theories about the formation of the solar system planets, asteroids and meteorites. In the most general form, they can be divided into theories of assembly (compression) and theories of fragmentation (fragmentation, separation). In this connection, let us consider how different theories gravitating toward synthesis or toward division relate in this area. Recall that we are primarily interested in the evolution of the formation of bodies from meteorites to the major planets of the solar system.
"...The hypothesis of the origin of planets and satellites as a result of gravitational collapse of a gas cloud is unacceptable. This forces us to turn to an alternative assumption, namely the gradual accretion of solid bodies (embryos or planetesimals) from dispersed matter (dust and gas). This process is often called planetesimal accretion; this qualitative concept dates back to the 18th century... According to this hypothesis, the growth of planets and satellites occurred as a result of the impact with their surface of a stream of embryos and grains until the bodies reached the presently observed size. A number of direct observations confirm this assumption. The crater-rich surfaces of the Moon, Mars, its satellites, and Mercury testify in favor of accretion by impact ... Direct observational evidence of aggregations of grains in outer space ... shows that many of the grains now constituting meteorites arose by condensation as individual particles ....
With the help of irradiation dose measurements, it can be shown that following the existence of isolated particles, groups of loosely (probably electrostatically) held grains existed for a long time. These groups, in turn, testify to alternating processes of fragmentation and accretion, which took place before the transition to the state of closer precursors of meteorites - bodies of several meters in size... "38
This quotation gives much information about the importance of distinguishing between the processes of synthesis (accretion) and division (fragmentation) in the evolutionary origin of planets and satellites.
The hypothesis of planetary accretion has a weak point. "As Safronov has shown... the time it takes for most grains to be captured in the vicinity of Neptune and Pluto is several times the age of the solar system. From this he concludes that Neptune, for example, captured only a small fraction of the matter concentrated in its surroundings. The remainder of the matter is assumed to continue to exist in a dispersed state. This is not very likely. "39 Unlikely because if it were, an asteroidal ring could be found around Neptune with a mass several times greater than the planet itself. Since this is not the case, the accretion hypothesis cannot explain everything in the processes of planet formation. Saving it, the famous scientists H. Alven and G. Arrhenius put forward the idea of jet streams, which accelerate the accretion process.
It is also possible to assume another, that the strongest catalyst of accretion was periodic ejections of planetary embryos from the Sun, about the possibility of which writes A. E. Khodkov40. Such "births" of planets from the interior of the Sun are quite allowed by the S-Trough of Potential stability model. The resetting of the shell or the ejection of the embryo in the form of a clot of matter could initiate the process of accretion, i.e., the growth of the embryo due to the accumulated around the Sun "nutritious" dust, asteroidal and planetesimal environment.
Although, as far as the author knows, this hypothesis has not been recognized among astrophysicists, it does not contradict the logic of the scheme of processes on the right slope of S-Trough # 8, where the Sun is located (\(10^{11}\) cm). By the way, exactly 10 orders of magnitude to the left (scale \(10^{1}\) see Fig. 2.7.), on the right slope of S-Trough # 6, the development of biosystems is realized due to the separation of the fetus from the mother's body, i.e. due to childbirth.
THE SCALE ANALOGY with animal births here is certainly very remote and conditional, but it proves to be fruitful for a principled choice between the processes of synthesis or division.
EARTH. Our planet, according to various estimates41 , absorbs up to \(10^{9}\) tons of cosmic matter per year, so over 5 billion years it could have increased its mass by a decent amount - up to \(10^{18}\) tons. Typically, falling particles are angstrom to micron in size, although larger bodies are also found. Consequently, the Earth absorbs particles and objects of different sizes and chemical composition on its surface. Although their mass does not exceed, according to some estimates, a few percent of the mass of the Earth's crust, from our point of view, their role in the formation of the biosphere is enormous42.
"Currently, most scientists believe that the Sun and planets formed simultaneously from the same cold gas-dust cloud... At first, there was a cold gas-dust nebula similar to the ones astronomers observe today. This nebula was 99% gas, mostly hydrogen, and 1% consolidated matter (by mass). The size of individual consolidated bodies should be small (up to 100 km in diameter, otherwise the nebula would not be stable) "43. Obviously, the gas went to create mainly the Sun, and consolidated bodies gave rise to the planets.
It should be noted that in this theory the size limit for the primary cosmic bodies that could participate in the synthesis of planets is 100 km, which is fully consistent with our hypothesis about the presence of the synthesis-division BARRIER in this size region. Therefore, it is very important to note that not only at the first stage of the Earth's formation the size limit for the bodies participating in the synthesis was the threshold of 100 (and, perhaps, a little more) kilometers, but it is well known44 that even during the entire subsequent history of the Earth a cosmic body with dimensions exceeding 100 km never fell on its surface. Thus, the vast majority of bodies involved in the synthesis of planets did not exceed about 100 km in size. This threshold is preserved later, - in the matter absorbed by the planets do not participate bodies whose size exceeds 100 km. Any collisions with bodies larger than a hundred kilometers in diameter do not lead to evolutionary synthesis, but lead either to the destruction of the planet as a whole (hypothetical Phaethon), or to the impact ejection of a body of similar size from it (hypothesis of the terrestrial origin of the Moon).
Consequently, the conjunction of a planet with a body larger than 100 km leads not to synthesis but to division. This puts an essential dimensional threshold for the accretion process, which is located along the S-axis exactly 10 orders of magnitude to the right of the analogous threshold from the world of biosystems and 20 orders of magnitude to the right of the analogous threshold from the world of nuclear physics.
Let us apply in this case the same S-D THRESHOLD MODEL, but already for S-Trough of Potential stability # 8. In this case we can predict at least two barriers: one with a coordinate of 1.6 \(\cdot 10^{7}\) cm (160 km), the other with a coordinate of ~5 \(\cdot 10^{7}\) cm (500 km). In this case, by analogy with S- Troughs #4 and #6, the entire right slope of S-Trough CLASS #8 is filled with systems for which a division or separation process is quite likely. But all planets exist on this slope! Hence, their stability is very relative. True, it's not all bad.
Analogies with previous S-Troughs show that objects whose sizes exceed the division threshold by no more than an order of magnitude are mostly actively divisioning, hence, small planets (smaller than the Moon) are most likely to be subject to destruction. For Jupiter-sized objects, the process of satellite separation (birth) is more likely45. The Earth, which is two orders of magnitude to the right of the synthesis-division barrier, is most likely not capable of fragmentation like Phaethon (judging by the total mass of the asteroid belt, this hypothetical planet was very small). Although, in principle, the Earth could separate (bud off) some bodies from itself. In this regard, it is possible that hypotheses about the origin of the Moon as a separated body from the Earth are not so fantastic.
So, we see that most of the astronomical information and theories available today do not contradict the S-Trough of Potential stability #8 model.
First, almost everywhere we find confirmation that the formation and growth of planets are realized by the synthesis of bodies whose sizes do not exceed THRESHOLD S-D ~160 km.
Secondly, the S-Trough of Potential stability model does not impose a ban on the process of "birth" of planets due to separation of fragments of matter from the Sun (or satellites of planets due to separation of their parts from the planets themselves). It is true that hypotheses about the Sun's "birth" of planets and satellites are much more weakly developed and are practically not recognized by official cosmology. The reason is simple. Gravity, the force that gathers matter, gives way to theories related to the SYNTHESIS of matter, its consolidation. Fragmentation, separation, budding, ejections, "births" and similar processes of FACTION go against the gravitational tendency, that is why they are accepted by the scientific community much more difficult than the processes connected with synthesis. The proposed S-Trough model with two slopes provides a new support for hypotheses based on the division process. It is true that the model itself has no physical explanation yet, but we will try to solve this problem in the future. For the time being we only rely on the laws of scale similarity, which surprisingly do not contradict the enormous amount of factual material accumulated by science in various fields of knowledge.
SOCIAL SYSTEMS. Let us continue analyzing the trends of C-D on the information base of living systems. Let us start with social systems, but before that we will mention one very original work, which was published quite recently. Its author V. A. Vasiliev46 managed to reveal a very interesting regularity in the history of human cultures. Large societies periodically (after 400 years) change the direction of their development: from integration to disintegration.
This phenomenon can be called a kind of MASS PULSATION OF SOCIETIES, which V.A. Vasiliev connects with cosmic rhythms, which are also manifested in solar activity. The discovery of this regularity shows how important is the systemic study of the processes going on in the social space, first of all, the processes of growth, fragmentation, synthesis and other similar processes that lead to the movement of the social system along the S-axis. In this case, a social system can cross some very complex dimensional zones in which the general tendency of systems development in the MASSIVE FIELD changes dramatically, as has been shown in other examples.
Starting from the simplest unit of society (family) and further on, we will move down the left slope of S-Trough # 8 to the right (Fig. 2.17), to a more stable position. According to the general HYPOTHESIS, EVOLUTION THROUGH SYNTHESIS dominates here.
FAMILY - "the primary unit of society" formed as a result of voluntary joining of two independent subjects of society into a new integrity.
In its most natural form, in rural conditions, a family occupies a territory with dimensions ranging from a few tens of meters to a few hundred meters. Approximately such an area can be cultivated by one independent family (outside the specialization of post-industrial society) and is capable of feeding it.
Families with all their ramifications from a common ancestor form genera or families. These are already kilometer scales. At first glance, here, in genera, in families, we meet the opposite principle of creating systems: branching off (i.e. division) from the common root of more and more new branches.
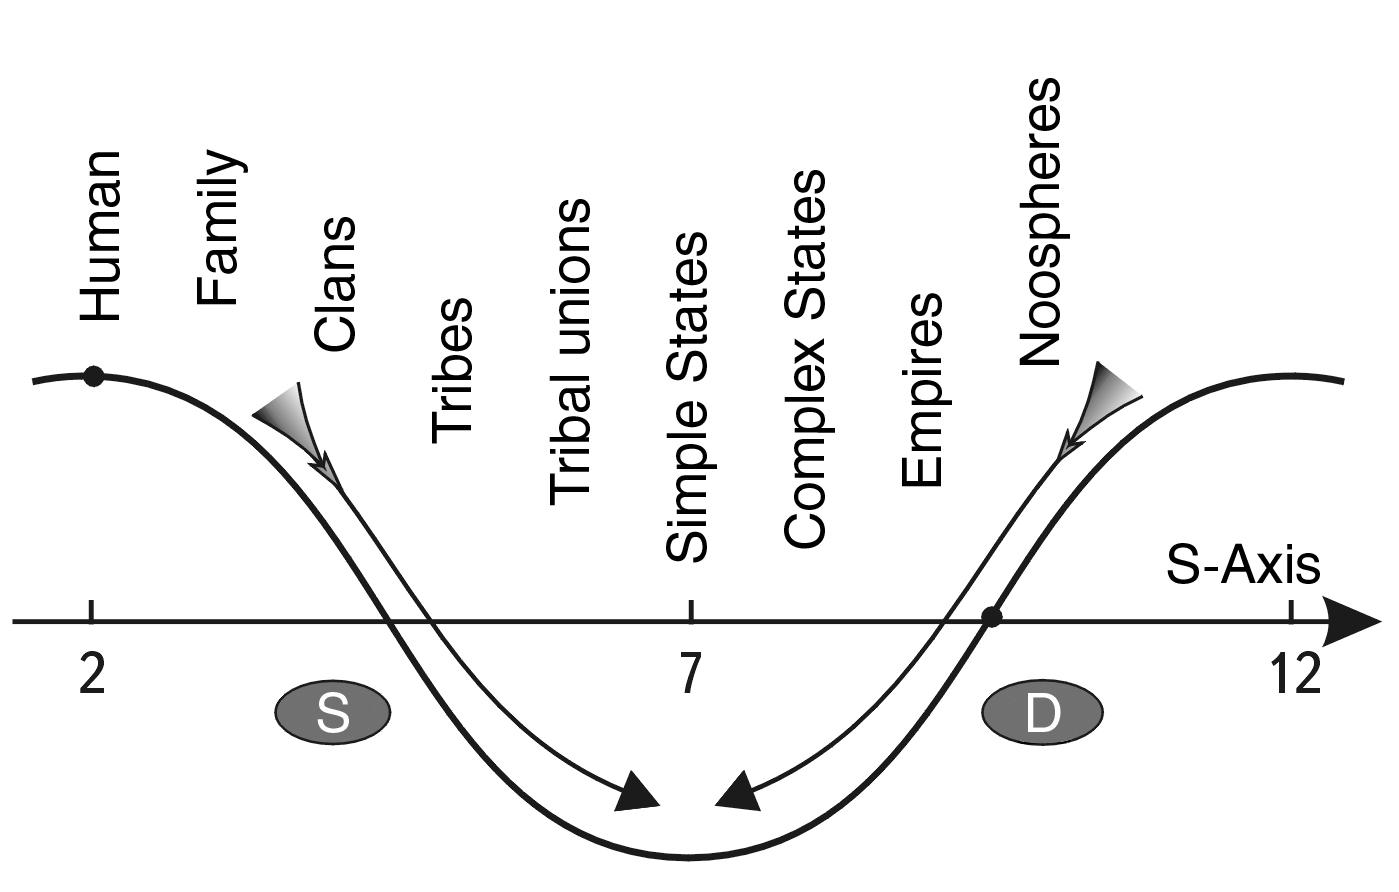 Fig. 2.17. Location of social systems on the S-Trough of Potential stability. It can be seen that the most stable position is occupied by simple states, the size of which is in the range of 100-200 km. All smaller societies naturally gravitate towards unification into such structures. Complex states, empires and Noosphere are on the right slope, which is characterized by a constant tendency to fragmentation, disintegration. Therefore, their maintenance requires a more powerful state management apparatus, which most often acquires all the signs of a totalitarian gendarme type
However, it should not be forgotten that in its pure form this process leads to degeneration of a clan or family, which needs fresh blood to prevent the appearance of genetic defects. Since the path of simple "budding" leads to the degradation of the population, young couples in clan and tribal societies were always created under the control of senior representatives of different clans or families. In the case of their union in marriage, they speak of twinning (joining) of families or clans. Such twinning is a kind of synthesis of different clans into some unified community of a higher level, which leads to the creation of tribes and peoples. How tragic such synthesis (or obstacles to it) can be, is well known from Shakespeare's famous tragedy "Romeo and Juliet." Thus, families and clans can behave as SELF-CONTINUED SECTORS, solving at their own scale level the problem of joining or not joining together.
SETTLEMENTS. As a rule, settlements are kilometers or even tens of kilometers of controlled territory. They are formed again by synthesis. One family or clan moves to a new place. Then other families and individuals flock to this place from the surrounding area. The settlement grows by "absorbing" smaller social units and grows to the size of a city through this synthesizing process.
The author does not know of any cities whose size would exceed a hundred, let alone a thousand kilometers. In Russia, the longest city is Volgograd, it is about 70 kilometers long.
PRIMARY (SIMPLE) STATES. As historical analysis shows, they were created due to the arrival of tribes from the surrounding lands to a new territory. There was a concentration of settlements on a limited territory.
Most likely, those historians who connect such "pressing" of tribes with ecological conditions that have changed for the worse are right. This forced them to strive for more fertile lands and to shift from the usual cattle breeding and hunting to agriculture, which was unusual at first. This is probably how all river states were formed, starting from Ancient Egypt.
The process of such synthesis went on long enough and naturally, without efforts on the part of the primary states themselves. In the future, the formed new states continued to play the role of absorber of the surrounding tribes, which, rolling up from the "wild" space, were absorbed by the states, assimilated by them and processed into a NEW SOCIETY - the People.
This was the case in ancient Egypt: "Starving tribes from various places, including the Jews, poured into the fertile Nile Delta in search of food. History records that the Egyptians welcomed them with kindness "47.
The expansion through synthesis of tribes and many other primary states proceeded similarly. As a rule, their average size did not exceed several hundred kilometers.
However, the process of absorption of wild tribes was not always painless. For example, the history of ancient Egypt preserves evidence of the "terrible invasion" of the Hyksos, who were partly expelled and partly assimilated.
Then the primary states, growing to a certain size, began to face a new and unusual problem - the tendency to fragmentation into separate structures. For the first time in the history of mankind this problem had to be solved, apparently, by the pharaohs of ancient Egypt, for whom the growing independence of the nomes led to the need for constant strengthening of administrative power. Subsequently, all primary states, including Russia, faced the centrifugal tendency.
It is very important for us to note that the centrifugal forces of regional separatism are a sign of the transition of the SYNTHESIS-DIVISION BARRIER by the growing social systems in the course of evolution, the first boundary of which is 160 km in size (the exact values of these barriers were determined in Section 1.5.6). This is not to say that the separation of social structures from each other does not occur on smaller scales, it is just that we are primarily investigating positive trends that lead to the evolution of social systems.
The growth in the size of social systems throughout human history is an objective fact. From the point of view of the large-scale approach, this process can be described as a gradual "settlement" of higher and higher scale levels of organization. Therefore, if in the history of mankind there have been any disintegration of families and tribes into many independent and autonomous entities, we believe that these processes were exclusively destructive.
According to our HYPOTHESIS, having crossed the BARRIER C-D (160 or 500 km), mankind for the first time faced the phenomenon when further growth of societies at the expense of JUST SYNTHESIS turns out to be "energetically unprofitable", and FRAGMENTATION of a large society into smaller structures can be a positive process from the evolutionary point of view. Let us analyze this problem in more detail.
The primary states, which were relatively small social systems with sizes close to 160-500 km, are, according to the model, in the zone of increased stability, in the lower point of S-Trough # 8. Once emerged, they should exist within their dimensional boundaries for quite a long time. If they appear to be to the right of the 500 km barrier in their dimensions, the tendencies to fragmentation are not so great as to destroy them completely. History has preserved for us several examples of such "oscillations" of social systems near the center of equilibrium, when primary states break up into separate regions and then reunite again (Fig. 2.18). For example, at the beginning of the 3rd millennium B.C., Upper and Lower Egypt were united, after which the whole country was divided into 42 nomes. After 2325 BC. "under conditions of subsistence economy and increasing decentralization Egypt lost the established system of government and turned into a fragmented state ....
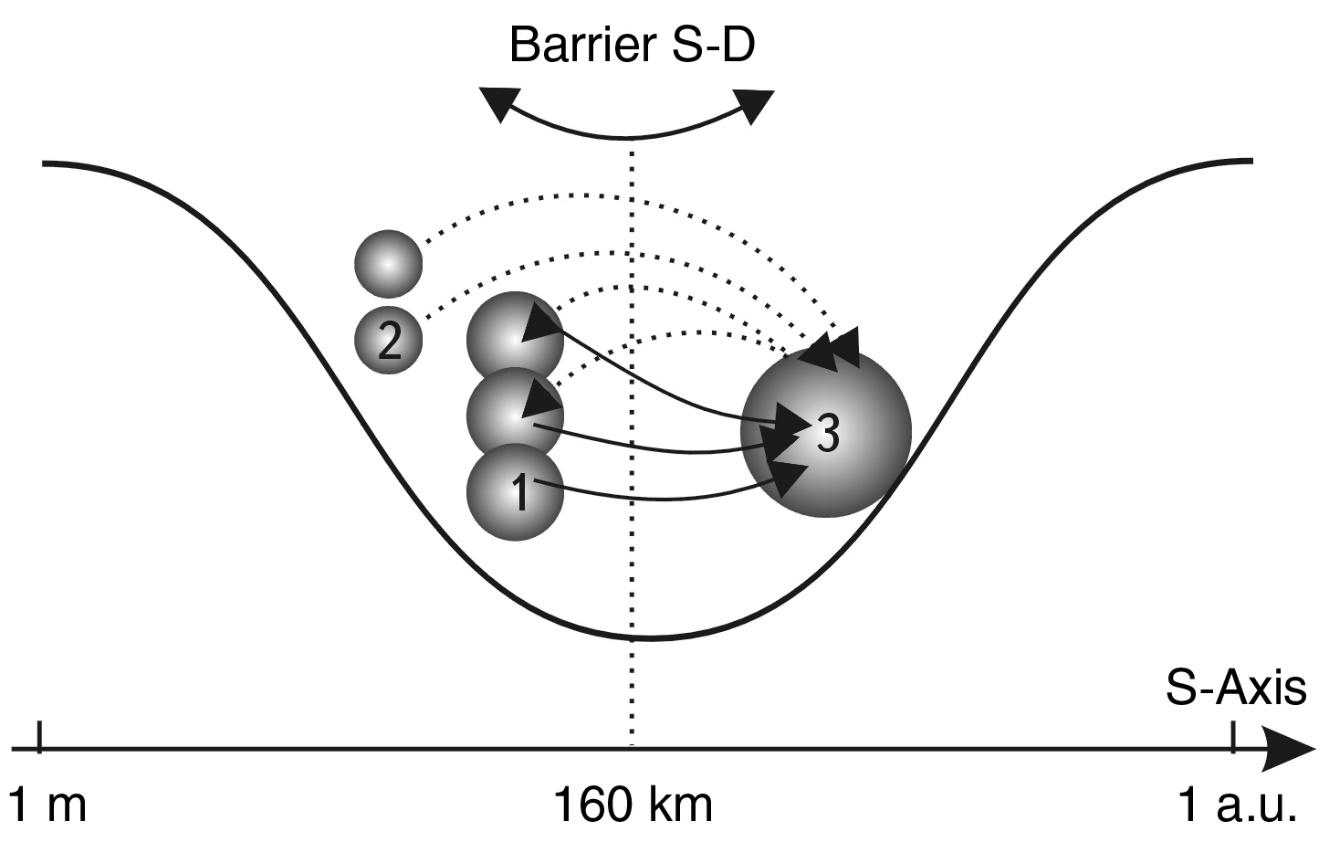 Fig. 2.18. The phase space of scale stability is such that simple states (1) and tribal alliances (2) tend to form complex states (3), which after some time disintegrate into simple states
Finally the nomarch from Heracleopolis took possession of Memphis and declared the independence of Lower Egypt. The kingdom broke up... About 2040 BC Pharaoh Mentuhotep I... managed to conquer the Northern Kingdom (Heracleopolis) and unite Upper and Lower Egypt. This is how the Middle Kingdom came into being "48.
For Russians, another example is most illustrative. First, the emergence of the Kievan state. Then - infighting and its disintegration into three independent regions: Kiev, Novgorod and Moscow. Subsequently, Russia united again, but this process is still remembered by the rivers of blood spilled by Ivan the Terrible in Novgorod and a mass of other examples of violence during the creation of the giant Russian Empire.
We PROPOSE that as soon as a state outgrows a critical size (about 500 km), it loses the ability for natural synthesis and can grow similarly to large atomic nuclei only explosively.
EMPIRES AND NATION-STATES. After the primary states have exhausted the resource of growth by absorbing the tribal environment around them, they begin plundering and destructive campaigns against each other.
This abrupt transition from natural growth to the violent seizure of neighboring territories, from our point of view, is connected with the TRANSITION FROM THE ZONE OF EVOLUTION OF SOCIETIES FOR SYNTHESIS TO THE ZONE OF EVOLUTION FOR GROWTH WITH FOLLOWING DEFINITION.
The principle of scale similarity allows us to compare the process of empire formation with the process of growth of large atomic nuclei or with the formation of cell colonies. The point is that the growth of empires, the formation of large atomic nuclei and cell colonies take place in similar zones corresponding to the S-TROUGHS (#8, #6 and #4), namely, in the first part of the right slope (up to the intersection of the STS with the S-axis). Take, for example, the process of formation of colonies of cells or protozoan multicellulars. This process proceeds due to the growth of cells and... their subsequent division, but without divergence to the sides.
So, natural synthesis is no longer possible for states, the creation of larger systems is accompanied by "rolling" of the system up the right slope, the steepness of which requires much more energy than at the previous stages of growth. Using the principle of scale similarity, we can compare this process to the synthesis of the largest atomic nuclei, which occurs not in the calm process of nucleosynthesis of stars, but in the explosive process of supernovae. Apparently, the synthesis of empires is also possible only as a result of an explosive invasion process. The most vivid example is the empire of Alexander the Great, who in less than 10 years captured a huge territory. However, as superheavy atoms become unstable and undergo disintegration, so do empires. Alexander the Great's empire disintegrated immediately after his death. It was perhaps the shortest-lived empire. In much the same way, explosively, Genghis Khan's empire and many other colonial and world empires were formed. And all of them eventually collapsed into fragments. An approximate systematic scheme of the process of empire formation is shown in Fig. 2.19.
As shown in the work49, one should fundamentally distinguish between empires of several types, so the scheme of their formation and disintegration is also somewhat different. Thus, for example, in the past, the Russian Empire is an empire of the national type, the British Empire is a colonial empire, and the Roman Empire is a world type. Thus each large civilization passes successively through THREE PHASES OF DEVELOPMENT OF EMPIRES: national - colonial - world, which last approximately 500 years. The common thing is that empires are created forever, and exist for no more than a few centuries (the age limit is 500 years). And the fact that they are created not in the process of voluntary accession of peoples (as, for example, primary states), but usually as a result of bloody and brutal seizures with the use of a rigid centralized apparatus of suppression.
Even the Russian Empire (despite the fact that many nations joined it voluntarily), starting with the capture of Kazan and Novgorod, very often expanded its borders through military expansion.
Empires, as a rule, have a rigid centralized power and are kept mainly on it. If the centralized power weakens for any reason, the empire quickly collapses, causing shock to all its inhabitants. The latest example is the collapse of the USSR empire, which we are still painfully experiencing as a social catastrophe.
Is the role of empires in human history positive or negative? Since these questions, as a rule, are studied by intellectuals, they mostly give negative assessments to empires. Hence, for example, such common clichés as "evil empire". Why, as a rule, intellectuals do not like empires? The main reason is that empires, because of their unwieldy nature, are conservative, often suppress personal initiative and relegate the individual to the role of a cog in the system. Empires cannot exist without a rigid centralized power, from which one step to totalitarianism, they are formed through the capture of peoples and hold on by suppressing attempts to leave them.
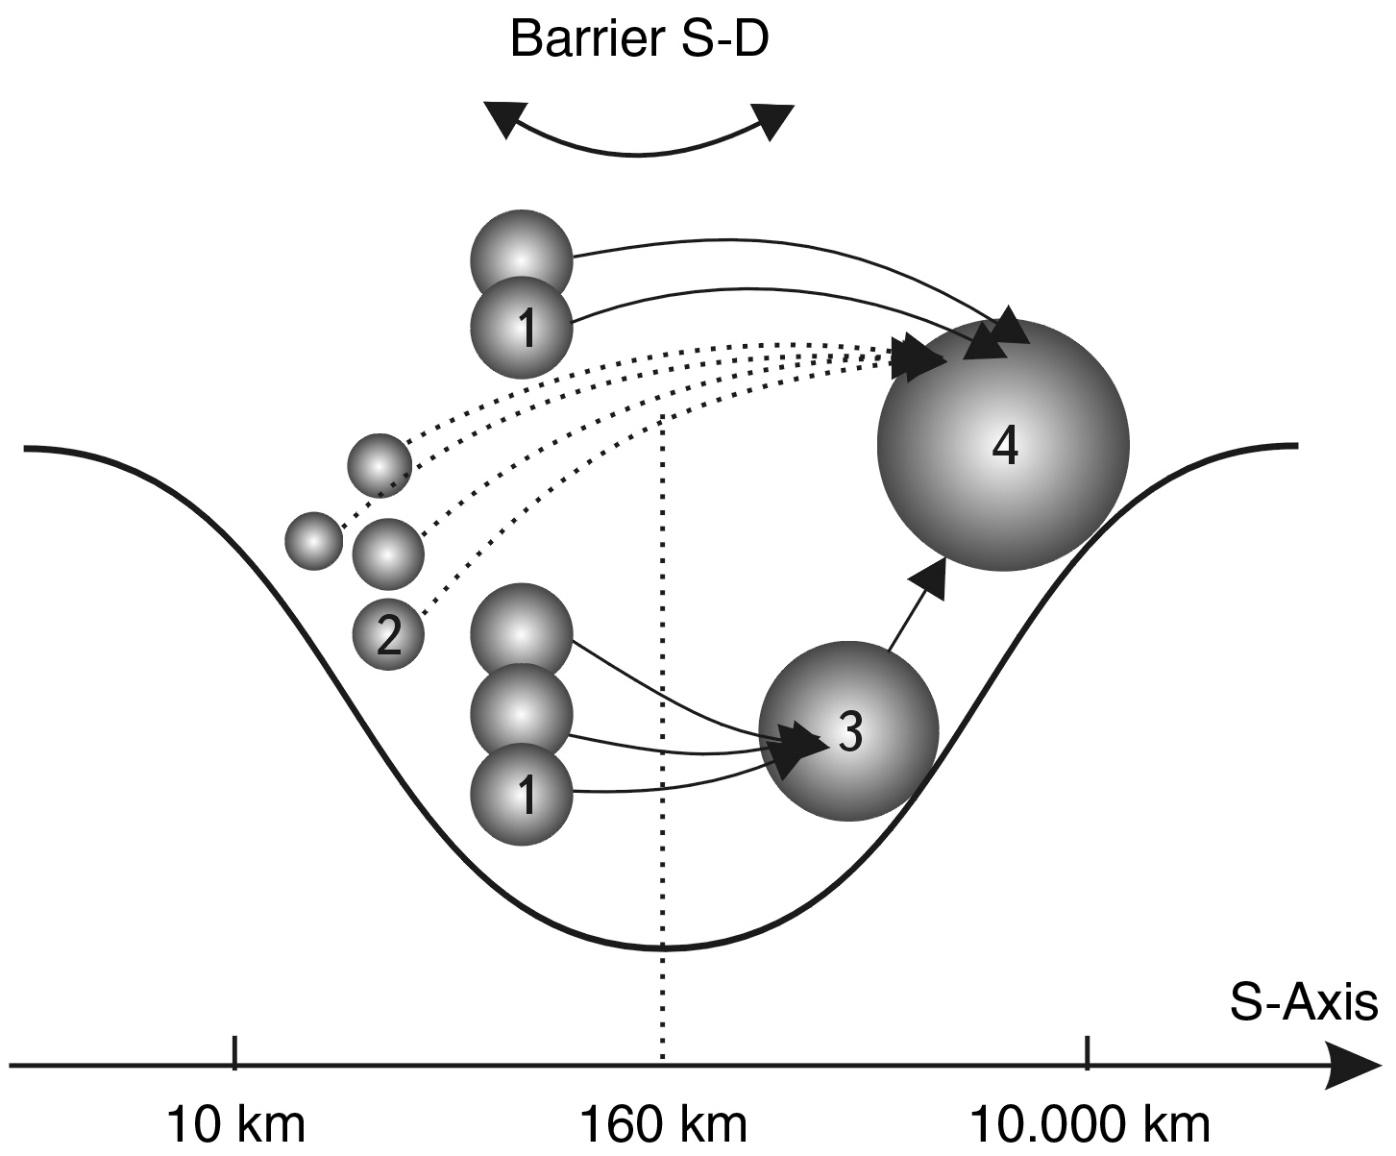
Fig. 2.19. S-dynamic scheme of empire formation (4) from complex states (3), simple states (1) and tribes (2)
All this is very contrary to the freedom-loving and individualistic nature of the intellectual. The author is no exception. However, objectivity is higher than personal biases. A systemic view of the role of empires shows that at a certain stage they become an extremely necessary socio-political phenomenon. They carry a lot of positive aspects. At least three factors justify the existence of empires.
First, they spread the most advanced way of life to the peripheral territories, transferring the best achievements of the "core" of the empire to the rest of the nations.
Secondly, they create one more level in the large-scale hierarchy of social systems. As will be shown below, the expansion of society in a large-scale direction is almost the main task of human civilization. This is the way to reach the Noosphere.
Thirdly, after the collapse of empires, societies more developed than those that entered it before its inception remain. They become new stable states with moderate size (average size 500-600 km). Therefore, we can say that empires are "BIRTHROOMS" for nations.
Peoples enter empires as tribes and nationalities, and leave them after the collapse of empires as independent nation-states. For example, after the collapse of the USSR, Kazakhstan, Kyrgyzstan and Azerbaijan were formed as new national states, which had not existed before these peoples joined the Russian Empire. Similarly, in its time, in the depths of the Mongol Empire, the Russian nation matured. L. Gumilev, I think, said that Muscovites, Tverites, Ryazans, etc. came to the Kulikovo field, and Russians left it.
Thus, empires never collapse into primary tribal structures, which testifies to their positive-evolutionary "recycling" function. If any part of the empire has not matured to the possibility of creating a full-fledged nation-state and is in the phase of tribal development (with tribal and clan enmity inside), it is not able to break away from the core of the empire and separate into a new state, and is forced to remain inside this core. Examples of successful separation of peoples from empires into independent states excite attempts of clan societies to make a jump through natural phases of development. Apparently, this leads to the emergence of such "eternally separated" from former empires territories as Ireland, Abkhazia, Chechnya and others. The separation of such small territories with not yet formed foundations of a nation-state is unnatural in the logic of the S-Troughmodel #8, that is why it does not happen until the end.
So, by applying the principle of scale similarity, it is possible to take a new look at the actual PROBLEMS OF BUILDING SOCIAL SYSTEMS with the help of well-known regularities in the field of nuclear physics and cytology.
These regularities cannot be neglected in the construction of the NOOSPHERE. It turns out that the creation of a world state, the scale of which exceeds by several orders of magnitude the stable zone of S-Trough of Potential stability, is a very difficult and extraordinary task. The experience that mankind has gained in building previous levels of social hierarchy may not work here.
According to the logic of the S-Trough of Potential stability model, the noosphere will constantly strive for fragmentation into smaller parts. The principles of democratic governance, which have proved themselves perfectly well on smaller scales (on the left slope of S-Trough #8), will not work here. Consequently, the transition to this new scale zone for mankind requires a fundamentally new approach to social problems and structures.
BIOCENOSIS. In living nature there are examples of synthesis of animals, birds and fish - into herds, flocks and families. But the formation of the first biocenosis (systems with larger sizes than hundreds of meters) occurred mainly in such old times that it is difficult to determine the dynamics of these processes, i.e. to decide whether they are similar to social ones or not. After all, biocenosis can be formed both as a result of individuals coming from different places and as a result of primary pairs ("adams and eves" of each species) breeding in one territory. In the latter case, it is more like a process of division than synthesis. In this connection, we should carefully analyze modern cases of mass migration of living beings over the surface of the planet and try to understand whether they are the division of flocks and herds into two independent biocenoses or assembly and compaction with subsequent relocation to a new territory.
An example of obvious "reproduction" of communities by division gives us a bee swarm, which is separated from the hive as an independent family. As a rule, the hive size does not go beyond the meter limits, i.e., as already mentioned, it belongs to the right edge of S-Trough #6, and this is already a division zone.
It would be another matter if it were possible to establish that in the life of birds, or fish, or animals, flocks and herds split into two parts and form new stable flocks and herds. As far as the author knows, such "swarming" is practically not observed in the area of sizes larger than 10 meters.
By the way, the author is not aware of similar cases of formation of new settlements or towns by separation of human "swarms" from old settlements or towns.
Migration, as a rule, is a problem of individuals, not of large societies. Of course, this problem should not be confused with the PROBLEM OF RELOCATION OF PEOPLE, when the whole SOCIETY rises from one place and moves to another.
However, it can be assumed that there are exceptions to this rule, so the author would be extremely grateful to specialists in the relevant fields who would point out to him cases of "multiplication" of societies through fragmentation and separation.
S-TROUGHS #10 [12; 17; 22]
According to the SW model, it is located in the size range from \(10^{12}\) to \(10^{22}\) cm, i.e., from the average size of stars to the average size of galaxies. In the center - the sizes \(10^{17}\)- \(10^{18}\) cm, this is the scale of the average distance between stars in the Galaxy, the scale of the nuclei of galaxies and quasars. This is where BARRIER S-D should take place. Due to the lack of reliable factual information about the dynamical and evolutionary processes occurring at such scales, we will limit ourselves to a cursory excursion into this area.
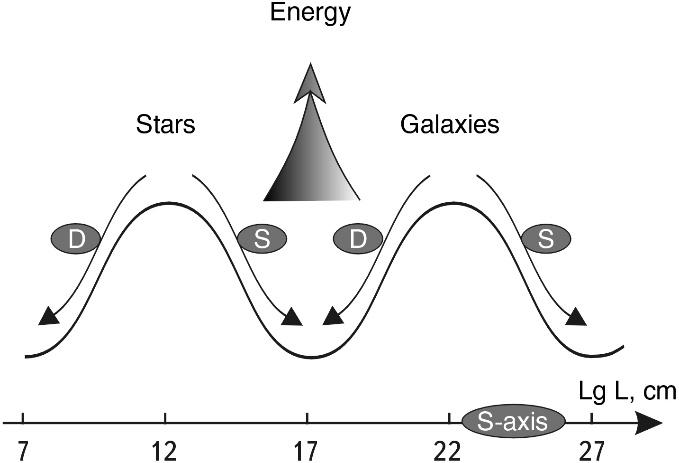
Fig. 2.20. Potential surface of scale stability for stars and galaxies. The scheme shows that stars can join into pairs, groups. Associations and clusters of stars, whose sizes are about \(10^{19}\) cm, belong to the right slope, and their history should be different from that of pairs and groups. It also follows from the scheme that the nuclei of galaxies are in a position similar to cells. Therefore, they can divide with the release of energy. Other galaxies can bud off from galaxies, they can "give birth" to new galaxies. However, two small galaxies can never merge into one large galaxy, creating a new complete galaxy. Although galaxies can gather in pairs, groups, etc., but already on the left slope of the next S-Trough of Potential stability (STPS) #12.
According to the proposed principle of scale similarity, all systems from \(10^{12}\) to \(10^{17}\) cm can evolve, creating new systems by assembly (synthesis). This applies first of all to stars, their pairs and multiple systems, since on the left slope of STPS #10 (see Fig. 2.20) we cannot point to any other systems as common as stars.
On the contrary, on the right slope of this , according to the model, all systems should evolve by division, detachment, fragmentation, separation, etc. The whole right slope of STPS is populated by galaxy nuclei, star clusters, galaxies themselves.
Let's see what data modern astrophysics has about the processes going on in this range of scales.
LEFT SLOPE (\(10^{12}\)- \(10^{17}\) cm). Stars are known to form not only pairs and small multiple systems, but also to be combined into clusters. Theoretically, these stellar megasystems can be formed by two quite opposite processes.
In the first variant they are formed from free stars of the galactic field, as a result of gravitational capture and crowding - this is the SYNTHESIS variant. We BELIEVE that mainly pairs and groups of stars arise in this way. Their ages may be different.
According to the second scenario, star systems can be formed as a result of fragmentation of gas-dust complexes - this is the division variant. We see that in the second scenario, the problem of star formation is solved "in parallel". Obviously, the age of stars in this case should be the same. Apparently, all large star clusters, starting from associations and ending with scattered clusters, arise in this way.
"Empirical evidence of the process of star formation from clouds of the interstellar medium is that... massive hot stars of high luminosity... are not uniformly distributed in the Galaxy, but are grouped into separate extensive clusters; such groupings of stars were called "associations "50. It turned out that stars from these associations diverge. I.S. Shklovsky called such associations "maternity homes" for stars.
RIGHT SLOPE (\(10^{17}\)- \(10^{22}\) cm). As noted above, it is on this slope that, according to most astrophysicists, the process of fragmentation of gas-dust complexes, leading to the formation of new stars, takes place. On the same slope, in its upper part, galaxies "live."
The distances between galaxies are very large, besides, according to the redshift data within the Big Bang theory, all galaxies are scattering away from each other. For this reason, it is difficult to assume that galaxies of any size can join together in any close systems. In other words, on the right slope, it is impossible to imagine the merger of two galaxies into one more complex system, it is impossible to suppose that two small galaxies synthesize one larger galaxy. Even more improbable is the process of merging the nuclei of galaxies, which, given their relatively minuscule sizes, even if the galaxies passed through each other, would hardly be able to come close to each other.
So, the average distance between galaxies is 100 times their size, the nuclei of galaxies are 10-100 thousand times smaller than the galaxies themselves. Galaxies are scattering away from each other. All these factors practically exclude any variant of EVOLUTION of galaxies or their nuclei THROUGH SYNTHESIS ON THE RIGHT SIDE OF STSP #10.
Once again, it is worth repeating that the SW model does not forbid galaxies to collide at all. Just as two people can collide in the street, two galaxies can (probably) collide in the cosmos. The S-Trough of Potential stability model states only that the collision of two galaxies does not lead to the emergence of a more complex system in the evolutionary sense.
The probability of the process of FISSING as a factor of EVOLUTION on the RIGHT slope is much higher.
First, it is the activity of galactic nuclei, which sometimes leads to explosions of gigantic force51. An explosion of this kind is evidence of the separation and subsequent dispersal of galaxy nuclei (e.g., Seyfert galaxies). There is a certain fraction of galaxies with very elevated emission in the central region.
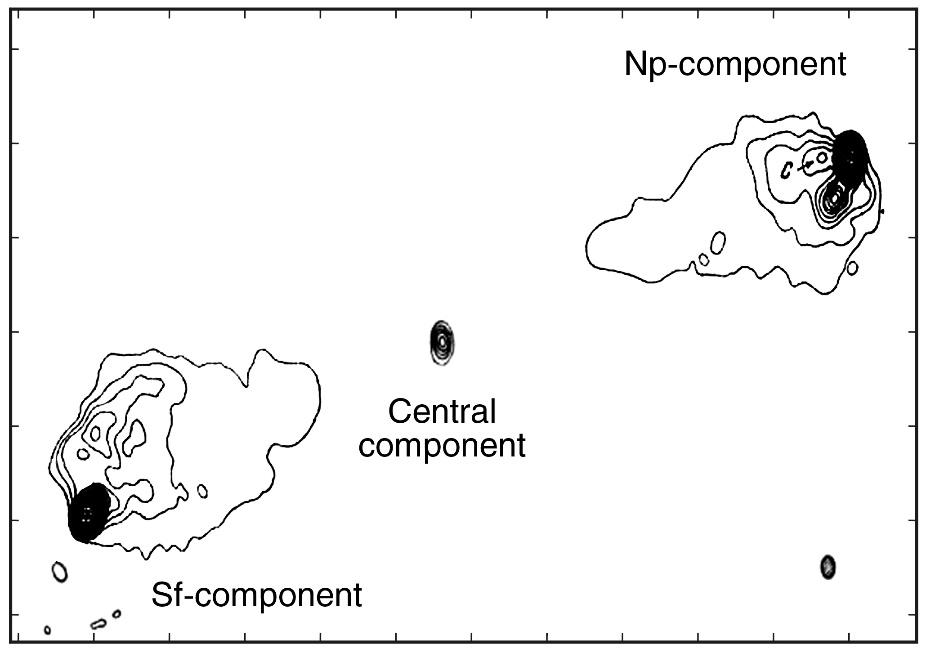 Fig. 2.21. The Swan-A galaxy, which split into two fragments after the explosion. The energy of the explosion in its core was so colossal that it cannot be explained by processes known to science
"Radio emission is most often detected in galaxies with split nuclei... interpreted by G. M. Tovmasyan as nuclei in the process of active division "52.
To such fissile nuclei astronomers after a long debate53 have attributed the Swan-A galaxies (Fig. 2.21), NGC 5128 and 1275.
The fact of galaxy nuclei division is a striking confirmation of the presence of the MS-invariant, because it occurs on the S-axis exactly 20 orders of magnitude to the right of cell nuclei division. This phenomenon is most clearly manifested in quasars, whose nuclei, according to most astronomers, serve as sources of continuous ejection and fragmentation of matter54.
Observations of galactic nuclei and their increased energy release led the famous Soviet astronomer V. A. Ambartsumian to propose a hypothesis55 about the existence of some mysterious D-bodies, a supermassive state of matter, the fragmentation of which leads to unusually high energy activity of galactic nuclei and ejections of matter from them.
In addition, many photographs of active galactic nuclei and emissions from them testify in favor of the assumption that galactic nuclei can divide56 and fragment, ejecting some matter outside the inner region and even outside the galaxy itself.
This leads to the idea that in the lower region of the right slope of the S-trough an active process of formation of new systems by division and fragmentation is quite possible.
Using the analogy with the right slope for S-TroughNo. 6, where new objects are born in biosystems, we can put forward a preliminary HYPOTHESIS that new galaxies can appear only as a result of their "birth" by other galaxies. Perhaps, the close groups of galaxies discovered by B. A. Vorontsov-Velyaminov 57 (and figuratively called "nests" by him) are just the actual nests for newly born galaxies.
S-Trough of POTENTIAL STABILITY #12 [22; 27; 28]
It is essentially a "half- TROUGH" because it consists of a single left slope that starts at size \(10^{22}\) cm and ends in the size region \(10^{27}\)- \(10^{28}\) cm. This entire slope is populated by pairs, groups, clusters and superclusters of galaxies. There are many theories about galaxy interactions that allow for their synthesis58. However, this synthesis does not lead to the formation of new galaxies, it leads to the formation of pairs and other groups of galaxies whose sizes (\(10^{22}\) cm) always exceed the size of the upper crest of the STPS (see Fig. 2.20).
It is not obvious, but it is quite admissible that all galaxy clusters and superclusters were formed as a result of merging independent galaxies into new megasystems. But the question about the dominance of synthesis over division on this slope of the S-Trough is still open.
TOTALS. Thus, we have considered four and a half S-Troughs on the WAVE of stability. The problem of large-scale binding of the dominant processes of synthesis or division is considered, most likely, for the first time in science.
Since the author cannot rely on his predecessors in this matter, this problem cannot be investigated with such precision and completeness to make final conclusions. However, many facts and indirect data, including those left behind the text, allow the author to make a PROPOSITION that there is a universal natural principle of change of synthesis-separation tendencies with a periodicity of \(10^{5}\). Accordingly, every 10 orders of magnitude, nature returns to one of the modes of evolution again.
This periodicity correlates in a remarkable way with the global scale classification of all objects of the Universe, discussed in the previous part.
And if the revealed regularity will be confirmed by subsequent more detailed researches, new fantastic horizons in methodology of research of the most important processes in the Universe will open before us.
Nuclear physics, biology, and astrophysics can be mutually enriched by using the MASSAGE SUBMISSION METHOD.
It seems incredible, but astrophysicists, in order to better understand the processes going on in the nuclei of galaxies, may be studying the biological features of cell division.
We see that the refined principle of scale similarity of HERMES TRISMEGIST is eS-Trough of POTENTIAL STABILITY #12 [22; 27; 28]nriched with new unexpected facets.
Completing the identification of the peculiarities of the scale zones of synthesis and division on the S-axis, we can take a new look at the scale interval of the Universe as a whole.
-
Mukhin K. N. Physics of the Atomic Nucleus // Experimental Nuclear Physics, Vol. 1. Moscow: Atomizdat, 1974. p. 50. ↩
-
Chechev V. R., Kramarovsky Ya. M. Radioactivity and the Evolution of the Universe. Moscow: Nauka, 1978. ↩
-
Ibid. p. 40. ↩
-
Ibid. p. 44. ↩
-
Islam J. N. Sky and Telescope, 1979, 57, I, pp. 13–18. ↩
-
Animal Life, Vol. 1. Moscow: Prosveshchenie, 1968. p. 71. ↩
-
Ibid. p. 139. ↩
-
Green N., Stout U., Taylor D. Biology, Vol. 1. Moscow: Mir, 1996. p. 22. ↩
-
Animal Life, Vol. 1. Moscow: Prosveshchenie, 1968. p. 159. ↩
-
Ibid. pp. 120–125. ↩
-
Ibid. p. 98. ↩
-
Afanasyev Yu. I., Korolev V. V., Kotovsky E. F. Cell Nucleus and Some Issues of Cytogenetics. Moscow: Nauka, 1971. p. 19. ↩
-
Khesin Ya. E. Nuclear Size and Functional State of Cells. Moscow: Meditsina, 1967. p. 150. ↩
-
Mazia D. Mitosis and Physiology of Cell Division. Moscow: IL, 1963. ↩
-
Ibid. pp. 43, 45. ↩
-
Biological Encyclopedic Dictionary. Moscow: Great Russian Encyclopedia, 1995. p. 185. ↩
-
Tokin B. P. General Embryology. Moscow: Vysshaya Shkola, 1977. p. 90. ↩
-
Alberts B., Bray D., Lewis J., et al. Molecular Biology of the Cell, Vol. 3. Moscow: Mir, 1994. p. 27. ↩
-
Stanek I. Human Embryology. Bratislava: Veda, 1977. p. 105. ↩
-
Alberts B., Bray D., Lewis J., et al. Molecular Biology of the Cell, Vol. 3. Moscow: Mir, 1994. p. 30. ↩
-
Ibid. p. 8. ↩
-
BME, Vol. 30. ↩
-
Tovarnitsky V. I. Molecules and Viruses. Moscow: Sovetskaya Rossiya, 1978. ↩
-
Ibid. p. 86. ↩
-
Ibid. p. 34. ↩
-
Ibid. pp. 34–35. ↩
-
Ibid. p. 35. ↩
-
Ibid. pp. 97–98. ↩
-
Luria S., Darnell J. General Virology. Moscow: Mir, 1970. pp. 280, 282. ↩
-
Avakyan A. A., Bykovsky A. F. Atlas of Anatomy and Ontogenesis of Human and Animal Viruses. Moscow: Meditsina, 1970. p. 175. ↩
-
Bulanov P. A., Kolesko O. I. General Microbiology. Minsk: Vyshaya Shkola, 1969. p. 106. ↩
-
Green N., Stout U., Taylor D. Biology, Vol. 1. Moscow: Mir, 1996. p. 19. ↩
-
Avakyan A. A., Katz L. N., Pavlova I. V. Atlas of Anatomy of Bacteria Pathogenic to Humans and Animals. Moscow: Meditsina, 1972. ↩
-
Alov I. A., Braude A. I., Askiz M. E. Fundamentals of Functional Cell Morphology. Moscow: Meditsina, 1969. p. 247. ↩
-
Avakyan A. A., Katz L. N., Pavlova I. V. Atlas of Anatomy of Bacteria Pathogenic to Humans and Animals. Moscow: Meditsina, 1972. p. 21. ↩
-
Garshin A. P., Gropyanyov V. M., Zaitsev G. P., Semenov S. S. Machine-Building Ceramics. St. Petersburg: GGU, 1997. p. 152. ↩
-
Alfvén H., Arrhenius G. Evolution of the Solar System. Moscow: Mir, 1979. p. 154. ↩
-
Ibid. pp. 150–151. ↩
-
Ibid. p. 162. ↩
-
Khodkov A. E., Vinogradova M. G. On the Core Problems of Natural Science. St. Petersburg: Nedra, 1977. ↩
-
Sobotovich E. V. Cosmic Matter in the Earth's Crust. Moscow: Atomizdat, 1976. ↩
-
Sukhonos S. I. Does Cosmic Dust Stimulate Evolution? // Chemistry and Life, 1988, No. 1, pp. 91–93. ↩
-
Alfvén H., Arrhenius G. Cited source. p. 162. ↩
-
Sobotovich E. V. Cosmic Matter in the Earth's Crust. Moscow: Atomizdat, 1976. p. 35. ↩
-
Khodkov A. E., Vinogradova M. G. On the Core Problems of Natural Science. St. Petersburg: Nedra, 1997. ↩
-
Vasiliev V. A. Long-term Forecasting of the Development of Complex Social Systems (States, Civilizations). Monograph. Moscow: 1998. ↩
-
Dimont M. Jews, God, and History. Moscow: ImageSet, 1994. p. 41. ↩
-
Compiled by Bodo Harenberg. Chronicle of Humanity. Moscow: Great Encyclopedia, 1996. p. 58. ↩
-
Sukhonos S. I. Russia in the 21st Century. Moscow: Agar, 1997. ↩
-
Shklovsky I. S. Stars: Their Birth, Life, and Death. Moscow: Nauka, 1977. p. 65. ↩
-
Vorontsov-Velyaminov B. A. Extragalactic Astronomy. Moscow: Nauka, 1978. pp. 331–337. ↩
-
Ibid. p. 173. ↩
-
Bronshtein V. A. Hypotheses About Stars and the Universe. Moscow: Nauka, 1974. p. 307. ↩
-
Martynov D. Ya. Course of General Astrophysics. Moscow: Nauka, 1979. p. 458. ↩
-
Problems of Modern Cosmology. Moscow: Nauka, 1972. ↩
-
Vorontsov-Velyaminov B. A. Extragalactic Astronomy. Moscow: Nauka, 1978. p. 364. ↩
-
Ibid. p. 365. ↩
-
Ibid. p. 368. ↩